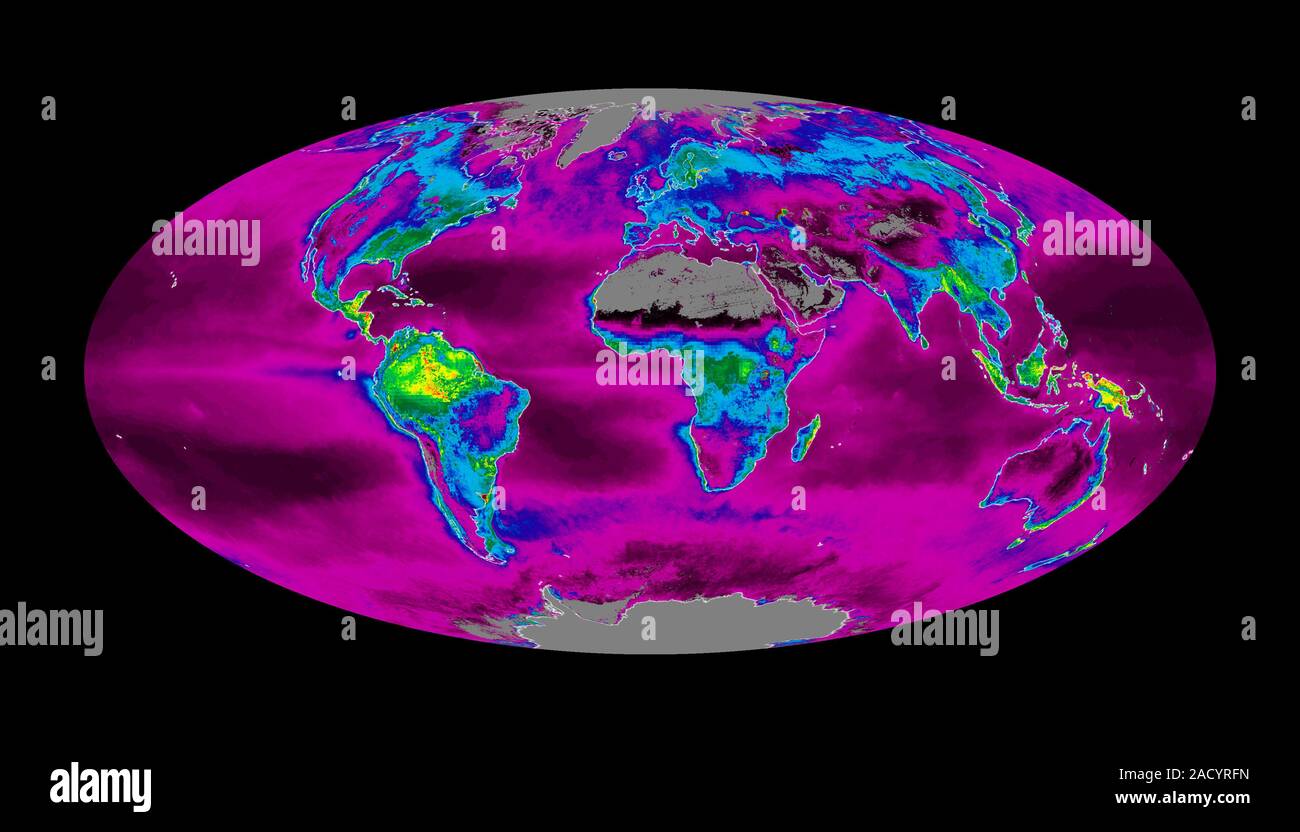
Global productivity levels. Map based on satellite data showing the Earth's net primary productivity in terms of its carbon metabolism, measured in ki
Image details
Contributor:
Science Photo Library / Alamy Stock PhotoImage ID:
2ACYRFNFile size:
30.2 MB (782.9 KB Compressed download)Releases:
Model - no | Property - noDo I need a release?Dimensions:
4300 x 2457 px | 36.4 x 20.8 cm | 14.3 x 8.2 inches | 300dpiDate taken:
2 December 2014Photographer:
NASA/MODIS SCIENCE TEAM/SCIENCE PHOTO LIBRARYMore information:
Global productivity levels. Map based on satellite data showing the Earth's net primary productivity in terms of its carbon metabolism, measured in kilograms of carbon fixed via photosynthesis per square kilometre per year. The colour-coding shows this rate varying from close to zero (black-purple) through 1 and 2 (blue-green-yellow) to 3 (red). Tropical rainforests are generally the most productive places on Earth, though ongoing productivity at the surface of the world's oceans, over such a widespread area, makes them roughly as productive as the land. The data (obtained by the MODIS sensors on the Terra and Aqua satellites) is for the years 2001 and 2002.