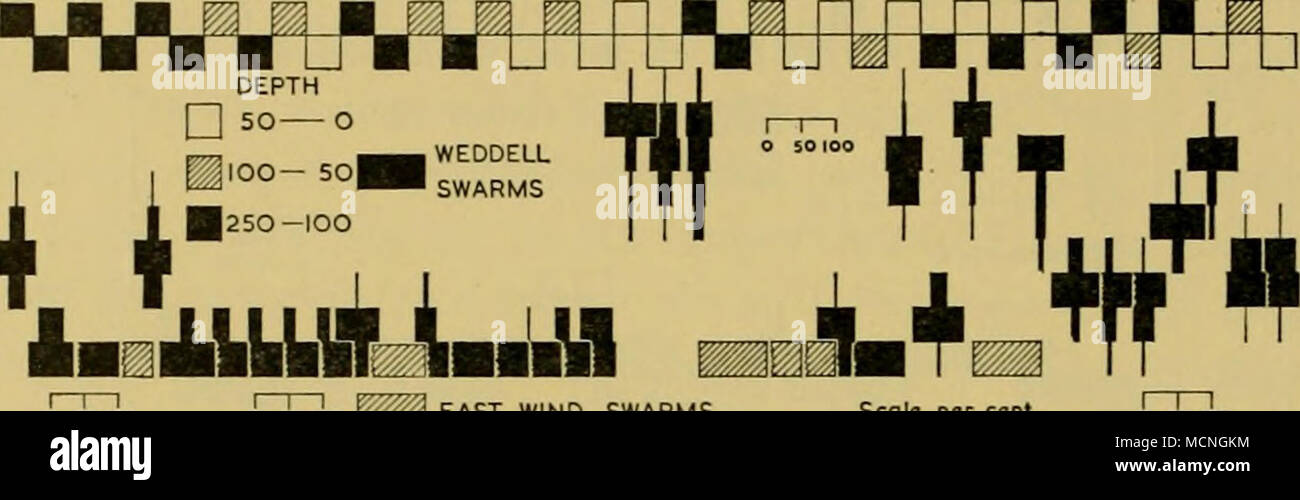
. ImnMAJUidmdJA o so 100 k'./,,J EAST WIND SWARMS Scale per cenl 6 FURC 5 ' 4 > 3 " 2 ⢠I 3 CAL 2 " I META 2 NAUP N2EXAM- -INED 50 21 44 156 47 43 56 20 87 36 65 119 80 III 287 15 89 490 353 8 12 115 545 113 9 94 367 325 48 97 90 35 39 I 119 98 108 148 N2 EXAM- -INED Fig. 35. The patches as swarms. Stage frequency in larval samples, showing high modal value of stage in samples from above 250 m. See legend to Fig. 34. Samples at stations 193 and 194 are from the Bransfield Strait. i APRIL MAY JUNE 2 3 4I4I4I5I5I6I517 19 20202020202020 21 22 22 22 23 25 25 26 27 27 27 28 30 I 2 3 4
Image details
Contributor:
The Bookworm Collection / Alamy Stock PhotoImage ID:
MCNGKMFile size:
14.3 MB (354.6 KB Compressed download)Releases:
Model - no | Property - noDo I need a release?Dimensions:
3977 x 1257 px | 33.7 x 10.6 cm | 13.3 x 4.2 inches | 300dpiMore information:
This image is a public domain image, which means either that copyright has expired in the image or the copyright holder has waived their copyright. Alamy charges you a fee for access to the high resolution copy of the image.
This image could have imperfections as it’s either historical or reportage.
. ImnMAJUidmdJA o so 100 k'./, , J EAST WIND SWARMS Scale per cenl 6 FURC 5 ' 4 > 3 " 2 ⢠I 3 CAL 2 " I META 2 NAUP N2EXAM- -INED 50 21 44 156 47 43 56 20 87 36 65 119 80 III 287 15 89 490 353 8 12 115 545 113 9 94 367 325 48 97 90 35 39 I 119 98 108 148 N2 EXAM- -INED Fig. 35. The patches as swarms. Stage frequency in larval samples, showing high modal value of stage in samples from above 250 m. See legend to Fig. 34. Samples at stations 193 and 194 are from the Bransfield Strait. i APRIL MAY JUNE 2 3 4I4I4I5I5I6I517 19 20202020202020 21 22 22 22 23 25 25 26 27 27 27 28 30 I 2 3 4| I 2 3 5 6 8 9 9 lO W529 1331 2315 2318 2320 WI98 854 854 855 W200 2335 1346 1350 I3S1 2345 1353 1355 1357 1781 1785 1790 1792 198 2315 2318 2320 WI97 WI99 854 855 855 W20I 2335 1348 23442346 1352 1354 1356 1779 1782 1790 1792 1794 DEPTH FURC 6 > 5 â 4 ⢠3 " 2 " I CAL 3 ⢠2 ⢠I META NAUP 2 STATION DEPTH o so 100 Stole per ce .'â '-'- ^1^ V-^j _ .3.M.. '""'""' I I _ ^^ I 11 M ^^^ ° '°'°° HH m WEDDELL SWARMS Y' '^gj EAST WIND SWARMS 6 FURC 5 ⢠4 " 3 â ' 2 " I 3 CAL 2 » I META 2 NAUP N2EXAM- - INED 90 68 1057 532 158 25 5 108 55 154 15 84 177 100 159 72 100 143 152 344 90 289 72 209 220 167 64 45 43 98 II 19 45 14 34 53 lOO 100 80 25 28 79 79 201 N9EXAM- -INED Fig. 36. The patches as swarms. Stage frequency in larval samples, showing high modal value of stage in samples from above 250 m. See legend to Fig. 34. Sample at Station 198 from the Bransfield Strait. MONTH JUNE SEP MONTH DATE STATION DEPTH FURC 6 5 ⢠4 â 3 ⢠2 I CAL 3 " 2 I META NAUP 2 14 27 28 27 28 24 24 228022801 383 383 861 862 | 887 888 | 912 2843|2879 I n Scole per c«nl o so too 1^ ti- Jim ^k I i^b o so too â I I â r-iâi I o so 100 DEpTi # DEPTH r~] 50- o ^ 100- 50 â 250-100 o so loo o so lOO DATE STATION DEPTH 5 FURC 5 4 3 2 I 3 CAL 2 > 1 ' META 2 NAUP NS EXAM- -INEO 34 376 620 168 230 72 56 25 1480 17 12 N» EXAM- -