30 meter curve Stock Photos and Images
 Photograph taken by Lt. Wm. Fox, S.C., shows a 30 meter curve on a light railway. In the distance, a meter gauge railroad bridge can be seen destroyed. The location is Bouillonville. This photo was issued on 02 number 1-23-19 and received under reference number 46447 335-F9. Stock Photohttps://www.alamy.com/image-license-details/?v=1https://www.alamy.com/photograph-taken-by-lt-wm-fox-sc-shows-a-30-meter-curve-on-a-light-railway-in-the-distance-a-meter-gauge-railroad-bridge-can-be-seen-destroyed-the-location-is-bouillonville-this-photo-was-issued-on-02-number-1-23-19-and-received-under-reference-number-46447-335-f9-image558389228.html
RM2RCCR4C–Photograph taken by Lt. Wm. Fox, S.C., shows a 30 meter curve on a light railway. In the distance, a meter gauge railroad bridge can be seen destroyed. The location is Bouillonville. This photo was issued on 02 number 1-23-19 and received under reference number 46447 335-F9.
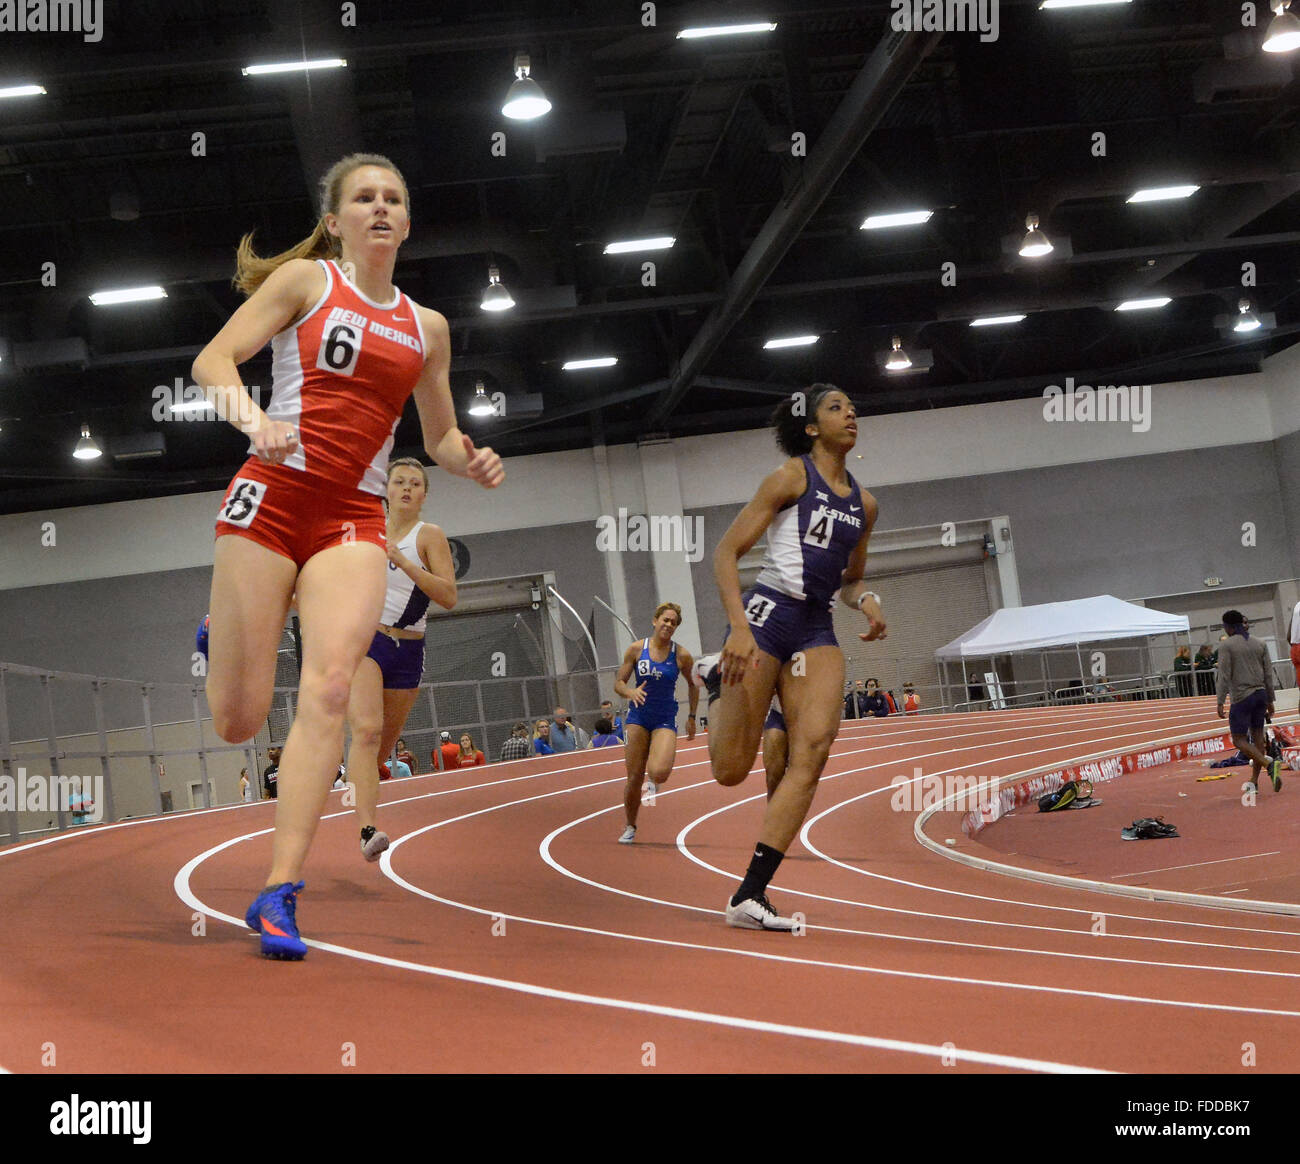 Albuquerque, NM, USA. 30th Jan, 2016. UNM's Haley Sanner rounds the curve in the Women's 400 meter Dash. Saturday, Jan. 30, 2016. © Jim Thompson/Albuquerque Journal/ZUMA Wire/Alamy Live News Stock Photohttps://www.alamy.com/image-license-details/?v=1https://www.alamy.com/stock-photo-albuquerque-nm-usa-30th-jan-2016-unms-haley-sanner-rounds-the-curve-94336907.html
RMFDDBK7–Albuquerque, NM, USA. 30th Jan, 2016. UNM's Haley Sanner rounds the curve in the Women's 400 meter Dash. Saturday, Jan. 30, 2016. © Jim Thompson/Albuquerque Journal/ZUMA Wire/Alamy Live News
 Yellow measurement tape. Old sewing tailor tool , against dark red background. Stock Photohttps://www.alamy.com/image-license-details/?v=1https://www.alamy.com/yellow-measurement-tape-old-sewing-tailor-tool-against-dark-red-background-image616733113.html
RF2XRAHAH–Yellow measurement tape. Old sewing tailor tool , against dark red background.
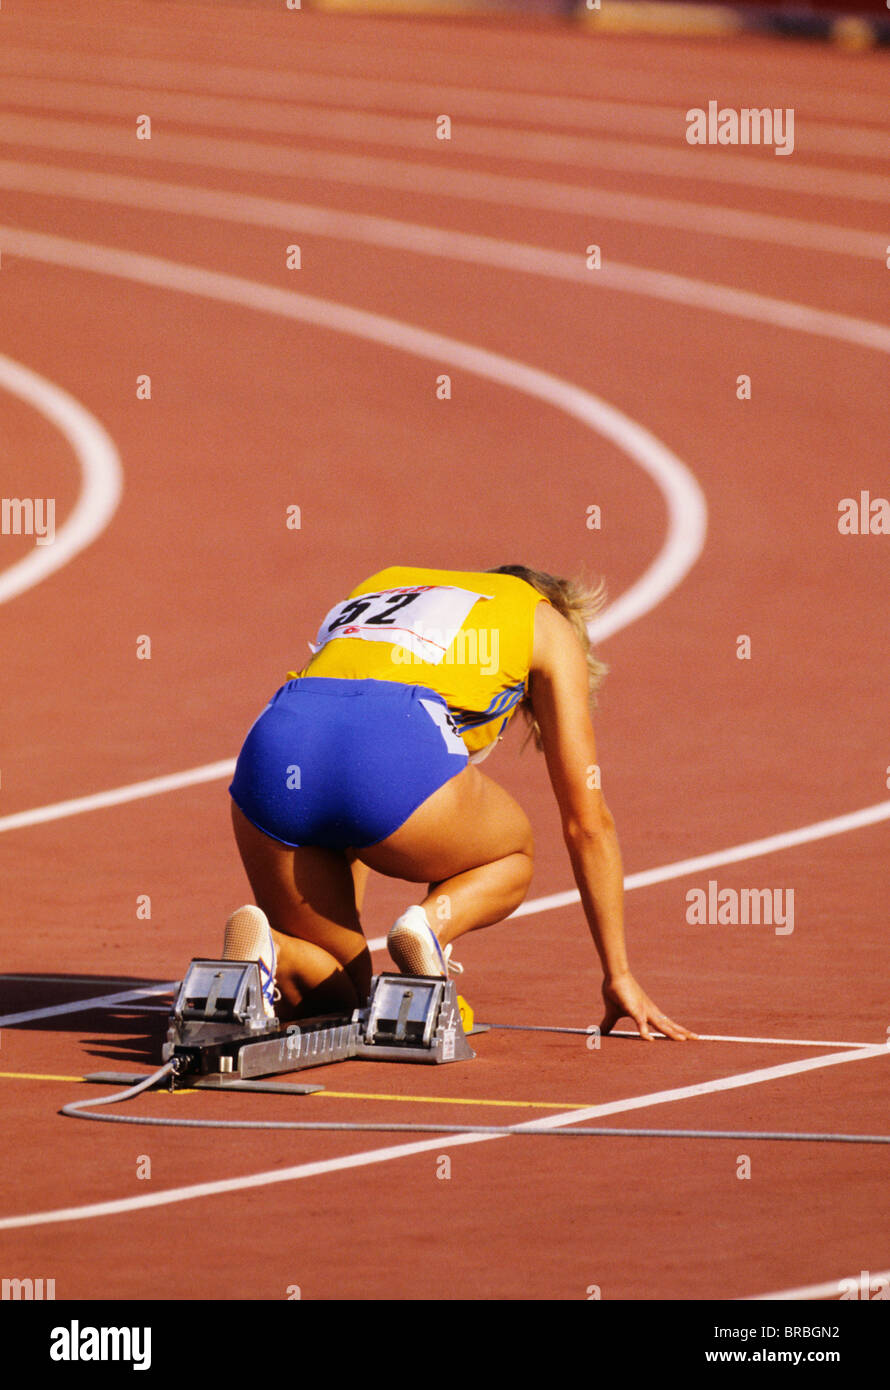 Female athlete crouches in blocks at start of 200 meter race Stock Photohttps://www.alamy.com/image-license-details/?v=1https://www.alamy.com/stock-photo-female-athlete-crouches-in-blocks-at-start-of-200-meter-race-31602062.html
RMBRBGN2–Female athlete crouches in blocks at start of 200 meter race
 The lighthouse is located on the Urbas Hill, Nidden, Nida, Neringa, Curonian spit, Lithuania, Baltic States, Europe Stock Photohttps://www.alamy.com/image-license-details/?v=1https://www.alamy.com/stock-photo-the-lighthouse-is-located-on-the-urbas-hill-nidden-nida-neringa-curonian-123760292.html
RMH59NEC–The lighthouse is located on the Urbas Hill, Nidden, Nida, Neringa, Curonian spit, Lithuania, Baltic States, Europe
 . A new thermo-electric fluid-meter and hot-wire anemometer. the following page, and israther unusual in that its inversion tenrperatureoccurs at about 40° C» In this respect its behavioris somewhat similar to that of copper-zinc, the in-version temperature of which comes to 30° 0, Anothercombination, which has its inversion temperature near0°, is iron cadinum, and its inversion temperaturecomes at 170°. Prom the appearance of the accompanyingcurve for the copper-tungsten couple, it is inferredthat the thermoelectric curve is not a true parabola,as was also observed by Dewar and Fleming on num Stock Photohttps://www.alamy.com/image-license-details/?v=1https://www.alamy.com/a-new-thermo-electric-fluid-meter-and-hot-wire-anemometer-the-following-page-and-israther-unusual-in-that-its-inversion-tenrperatureoccurs-at-about-40-c-in-this-respect-its-behavioris-somewhat-similar-to-that-of-copper-zinc-the-in-version-temperature-of-which-comes-to-30-0-anothercombination-which-has-its-inversion-temperature-near0-is-iron-cadinum-and-its-inversion-temperaturecomes-at-170-prom-the-appearance-of-the-accompanyingcurve-for-the-copper-tungsten-couple-it-is-inferredthat-the-thermoelectric-curve-is-not-a-true-parabolaas-was-also-observed-by-dewar-and-fleming-on-num-image336868739.html
RM2AG1KEB–. A new thermo-electric fluid-meter and hot-wire anemometer. the following page, and israther unusual in that its inversion tenrperatureoccurs at about 40° C» In this respect its behavioris somewhat similar to that of copper-zinc, the in-version temperature of which comes to 30° 0, Anothercombination, which has its inversion temperature near0°, is iron cadinum, and its inversion temperaturecomes at 170°. Prom the appearance of the accompanyingcurve for the copper-tungsten couple, it is inferredthat the thermoelectric curve is not a true parabola,as was also observed by Dewar and Fleming on num
 Pie chart with different segments in a circular diagram. wheel graph divided into parts and sections. Flat vector illustration isolated on white Stock Vectorhttps://www.alamy.com/image-license-details/?v=1https://www.alamy.com/pie-chart-with-different-segments-in-a-circular-diagram-wheel-graph-divided-into-parts-and-sections-flat-vector-illustration-isolated-on-white-image609130236.html
RF2XB07R8–Pie chart with different segments in a circular diagram. wheel graph divided into parts and sections. Flat vector illustration isolated on white
 Width Limit in Finland. Stock Photohttps://www.alamy.com/image-license-details/?v=1https://www.alamy.com/width-limit-in-finland-image558396459.html
RF2RCD4AK–Width Limit in Finland.
 'Photograph of a 30 meter curve light railway in Bouillonville, Meurthe et Moselle, France. The image shows a destroyed meter gauge railroad bridge in the distance. Taken by 46448 Lt. M. Fox, S.C. on 3-28-19 and received on 1-23-19. Description issued on 00 with the number 336-F9. Additional notes include reference to photograph 46445.' Stock Photohttps://www.alamy.com/image-license-details/?v=1https://www.alamy.com/photograph-of-a-30-meter-curve-light-railway-in-bouillonville-meurthe-et-moselle-france-the-image-shows-a-destroyed-meter-gauge-railroad-bridge-in-the-distance-taken-by-46448-lt-m-fox-sc-on-3-28-19-and-received-on-1-23-19-description-issued-on-00-with-the-number-336-f9-additional-notes-include-reference-to-photograph-46445-image558442491.html
RM2RCF72K–'Photograph of a 30 meter curve light railway in Bouillonville, Meurthe et Moselle, France. The image shows a destroyed meter gauge railroad bridge in the distance. Taken by 46448 Lt. M. Fox, S.C. on 3-28-19 and received on 1-23-19. Description issued on 00 with the number 336-F9. Additional notes include reference to photograph 46445.'
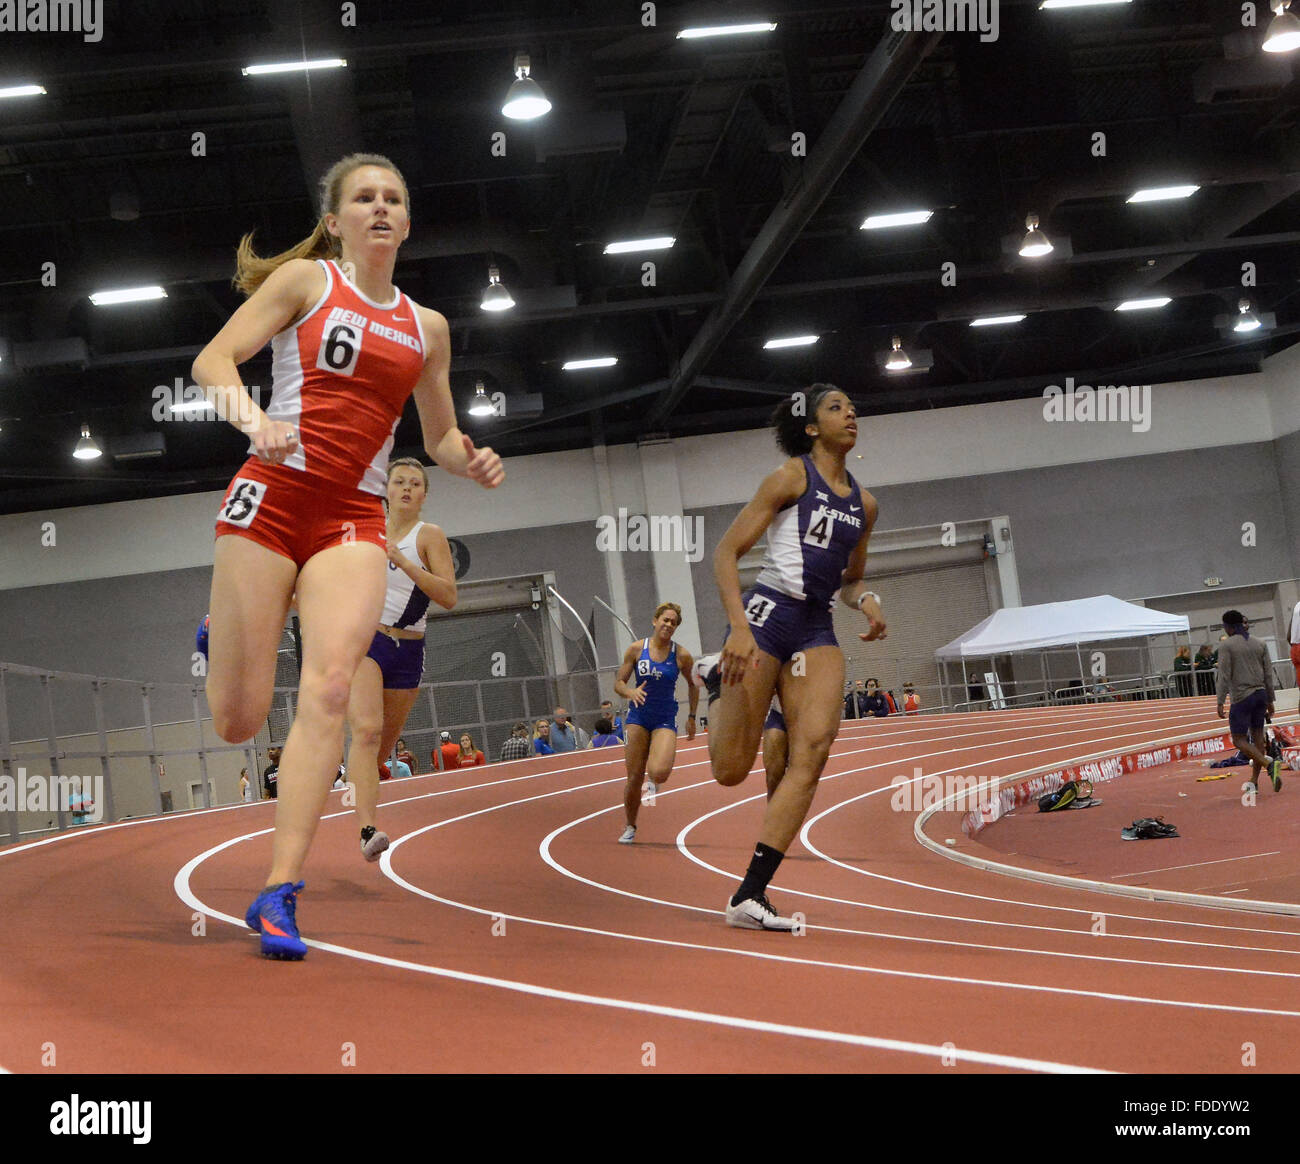 Albuquerque, NM, USA. 30th Jan, 2016. UNM's Haley Sanner rounds the curve in the Women's 400 meter Dash. Saturday, Jan. 30, 2016. © Jim Thompson/Albuquerque Journal/ZUMA Wire/Alamy Live News Stock Photohttps://www.alamy.com/image-license-details/?v=1https://www.alamy.com/stock-photo-albuquerque-nm-usa-30th-jan-2016-unms-haley-sanner-rounds-the-curve-94349614.html
RMFDDYW2–Albuquerque, NM, USA. 30th Jan, 2016. UNM's Haley Sanner rounds the curve in the Women's 400 meter Dash. Saturday, Jan. 30, 2016. © Jim Thompson/Albuquerque Journal/ZUMA Wire/Alamy Live News
 . The Bell System technical journal . 1.12 0.92 8 10 12 14 16 18 20 22FREQUENCY IN MEGACYCLES 24 26 28 30 Fig. 6—Lower. Experimental input impedance characteristics of 300 ohm linewith terminations shown in Fig. 5. Upper. Input impedance characteristics of50-meter 600 : 300 ohm line of No. 6 conductors. inches were inserted, resulting in Experimental Curve 3. Here themaxima and minima are displaced, indicating that the effect of thestray capacitance has been reduced to the same order of magnitude asthat due to the deviation of the resistance from the desired value. This EXPONENTIAL TRANSMISSIO Stock Photohttps://www.alamy.com/image-license-details/?v=1https://www.alamy.com/the-bell-system-technical-journal-112-092-8-10-12-14-16-18-20-22frequency-in-megacycles-24-26-28-30-fig-6lower-experimental-input-impedance-characteristics-of-300-ohm-linewith-terminations-shown-in-fig-5-upper-input-impedance-characteristics-of50-meter-600-300-ohm-line-of-no-6-conductors-inches-were-inserted-resulting-in-experimental-curve-3-here-themaxima-and-minima-are-displaced-indicating-that-the-effect-of-thestray-capacitance-has-been-reduced-to-the-same-order-of-magnitude-asthat-due-to-the-deviation-of-the-resistance-from-the-desired-value-this-exponential-transmissio-image376105391.html
RM2CRW27B–. The Bell System technical journal . 1.12 0.92 8 10 12 14 16 18 20 22FREQUENCY IN MEGACYCLES 24 26 28 30 Fig. 6—Lower. Experimental input impedance characteristics of 300 ohm linewith terminations shown in Fig. 5. Upper. Input impedance characteristics of50-meter 600 : 300 ohm line of No. 6 conductors. inches were inserted, resulting in Experimental Curve 3. Here themaxima and minima are displaced, indicating that the effect of thestray capacitance has been reduced to the same order of magnitude asthat due to the deviation of the resistance from the desired value. This EXPONENTIAL TRANSMISSIO
 Pie chart with different segments in a circular diagram. wheel graph divided into parts and sections. Flat vector illustration isolated on white Stock Vectorhttps://www.alamy.com/image-license-details/?v=1https://www.alamy.com/pie-chart-with-different-segments-in-a-circular-diagram-wheel-graph-divided-into-parts-and-sections-flat-vector-illustration-isolated-on-white-image609129899.html
RF2XB07B7–Pie chart with different segments in a circular diagram. wheel graph divided into parts and sections. Flat vector illustration isolated on white
 . The Street railway journal . thickness of from 25 cm to 30 cm, and a width of 2 m. Inthe cities, where paving is required, the rails are laid on asub-base of concrete. Within the cities and towns girder rails are used. Theserails have a weight of 30.46 kg per meter, a height of 115mm, a base of 88 mm, and a groove of 30 mm in depth.The rails are rolled in 12-m lengths. The ties, which are radius of 40 m. There are only two switches required onthe T-rail section, and these have an initial curve radiusof 50 m. In Bremgarten a waiting station has been erected, whichincludes not only rooms for p Stock Photohttps://www.alamy.com/image-license-details/?v=1https://www.alamy.com/the-street-railway-journal-thickness-of-from-25-cm-to-30-cm-and-a-width-of-2-m-inthe-cities-where-paving-is-required-the-rails-are-laid-on-asub-base-of-concrete-within-the-cities-and-towns-girder-rails-are-used-theserails-have-a-weight-of-3046-kg-per-meter-a-height-of-115mm-a-base-of-88-mm-and-a-groove-of-30-mm-in-depththe-rails-are-rolled-in-12-m-lengths-the-ties-which-are-radius-of-40-m-there-are-only-two-switches-required-onthe-t-rail-section-and-these-have-an-initial-curve-radiusof-50-m-in-bremgarten-a-waiting-station-has-been-erected-whichincludes-not-only-rooms-for-p-image371813823.html
RM2CGWG93–. The Street railway journal . thickness of from 25 cm to 30 cm, and a width of 2 m. Inthe cities, where paving is required, the rails are laid on asub-base of concrete. Within the cities and towns girder rails are used. Theserails have a weight of 30.46 kg per meter, a height of 115mm, a base of 88 mm, and a groove of 30 mm in depth.The rails are rolled in 12-m lengths. The ties, which are radius of 40 m. There are only two switches required onthe T-rail section, and these have an initial curve radiusof 50 m. In Bremgarten a waiting station has been erected, whichincludes not only rooms for p
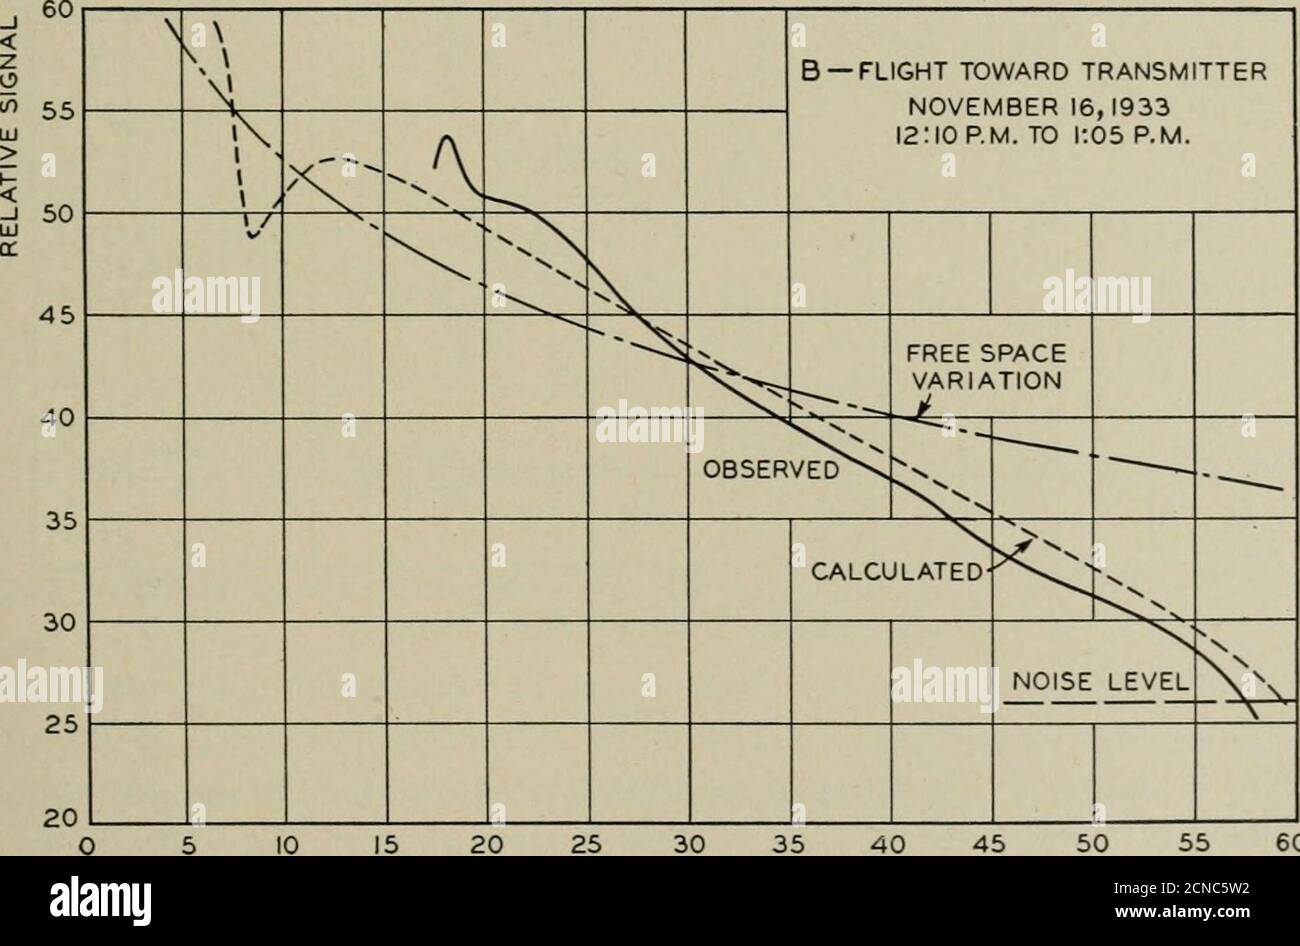 . The Bell System technical journal . s OBSERVED 1050 S 11 GRAZING INCIDENCE 1 1 - 1 JV -•s 1 1 1 1 0 10 20 30 40 50 60 70 80 90 100 110 120 130 MILES FROM TRANSMITTER Fig. 6—Flight toward transmitter. Wave-length—4.6 meters; Altitude—2500 feet;November 16, 1933; 12:10 p.m. to 1:05 p.m. beyond this the second curve lies 10 decibels below the first one.Evidently the plane noise troubles were due simply to the lower signallevel which had to be received. This level fell lower as the coldweather came on, and additional work on the plane electrical systemhad to be done. The 4.6 meter r Stock Photohttps://www.alamy.com/image-license-details/?v=1https://www.alamy.com/the-bell-system-technical-journal-s-observed-1050-s-11-grazing-incidence-1-1-1-jv-s-1-1-1-1-0-10-20-30-40-50-60-70-80-90-100-110-120-130-miles-from-transmitter-fig-6flight-toward-transmitter-wave-length46-meters-altitude2500-feetnovember-16-1933-1210-pm-to-105-pm-beyond-this-the-second-curve-lies-10-decibels-below-the-first-oneevidently-the-plane-noise-troubles-were-due-simply-to-the-lower-signallevel-which-had-to-be-received-this-level-fell-lower-as-the-coldweather-came-on-and-additional-work-on-the-plane-electrical-systemhad-to-be-done-the-46-meter-r-image374593550.html
RM2CNC5W2–. The Bell System technical journal . s OBSERVED 1050 S 11 GRAZING INCIDENCE 1 1 - 1 JV -•s 1 1 1 1 0 10 20 30 40 50 60 70 80 90 100 110 120 130 MILES FROM TRANSMITTER Fig. 6—Flight toward transmitter. Wave-length—4.6 meters; Altitude—2500 feet;November 16, 1933; 12:10 p.m. to 1:05 p.m. beyond this the second curve lies 10 decibels below the first one.Evidently the plane noise troubles were due simply to the lower signallevel which had to be received. This level fell lower as the coldweather came on, and additional work on the plane electrical systemhad to be done. The 4.6 meter r
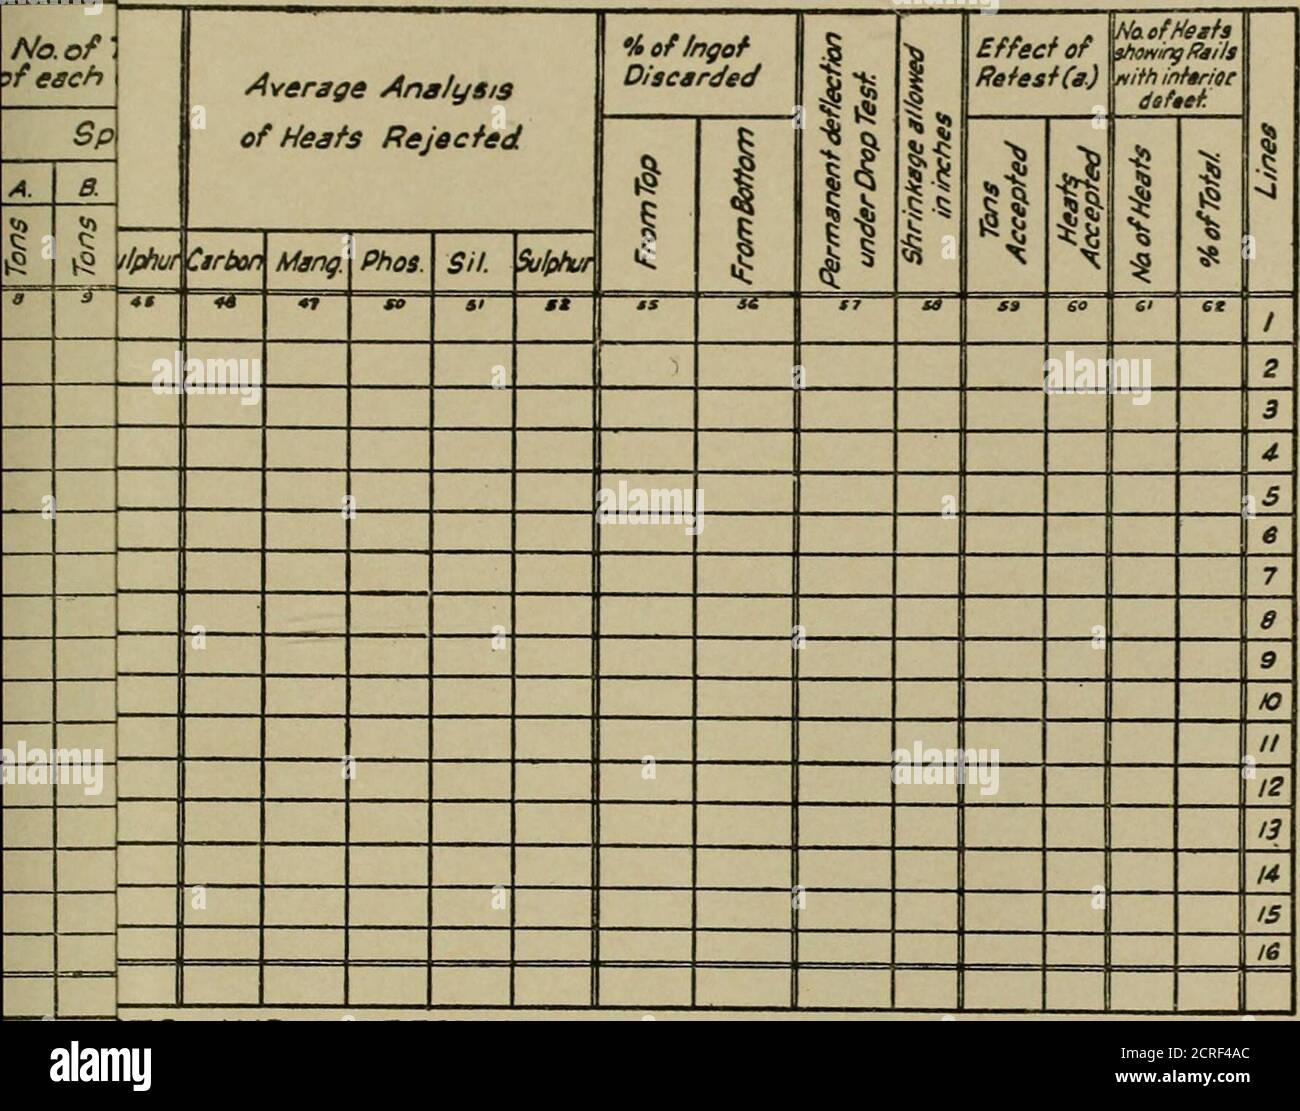 . Steel rails; their history, properties, strength and manufacture, with notes on the principles of rolling stock and track design . 10 15 20 26 30 35 40 45 50 56 4 5 10 16 20 26 30 35 40 46 60 65 5 5* 10 15 20 25 Plate XXXII. (Puppe.) — Power required to Roll Rails about 35.5 kg. per meter.For further data see Table XCVI. 45 50 66 6 6 10 U 15 20 - Output of Motors. Speed curve. , Work done by revolving massea when running light. isi^J^verdjaa Am/ys/j cff/egfs Accepted,yifi^er coii/mn 4S, Si/lphur. sdd 2co/umnspiifhout handings fohe numbered 46 A 4 7. ZndAverage Ans/ysis of/Zeafs FejecfedAftor Stock Photohttps://www.alamy.com/image-license-details/?v=1https://www.alamy.com/steel-rails-their-history-properties-strength-and-manufacture-with-notes-on-the-principles-of-rolling-stock-and-track-design-10-15-20-26-30-35-40-45-50-56-4-5-10-16-20-26-30-35-40-46-60-65-5-5-10-15-20-25-plate-xxxii-puppe-power-required-to-roll-rails-about-355-kg-per-meterfor-further-data-see-table-xcvi-45-50-66-6-6-10-u-15-20-output-of-motors-speed-curve-work-done-by-revolving-massea-when-running-light-isijverdjaa-amysj-cffegfs-acceptedyifier-coiimn-4s-silphur-sdd-2coumnspiifhout-handings-fohe-numbered-46-a-4-7-zndaverage-ansysis-ofzeafs-fejecfedaftor-image375887524.html
RM2CRF4AC–. Steel rails; their history, properties, strength and manufacture, with notes on the principles of rolling stock and track design . 10 15 20 26 30 35 40 45 50 56 4 5 10 16 20 26 30 35 40 46 60 65 5 5* 10 15 20 25 Plate XXXII. (Puppe.) — Power required to Roll Rails about 35.5 kg. per meter.For further data see Table XCVI. 45 50 66 6 6 10 U 15 20 - Output of Motors. Speed curve. , Work done by revolving massea when running light. isi^J^verdjaa Am/ys/j cff/egfs Accepted,yifi^er coii/mn 4S, Si/lphur. sdd 2co/umnspiifhout handings fohe numbered 46 A 4 7. ZndAverage Ans/ysis of/Zeafs FejecfedAftor
 . Carnegie Institution of Washington publication. Effect of history previous to excitation. Excitation and decay at room temperature. Excited 30 seconds. Curve .1, excited after action of infra-red; curve B, excited immediately after curve A; curve (', excited immediately after curve B; curve D, before exciting for curve D, the powder was excited for 10 minutes and allowed to decay to an intensity corresponding to D =9 in the figure, at which time.the excitation of 30 seconds was begun. In the case of calcium sulphide, it is not necessary to use a spectrophoto- meter to prove that there is mor Stock Photohttps://www.alamy.com/image-license-details/?v=1https://www.alamy.com/carnegie-institution-of-washington-publication-effect-of-history-previous-to-excitation-excitation-and-decay-at-room-temperature-excited-30-seconds-curve-1-excited-after-action-of-infra-red-curve-b-excited-immediately-after-curve-a-curve-excited-immediately-after-curve-b-curve-d-before-exciting-for-curve-d-the-powder-was-excited-for-10-minutes-and-allowed-to-decay-to-an-intensity-corresponding-to-d-=9-in-the-figure-at-which-timethe-excitation-of-30-seconds-was-begun-in-the-case-of-calcium-sulphide-it-is-not-necessary-to-use-a-spectrophoto-meter-to-prove-that-there-is-mor-image233486419.html
RMRFT68K–. Carnegie Institution of Washington publication. Effect of history previous to excitation. Excitation and decay at room temperature. Excited 30 seconds. Curve .1, excited after action of infra-red; curve B, excited immediately after curve A; curve (', excited immediately after curve B; curve D, before exciting for curve D, the powder was excited for 10 minutes and allowed to decay to an intensity corresponding to D =9 in the figure, at which time.the excitation of 30 seconds was begun. In the case of calcium sulphide, it is not necessary to use a spectrophoto- meter to prove that there is mor
![. Collected reprints / Atlantic Oceanographic and Meteorological Laboratories [and] Pacific Oceanographic Laboratories. Oceanography Periodicals.. M15. to 20 30 W CURRENT VELOCITY (cm/sec) Fig.2. Calibration curve for sphere flow meter. Sphere deflection was plotted against the average flow velocity (total discharge/cross-sectional area) in an enclosed recirculating laboratory flume (4 cm x 17 cm flow cross-section) during three separate runs. Velocities of less than about 5 cm/sec and velocities above about 45—50 cm/sec did not produce noticeable changes in sphere deflection. Two linear range Stock Photo . Collected reprints / Atlantic Oceanographic and Meteorological Laboratories [and] Pacific Oceanographic Laboratories. Oceanography Periodicals.. M15. to 20 30 W CURRENT VELOCITY (cm/sec) Fig.2. Calibration curve for sphere flow meter. Sphere deflection was plotted against the average flow velocity (total discharge/cross-sectional area) in an enclosed recirculating laboratory flume (4 cm x 17 cm flow cross-section) during three separate runs. Velocities of less than about 5 cm/sec and velocities above about 45—50 cm/sec did not produce noticeable changes in sphere deflection. Two linear range Stock Photo](https://c8.alamy.com/comp/REHBW7/collected-reprints-atlantic-oceanographic-and-meteorological-laboratories-and-pacific-oceanographic-laboratories-oceanography-periodicals-m15-to-20-30-w-current-velocity-cmsec-fig2-calibration-curve-for-sphere-flow-meter-sphere-deflection-was-plotted-against-the-average-flow-velocity-total-dischargecross-sectional-area-in-an-enclosed-recirculating-laboratory-flume-4-cm-x-17-cm-flow-cross-section-during-three-separate-runs-velocities-of-less-than-about-5-cmsec-and-velocities-above-about-4550-cmsec-did-not-produce-noticeable-changes-in-sphere-deflection-two-linear-range-REHBW7.jpg) . Collected reprints / Atlantic Oceanographic and Meteorological Laboratories [and] Pacific Oceanographic Laboratories. Oceanography Periodicals.. M15. to 20 30 W CURRENT VELOCITY (cm/sec) Fig.2. Calibration curve for sphere flow meter. Sphere deflection was plotted against the average flow velocity (total discharge/cross-sectional area) in an enclosed recirculating laboratory flume (4 cm x 17 cm flow cross-section) during three separate runs. Velocities of less than about 5 cm/sec and velocities above about 45—50 cm/sec did not produce noticeable changes in sphere deflection. Two linear range Stock Photohttps://www.alamy.com/image-license-details/?v=1https://www.alamy.com/collected-reprints-atlantic-oceanographic-and-meteorological-laboratories-and-pacific-oceanographic-laboratories-oceanography-periodicals-m15-to-20-30-w-current-velocity-cmsec-fig2-calibration-curve-for-sphere-flow-meter-sphere-deflection-was-plotted-against-the-average-flow-velocity-total-dischargecross-sectional-area-in-an-enclosed-recirculating-laboratory-flume-4-cm-x-17-cm-flow-cross-section-during-three-separate-runs-velocities-of-less-than-about-5-cmsec-and-velocities-above-about-4550-cmsec-did-not-produce-noticeable-changes-in-sphere-deflection-two-linear-range-image232722483.html
. Collected reprints / Atlantic Oceanographic and Meteorological Laboratories [and] Pacific Oceanographic Laboratories. Oceanography Periodicals.. M15. to 20 30 W CURRENT VELOCITY (cm/sec) Fig.2. Calibration curve for sphere flow meter. Sphere deflection was plotted against the average flow velocity (total discharge/cross-sectional area) in an enclosed recirculating laboratory flume (4 cm x 17 cm flow cross-section) during three separate runs. Velocities of less than about 5 cm/sec and velocities above about 45—50 cm/sec did not produce noticeable changes in sphere deflection. Two linear range Stock Photohttps://www.alamy.com/image-license-details/?v=1https://www.alamy.com/collected-reprints-atlantic-oceanographic-and-meteorological-laboratories-and-pacific-oceanographic-laboratories-oceanography-periodicals-m15-to-20-30-w-current-velocity-cmsec-fig2-calibration-curve-for-sphere-flow-meter-sphere-deflection-was-plotted-against-the-average-flow-velocity-total-dischargecross-sectional-area-in-an-enclosed-recirculating-laboratory-flume-4-cm-x-17-cm-flow-cross-section-during-three-separate-runs-velocities-of-less-than-about-5-cmsec-and-velocities-above-about-4550-cmsec-did-not-produce-noticeable-changes-in-sphere-deflection-two-linear-range-image232722483.htmlRMREHBW7–. Collected reprints / Atlantic Oceanographic and Meteorological Laboratories [and] Pacific Oceanographic Laboratories. Oceanography Periodicals.. M15. to 20 30 W CURRENT VELOCITY (cm/sec) Fig.2. Calibration curve for sphere flow meter. Sphere deflection was plotted against the average flow velocity (total discharge/cross-sectional area) in an enclosed recirculating laboratory flume (4 cm x 17 cm flow cross-section) during three separate runs. Velocities of less than about 5 cm/sec and velocities above about 45—50 cm/sec did not produce noticeable changes in sphere deflection. Two linear range
![. Collected reprints / Atlantic Oceanographic and Meteorological Laboratories [and] Pacific Oceanographic Laboratories. Oceanography Periodicals.. THE KINETIC ENERGY SPECTRUM (after Webster, 1967) PERIOD â HOURS -^,â MINUTES ân â n^âSECONDS I 30 10 CM O Id CO >s CM a Hi o > CD CC Hi UJ a H UJ z. .001 .01 .1 I 10 100 FREQUENCY, CYCLES PER HOUR 1000 Figure 5.1 Kinetic energy spectrum of current meter records taken in water 2600-m deep at 39.3°N, 70°W by the Woods Hole Oceanographic Institution. The area under the spectral curve is kept proportional to total kinetic energy in this energy Stock Photo . Collected reprints / Atlantic Oceanographic and Meteorological Laboratories [and] Pacific Oceanographic Laboratories. Oceanography Periodicals.. THE KINETIC ENERGY SPECTRUM (after Webster, 1967) PERIOD â HOURS -^,â MINUTES ân â n^âSECONDS I 30 10 CM O Id CO >s CM a Hi o > CD CC Hi UJ a H UJ z. .001 .01 .1 I 10 100 FREQUENCY, CYCLES PER HOUR 1000 Figure 5.1 Kinetic energy spectrum of current meter records taken in water 2600-m deep at 39.3°N, 70°W by the Woods Hole Oceanographic Institution. The area under the spectral curve is kept proportional to total kinetic energy in this energy Stock Photo](https://c8.alamy.com/comp/REHDM2/collected-reprints-atlantic-oceanographic-and-meteorological-laboratories-and-pacific-oceanographic-laboratories-oceanography-periodicals-the-kinetic-energy-spectrum-after-webster-1967-period-hours-minutes-n-nseconds-i-30-10-cm-o-id-co-gts-cm-a-hi-o-gt-cd-cc-hi-uj-a-h-uj-z-001-01-1-i-10-100-frequency-cycles-per-hour-1000-figure-51-kinetic-energy-spectrum-of-current-meter-records-taken-in-water-2600-m-deep-at-393n-70w-by-the-woods-hole-oceanographic-institution-the-area-under-the-spectral-curve-is-kept-proportional-to-total-kinetic-energy-in-this-energy-REHDM2.jpg) . Collected reprints / Atlantic Oceanographic and Meteorological Laboratories [and] Pacific Oceanographic Laboratories. Oceanography Periodicals.. THE KINETIC ENERGY SPECTRUM (after Webster, 1967) PERIOD â HOURS -^,â MINUTES ân â n^âSECONDS I 30 10 CM O Id CO >s CM a Hi o > CD CC Hi UJ a H UJ z. .001 .01 .1 I 10 100 FREQUENCY, CYCLES PER HOUR 1000 Figure 5.1 Kinetic energy spectrum of current meter records taken in water 2600-m deep at 39.3°N, 70°W by the Woods Hole Oceanographic Institution. The area under the spectral curve is kept proportional to total kinetic energy in this energy Stock Photohttps://www.alamy.com/image-license-details/?v=1https://www.alamy.com/collected-reprints-atlantic-oceanographic-and-meteorological-laboratories-and-pacific-oceanographic-laboratories-oceanography-periodicals-the-kinetic-energy-spectrum-after-webster-1967-period-hours-minutes-n-nseconds-i-30-10-cm-o-id-co-gts-cm-a-hi-o-gt-cd-cc-hi-uj-a-h-uj-z-001-01-1-i-10-100-frequency-cycles-per-hour-1000-figure-51-kinetic-energy-spectrum-of-current-meter-records-taken-in-water-2600-m-deep-at-393n-70w-by-the-woods-hole-oceanographic-institution-the-area-under-the-spectral-curve-is-kept-proportional-to-total-kinetic-energy-in-this-energy-image232723906.html
. Collected reprints / Atlantic Oceanographic and Meteorological Laboratories [and] Pacific Oceanographic Laboratories. Oceanography Periodicals.. THE KINETIC ENERGY SPECTRUM (after Webster, 1967) PERIOD â HOURS -^,â MINUTES ân â n^âSECONDS I 30 10 CM O Id CO >s CM a Hi o > CD CC Hi UJ a H UJ z. .001 .01 .1 I 10 100 FREQUENCY, CYCLES PER HOUR 1000 Figure 5.1 Kinetic energy spectrum of current meter records taken in water 2600-m deep at 39.3°N, 70°W by the Woods Hole Oceanographic Institution. The area under the spectral curve is kept proportional to total kinetic energy in this energy Stock Photohttps://www.alamy.com/image-license-details/?v=1https://www.alamy.com/collected-reprints-atlantic-oceanographic-and-meteorological-laboratories-and-pacific-oceanographic-laboratories-oceanography-periodicals-the-kinetic-energy-spectrum-after-webster-1967-period-hours-minutes-n-nseconds-i-30-10-cm-o-id-co-gts-cm-a-hi-o-gt-cd-cc-hi-uj-a-h-uj-z-001-01-1-i-10-100-frequency-cycles-per-hour-1000-figure-51-kinetic-energy-spectrum-of-current-meter-records-taken-in-water-2600-m-deep-at-393n-70w-by-the-woods-hole-oceanographic-institution-the-area-under-the-spectral-curve-is-kept-proportional-to-total-kinetic-energy-in-this-energy-image232723906.htmlRMREHDM2–. Collected reprints / Atlantic Oceanographic and Meteorological Laboratories [and] Pacific Oceanographic Laboratories. Oceanography Periodicals.. THE KINETIC ENERGY SPECTRUM (after Webster, 1967) PERIOD â HOURS -^,â MINUTES ân â n^âSECONDS I 30 10 CM O Id CO >s CM a Hi o > CD CC Hi UJ a H UJ z. .001 .01 .1 I 10 100 FREQUENCY, CYCLES PER HOUR 1000 Figure 5.1 Kinetic energy spectrum of current meter records taken in water 2600-m deep at 39.3°N, 70°W by the Woods Hole Oceanographic Institution. The area under the spectral curve is kept proportional to total kinetic energy in this energy
 . Bulletin of the Museum of Comparative Zoology at Harvard College. Zoology. BIGELOW: COASTAL WATER EXPLORATION. 127 Meter 0 10 20 30 40 SO 60 70 80 SO 100 110 120 130 V ;32;3^ —- B^ - I^ A -..^ ^— . ^ c i N D^ ^^ ^ V i A^ i 2f.5 22 23 .5 24 .5 25 .5 26 Fig. 39.— Density curves, for typical regions, July-August, 1916. A, Gulf of Maine, Station 10344. B, off Delaware Bay, Station 10382 (lower part, probable curve). C, off Chesapeake Bay, Station 10392. D, on Georges Bank, Station 10347. iMeter. Fig. 40.— Density profile from the Basin of the Gulf of Maine to Georges Bank, Jul Stock Photohttps://www.alamy.com/image-license-details/?v=1https://www.alamy.com/bulletin-of-the-museum-of-comparative-zoology-at-harvard-college-zoology-bigelow-coastal-water-exploration-127-meter-0-10-20-30-40-so-60-70-80-so-100-110-120-130-v-323-b-i-a-c-i-n-d-v-i-a-i-2f5-22-23-5-24-5-25-5-26-fig-39-density-curves-for-typical-regions-july-august-1916-a-gulf-of-maine-station-10344-b-off-delaware-bay-station-10382-lower-part-probable-curve-c-off-chesapeake-bay-station-10392-d-on-georges-bank-station-10347-imeter-fig-40-density-profile-from-the-basin-of-the-gulf-of-maine-to-georges-bank-jul-image233894885.html
RMRGER8N–. Bulletin of the Museum of Comparative Zoology at Harvard College. Zoology. BIGELOW: COASTAL WATER EXPLORATION. 127 Meter 0 10 20 30 40 SO 60 70 80 SO 100 110 120 130 V ;32;3^ —- B^ - I^ A -..^ ^— . ^ c i N D^ ^^ ^ V i A^ i 2f.5 22 23 .5 24 .5 25 .5 26 Fig. 39.— Density curves, for typical regions, July-August, 1916. A, Gulf of Maine, Station 10344. B, off Delaware Bay, Station 10382 (lower part, probable curve). C, off Chesapeake Bay, Station 10392. D, on Georges Bank, Station 10347. iMeter. Fig. 40.— Density profile from the Basin of the Gulf of Maine to Georges Bank, Jul