Quick filters:
4 6 micron Stock Photos and Images
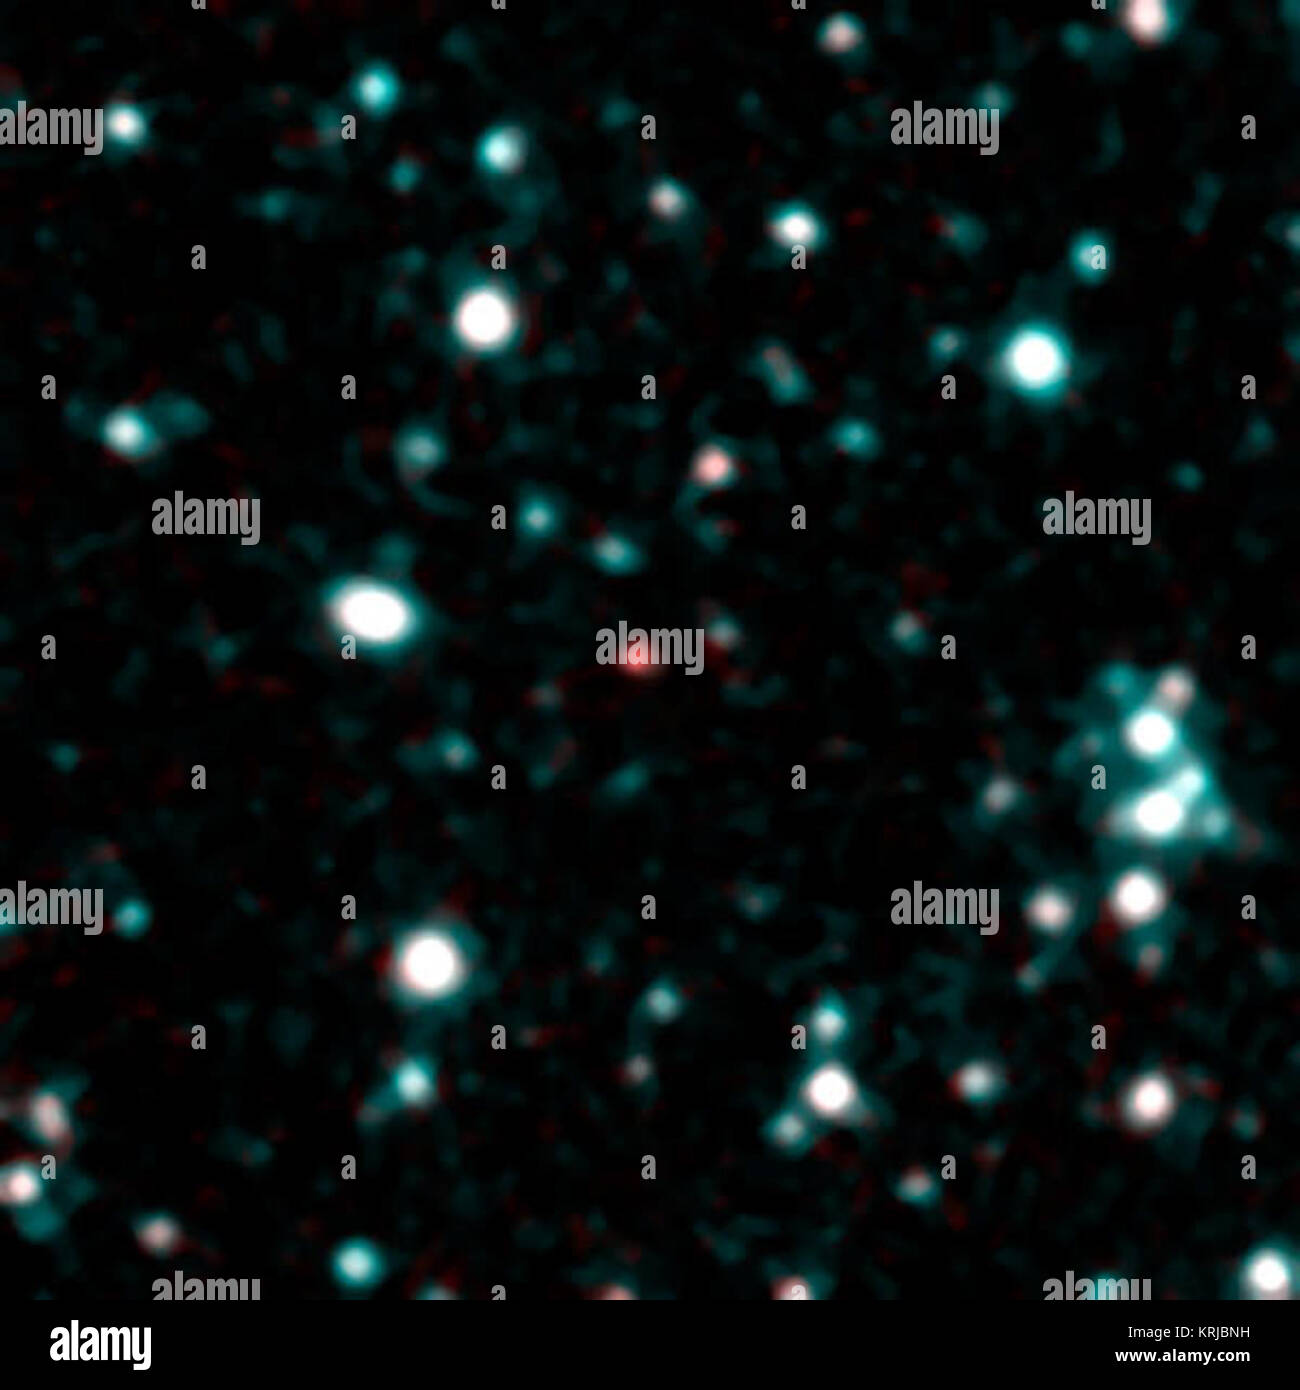 This image shows what astronomers think is one of the coldest brown dwarfs discovered so far (red dot in middle of frame). The object, called SDWFS J143524.44+335334.6, is one of 14 such brown dwarfs found by NASA's Spitzer Space Telescope using infrared light. Follow-up observations are required to nail down this 'failed' star's temperature, but rough estimates put this particular object at about 700 Kelvin (800 degrees Fahrenheit). In this image, infrared light with a wavelength of 3.6 microns is color-coded blue; 4.5-micron light is red. The brown dwarf shows up prominently in red because Stock Photohttps://www.alamy.com/image-license-details/?v=1https://www.alamy.com/stock-image-this-image-shows-what-astronomers-think-is-one-of-the-coldest-brown-169434765.html
RMKRJBNH–This image shows what astronomers think is one of the coldest brown dwarfs discovered so far (red dot in middle of frame). The object, called SDWFS J143524.44+335334.6, is one of 14 such brown dwarfs found by NASA's Spitzer Space Telescope using infrared light. Follow-up observations are required to nail down this 'failed' star's temperature, but rough estimates put this particular object at about 700 Kelvin (800 degrees Fahrenheit). In this image, infrared light with a wavelength of 3.6 microns is color-coded blue; 4.5-micron light is red. The brown dwarf shows up prominently in red because
 Kepler's Supernova Remnant: A View from Spitzer Space Telescope. This Spitzer false-colour image is a composite of data from the 24 micron channel of Spitzer's multiband imaging photometer (red), and three channels of its infrared array camera: 8 micron (yellow), 5.6 micron (blue), and 4.8 micron (green). Stars are most prominent in the two shorter wavelengths, causing them to show up as turquoise. Stock Photohttps://www.alamy.com/image-license-details/?v=1https://www.alamy.com/keplers-supernova-remnant-a-view-from-spitzer-space-telescope-this-spitzer-false-colour-image-is-a-composite-of-data-from-the-24-micron-channel-of-spitzers-multiband-imaging-photometer-red-and-three-channels-of-its-infrared-array-camera-8-micron-yellow-56-micron-blue-and-48-micron-green-stars-are-most-prominent-in-the-two-shorter-wavelengths-causing-them-to-show-up-as-turquoise-image626285667.html
RM2YAWNN7–Kepler's Supernova Remnant: A View from Spitzer Space Telescope. This Spitzer false-colour image is a composite of data from the 24 micron channel of Spitzer's multiband imaging photometer (red), and three channels of its infrared array camera: 8 micron (yellow), 5.6 micron (blue), and 4.8 micron (green). Stars are most prominent in the two shorter wavelengths, causing them to show up as turquoise.
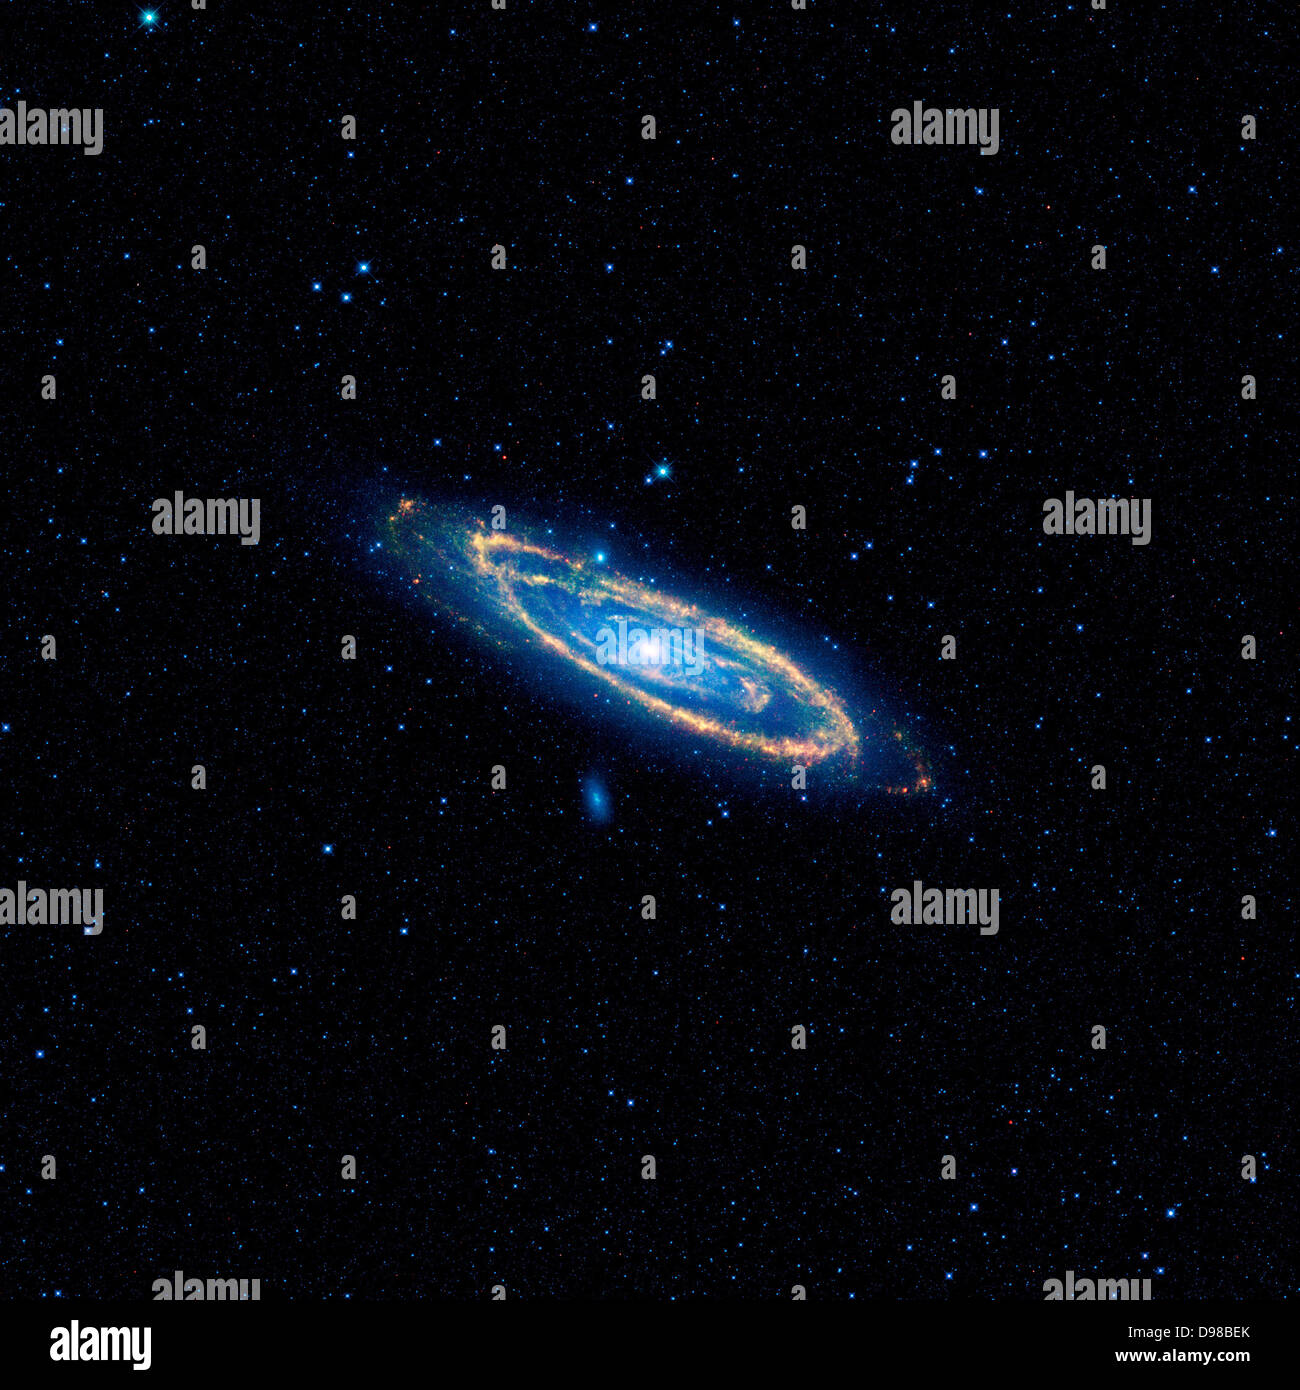 The immense Andromeda galaxy, also known as Messier 31 or simply M31, is captured in full in this new image from NASA's Stock Photohttps://www.alamy.com/image-license-details/?v=1https://www.alamy.com/stock-photo-the-immense-andromeda-galaxy-also-known-as-messier-31-or-simply-m31-57347659.html
RMD98BEK–The immense Andromeda galaxy, also known as Messier 31 or simply M31, is captured in full in this new image from NASA's
 . Transactions. s 0.05 micron. Still, themoving parts are so delicately adjusted that the measuring contacts thatbear against the amalgam can be separated by such a small force as thatproduced by pressing sidewise with the tip of a camels hair brush. ARTHUR W. GRAY 683 . The amalgam dilatometer is used for following the course of reactionexpansions from minute to minute throughout the day. Measurementscan be started within 1 min. after a cjdinder has been molded; but thefirst two or three observations are likeh to be affected by small errors / ^ / 2.5u/e>n ^ R95 0 12 3 4 5 6 7 hrs. Fi Stock Photohttps://www.alamy.com/image-license-details/?v=1https://www.alamy.com/transactions-s-005-micron-still-themoving-parts-are-so-delicately-adjusted-that-the-measuring-contacts-thatbear-against-the-amalgam-can-be-separated-by-such-a-small-force-as-thatproduced-by-pressing-sidewise-with-the-tip-of-a-camels-hair-brush-arthur-w-gray-683-the-amalgam-dilatometer-is-used-for-following-the-course-of-reactionexpansions-from-minute-to-minute-throughout-the-day-measurementscan-be-started-within-1-min-after-a-cjdinder-has-been-molded-but-thefirst-two-or-three-observations-are-likeh-to-be-affected-by-small-errors-25uegtn-r95-0-12-3-4-5-6-7-hrs-fi-image337084149.html
RM2AGBE7H–. Transactions. s 0.05 micron. Still, themoving parts are so delicately adjusted that the measuring contacts thatbear against the amalgam can be separated by such a small force as thatproduced by pressing sidewise with the tip of a camels hair brush. ARTHUR W. GRAY 683 . The amalgam dilatometer is used for following the course of reactionexpansions from minute to minute throughout the day. Measurementscan be started within 1 min. after a cjdinder has been molded; but thefirst two or three observations are likeh to be affected by small errors / ^ / 2.5u/e>n ^ R95 0 12 3 4 5 6 7 hrs. Fi
 . Electron microscopy; proceedings of the Stockholm Conference, September, 1956 . Fig. 3. Fibrillar zone of a contracted melanophore, the width being about 3.5 microns. Magnification 20,000. Fig. 4. Fibrillar zone of a dispersed melanophore, the width being about 0.4 micron. Magnification 17,000. Fig. 5. Longitudinally cut fibrils. Magnification x 33,000. Fig. 6. Transversely cut fibrils. Magnification < 55,000. membranes. The width of this fibrillar zone varies with the pigment dispersion. By fully dispersed melanophores the width is about 0.5 n and by fully concentrated melanophores the w Stock Photohttps://www.alamy.com/image-license-details/?v=1https://www.alamy.com/electron-microscopy-proceedings-of-the-stockholm-conference-september-1956-fig-3-fibrillar-zone-of-a-contracted-melanophore-the-width-being-about-35-microns-magnification-20000-fig-4-fibrillar-zone-of-a-dispersed-melanophore-the-width-being-about-04-micron-magnification-17000-fig-5-longitudinally-cut-fibrils-magnification-x-33000-fig-6-transversely-cut-fibrils-magnification-lt-55000-membranes-the-width-of-this-fibrillar-zone-varies-with-the-pigment-dispersion-by-fully-dispersed-melanophores-the-width-is-about-05-n-and-by-fully-concentrated-melanophores-the-w-image178411963.html
RMMA7A7R–. Electron microscopy; proceedings of the Stockholm Conference, September, 1956 . Fig. 3. Fibrillar zone of a contracted melanophore, the width being about 3.5 microns. Magnification 20,000. Fig. 4. Fibrillar zone of a dispersed melanophore, the width being about 0.4 micron. Magnification 17,000. Fig. 5. Longitudinally cut fibrils. Magnification x 33,000. Fig. 6. Transversely cut fibrils. Magnification < 55,000. membranes. The width of this fibrillar zone varies with the pigment dispersion. By fully dispersed melanophores the width is about 0.5 n and by fully concentrated melanophores the w
 Electron microscopy; proceedings of the Stockholm Conference, September, 1956 . electronmicrosco00euro Year: 1957 Fig. 3. Fibrillar zone of a contracted melanophore, the width being about 3.5 microns. Magnification 20,000. Fig. 4. Fibrillar zone of a dispersed melanophore, the width being about 0.4 micron. Magnification 17,000. Fig. 5. Longitudinally cut fibrils. Magnification x 33,000. Fig. 6. Transversely cut fibrils. Magnification < 55,000. membranes. The width of this fibrillar zone varies with the pigment dispersion. By fully dispersed melanophores the width is about 0.5 n and by full Stock Photohttps://www.alamy.com/image-license-details/?v=1https://www.alamy.com/electron-microscopy-proceedings-of-the-stockholm-conference-september-1956-electronmicrosco00euro-year-1957-fig-3-fibrillar-zone-of-a-contracted-melanophore-the-width-being-about-35-microns-magnification-20000-fig-4-fibrillar-zone-of-a-dispersed-melanophore-the-width-being-about-04-micron-magnification-17000-fig-5-longitudinally-cut-fibrils-magnification-x-33000-fig-6-transversely-cut-fibrils-magnification-lt-55000-membranes-the-width-of-this-fibrillar-zone-varies-with-the-pigment-dispersion-by-fully-dispersed-melanophores-the-width-is-about-05-n-and-by-full-image241024394.html
RMT03H22–Electron microscopy; proceedings of the Stockholm Conference, September, 1956 . electronmicrosco00euro Year: 1957 Fig. 3. Fibrillar zone of a contracted melanophore, the width being about 3.5 microns. Magnification 20,000. Fig. 4. Fibrillar zone of a dispersed melanophore, the width being about 0.4 micron. Magnification 17,000. Fig. 5. Longitudinally cut fibrils. Magnification x 33,000. Fig. 6. Transversely cut fibrils. Magnification < 55,000. membranes. The width of this fibrillar zone varies with the pigment dispersion. By fully dispersed melanophores the width is about 0.5 n and by full
 Astronomers using NASA's Spitzer Space Telescope have created this infrared image of the spiral galaxy M74, as seen by Spitzer's Infrared Array Camera. The blue dots represent hot gas and stars. The galaxy's cool dust is shown in red. The image is a false-color, infrared composite, in which 3.6-micron light is blue, 4.5-micron light is green, and 8-micron light is red. NASA's Spitzer Space Telescope View of M74 Stock Photohttps://www.alamy.com/image-license-details/?v=1https://www.alamy.com/stock-image-astronomers-using-nasas-spitzer-space-telescope-have-created-this-169431345.html
RMKRJ7BD–Astronomers using NASA's Spitzer Space Telescope have created this infrared image of the spiral galaxy M74, as seen by Spitzer's Infrared Array Camera. The blue dots represent hot gas and stars. The galaxy's cool dust is shown in red. The image is a false-color, infrared composite, in which 3.6-micron light is blue, 4.5-micron light is green, and 8-micron light is red. NASA's Spitzer Space Telescope View of M74
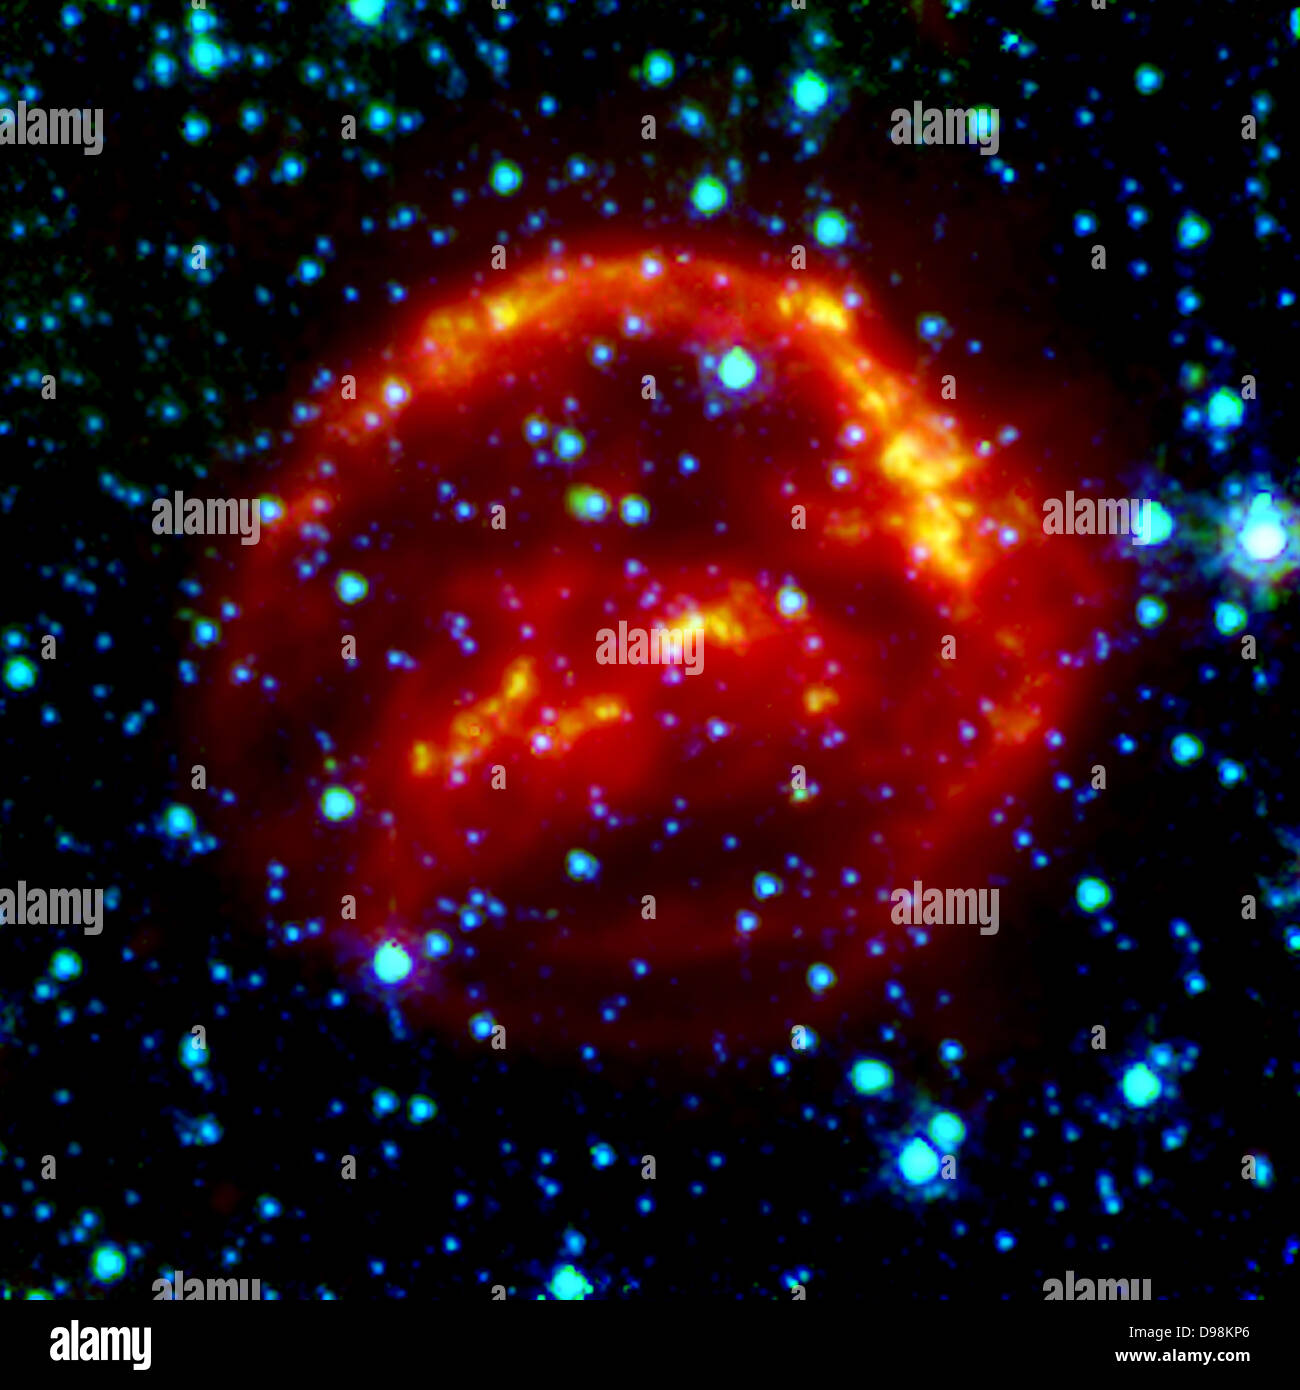 Kepler's Supernova Remnant: A View from Spitzer Space Telescope. This Spitzer false-colour image is a composite of data from Stock Photohttps://www.alamy.com/image-license-details/?v=1https://www.alamy.com/stock-photo-keplers-supernova-remnant-a-view-from-spitzer-space-telescope-this-57354142.html
RMD98KP6–Kepler's Supernova Remnant: A View from Spitzer Space Telescope. This Spitzer false-colour image is a composite of data from
 . The Biological bulletin. Biology; Zoology; Biology; Marine Biology. PELOMYXA CAROLINENSIS 217 vacuole had three; the other, one). Six hours after ingestion, there were six food- vacuoles present; all contained vacuole-refractive bodies; two contained hyaline nonstaining spherical bodies about 4 micra in diameter and of unknown composi- tion. Twelve hours after ingestion. there were numerous vacuole-refractive bodies in each of the six vacuoles and several crystals in four of them; the other two contained no crystals; the vacuole-refractive bodies varied from 1 micron to about 6 micra in diam Stock Photohttps://www.alamy.com/image-license-details/?v=1https://www.alamy.com/the-biological-bulletin-biology-zoology-biology-marine-biology-pelomyxa-carolinensis-217-vacuole-had-three-the-other-one-six-hours-after-ingestion-there-were-six-food-vacuoles-present-all-contained-vacuole-refractive-bodies-two-contained-hyaline-nonstaining-spherical-bodies-about-4-micra-in-diameter-and-of-unknown-composi-tion-twelve-hours-after-ingestion-there-were-numerous-vacuole-refractive-bodies-in-each-of-the-six-vacuoles-and-several-crystals-in-four-of-them-the-other-two-contained-no-crystals-the-vacuole-refractive-bodies-varied-from-1-micron-to-about-6-micra-in-diam-image234668656.html
RMRHP27C–. The Biological bulletin. Biology; Zoology; Biology; Marine Biology. PELOMYXA CAROLINENSIS 217 vacuole had three; the other, one). Six hours after ingestion, there were six food- vacuoles present; all contained vacuole-refractive bodies; two contained hyaline nonstaining spherical bodies about 4 micra in diameter and of unknown composi- tion. Twelve hours after ingestion. there were numerous vacuole-refractive bodies in each of the six vacuoles and several crystals in four of them; the other two contained no crystals; the vacuole-refractive bodies varied from 1 micron to about 6 micra in diam
 Electron microscopy; proceedings of the Stockholm Conference, September, 1956 . electronmicrosco00euro Year: 1957 Mechanism of Pigment Migration within Teleost Melanophores 215 Fig. 3. Fibrillar zone of a contracted melanophore, the width being about 3.5 microns. Magnification 20,000. Fig. 4. Fibrillar zone of a dispersed melanophore, the width being about 0.4 micron. Magnification 17,000. Fig. 5. Longitudinally cut fibrils. Magnification x 33,000. Fig. 6. Transversely cut fibrils. Magnification < 55,000. membranes. The width of this fibrillar zone varies with the pigment dispersion. By Stock Photohttps://www.alamy.com/image-license-details/?v=1https://www.alamy.com/electron-microscopy-proceedings-of-the-stockholm-conference-september-1956-electronmicrosco00euro-year-1957-mechanism-of-pigment-migration-within-teleost-melanophores-215-fig-3-fibrillar-zone-of-a-contracted-melanophore-the-width-being-about-35-microns-magnification-20000-fig-4-fibrillar-zone-of-a-dispersed-melanophore-the-width-being-about-04-micron-magnification-17000-fig-5-longitudinally-cut-fibrils-magnification-x-33000-fig-6-transversely-cut-fibrils-magnification-lt-55000-membranes-the-width-of-this-fibrillar-zone-varies-with-the-pigment-dispersion-by-image241024395.html
RMT03H23–Electron microscopy; proceedings of the Stockholm Conference, September, 1956 . electronmicrosco00euro Year: 1957 Mechanism of Pigment Migration within Teleost Melanophores 215 Fig. 3. Fibrillar zone of a contracted melanophore, the width being about 3.5 microns. Magnification 20,000. Fig. 4. Fibrillar zone of a dispersed melanophore, the width being about 0.4 micron. Magnification 17,000. Fig. 5. Longitudinally cut fibrils. Magnification x 33,000. Fig. 6. Transversely cut fibrils. Magnification < 55,000. membranes. The width of this fibrillar zone varies with the pigment dispersion. By
 These images are some of the first to be taken during Spitzer's warm mission -- a new phase that began after the telescope, which operated for more than five-and-a-half years, ran out of liquid coolant. The pictures were snapped with the two infrared channels that still work at Spitzer's still-quite-chilly temperature of 30 Kelvin (about minus 406 Fahrenheit). The two infrared channels are part of Spitzer's infrared array camera: 3.6-micron light is blue and 4.5-micron light is orange. The main picture shows a cloud, known as DR22, bursting with new stars in the Cygnus region of the sky. Spi Stock Photohttps://www.alamy.com/image-license-details/?v=1https://www.alamy.com/stock-image-these-images-are-some-of-the-first-to-be-taken-during-spitzers-warm-169432678.html
RMKRJ932–These images are some of the first to be taken during Spitzer's warm mission -- a new phase that began after the telescope, which operated for more than five-and-a-half years, ran out of liquid coolant. The pictures were snapped with the two infrared channels that still work at Spitzer's still-quite-chilly temperature of 30 Kelvin (about minus 406 Fahrenheit). The two infrared channels are part of Spitzer's infrared array camera: 3.6-micron light is blue and 4.5-micron light is orange. The main picture shows a cloud, known as DR22, bursting with new stars in the Cygnus region of the sky. Spi
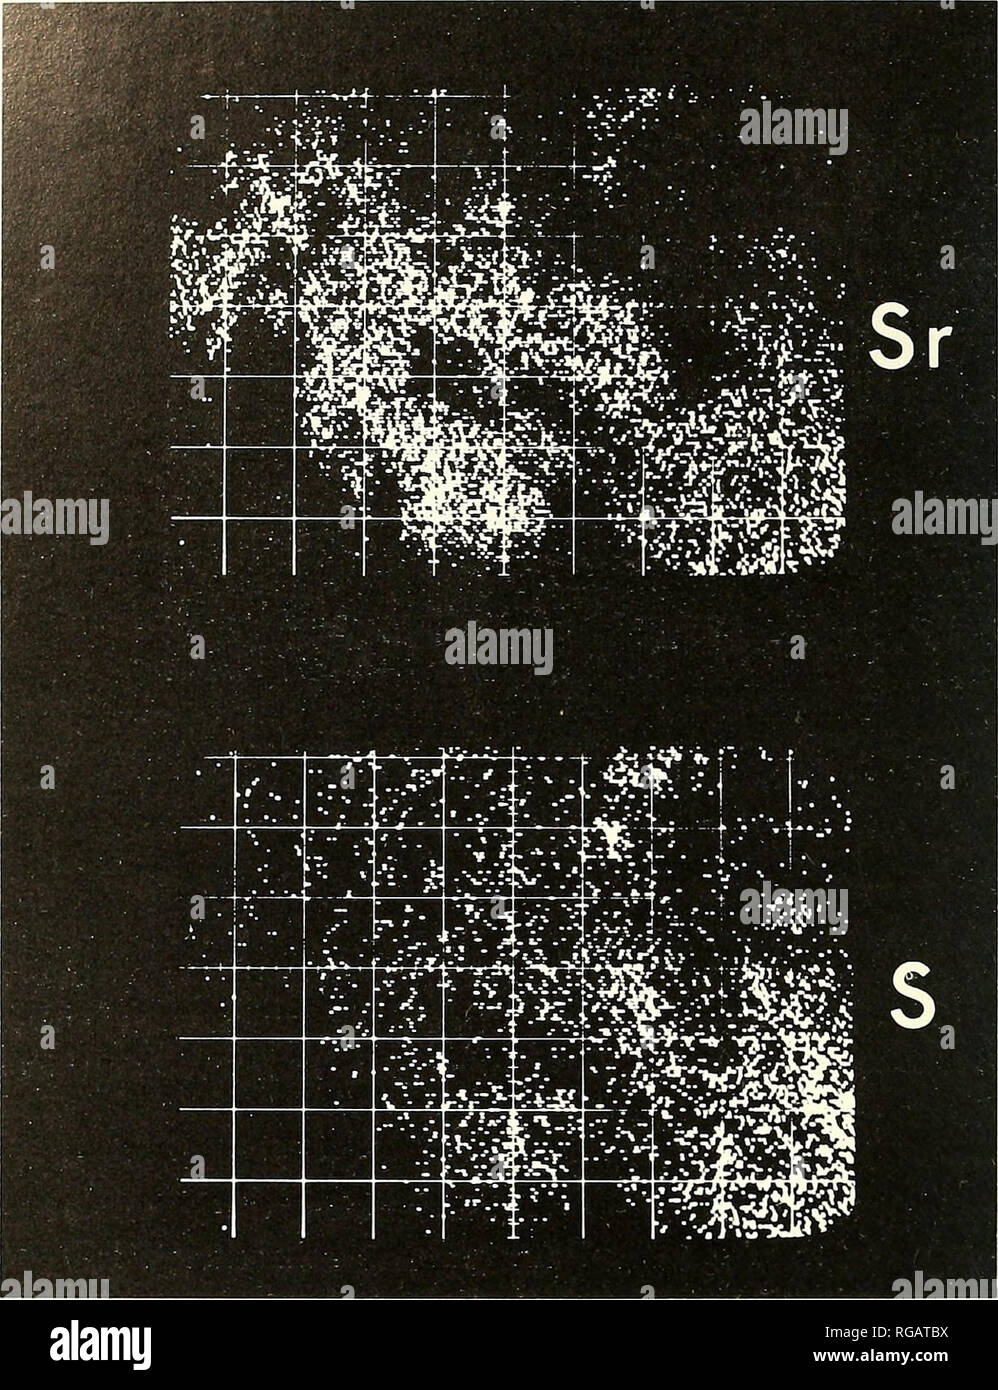 . Bulletin of the Southern California Academy of Sciences. Science; Natural history; Natural history. 234 Bulletin So. Calif. Academy Sciences / Vol. 6'y, No. 4, ic}66. Figure 4. X-ray electron probe scan of the distribution of strontium and sulfur in an insect (area 320 micron square). but occasionally they have had an arrangement indicating that min- eralization proceeded by the formation of a few large, parallel oriented crystals (Fig. 6). The size of the individual crystals can be estimated from the size of the spots they produce; they commonly range between 10"- and 10"^ cm. in Stock Photohttps://www.alamy.com/image-license-details/?v=1https://www.alamy.com/bulletin-of-the-southern-california-academy-of-sciences-science-natural-history-natural-history-234-bulletin-so-calif-academy-sciences-vol-6y-no-4-ic66-figure-4-x-ray-electron-probe-scan-of-the-distribution-of-strontium-and-sulfur-in-an-insect-area-320-micron-square-but-occasionally-they-have-had-an-arrangement-indicating-that-min-eralization-proceeded-by-the-formation-of-a-few-large-parallel-oriented-crystals-fig-6-the-size-of-the-individual-crystals-can-be-estimated-from-the-size-of-the-spots-they-produce-they-commonly-range-between-10quot-and-10quot-cm-in-image233807950.html
RMRGATBX–. Bulletin of the Southern California Academy of Sciences. Science; Natural history; Natural history. 234 Bulletin So. Calif. Academy Sciences / Vol. 6'y, No. 4, ic}66. Figure 4. X-ray electron probe scan of the distribution of strontium and sulfur in an insect (area 320 micron square). but occasionally they have had an arrangement indicating that min- eralization proceeded by the formation of a few large, parallel oriented crystals (Fig. 6). The size of the individual crystals can be estimated from the size of the spots they produce; they commonly range between 10"- and 10"^ cm. in
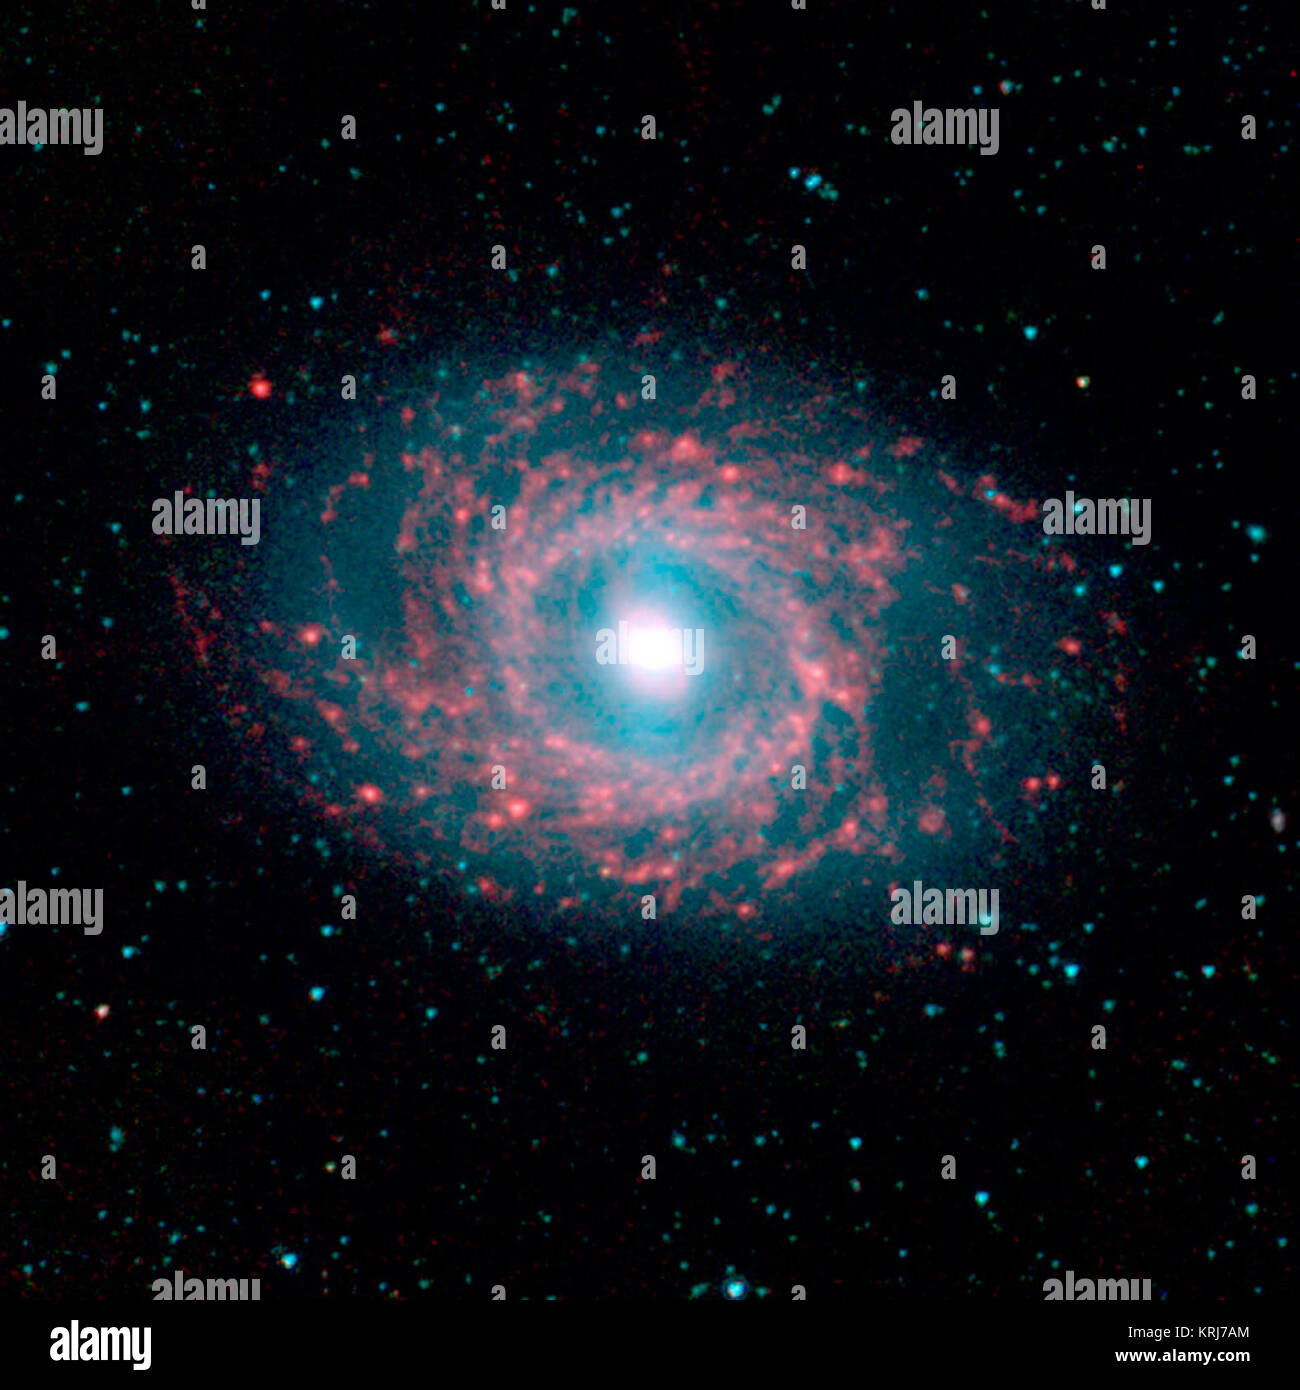 This image of galaxy NGC 3351, located approximately 30 million light-years away in the constellation Leo was captured by the Spitzer Infrared Nearby Galaxy Survey (SINGS) Legacy Project using the telescope's Infrared Array Camera (IRAC). The remarkable galaxy is graced with beautiful 'rings' of star formation as seen at the longer (red) wavelengths, pierced by a massive bar-like stellar structure (blue light) that extends from the nucleus to the ringed disk. The SINGS image is a four-channel false-color composite, where blue indicates emission at 3.6 microns, green corresponds to 4.5 micron Stock Photohttps://www.alamy.com/image-license-details/?v=1https://www.alamy.com/stock-image-this-image-of-galaxy-ngc-3351-located-approximately-30-million-light-169431324.html
RMKRJ7AM–This image of galaxy NGC 3351, located approximately 30 million light-years away in the constellation Leo was captured by the Spitzer Infrared Nearby Galaxy Survey (SINGS) Legacy Project using the telescope's Infrared Array Camera (IRAC). The remarkable galaxy is graced with beautiful 'rings' of star formation as seen at the longer (red) wavelengths, pierced by a massive bar-like stellar structure (blue light) that extends from the nucleus to the ringed disk. The SINGS image is a four-channel false-color composite, where blue indicates emission at 3.6 microns, green corresponds to 4.5 micron
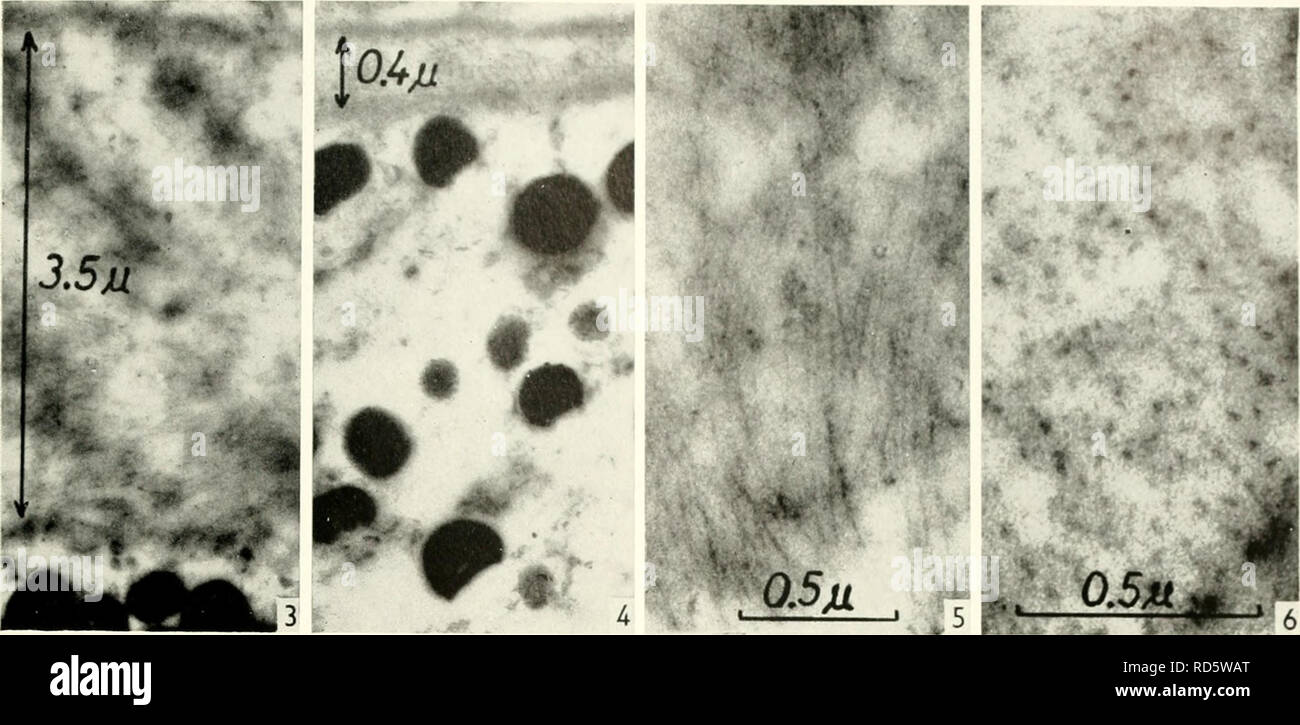 . Electron microscopy; proceedings of the Stockholm Conference, September, 1956. Electron microscopy. Mechanism of Pigment Migration within Teleost Melanophores 215. Fig. 3. Fibrillar zone of a contracted melanophore, the width being about 3.5 microns. Magnification 20,000. Fig. 4. Fibrillar zone of a dispersed melanophore, the width being about 0.4 micron. Magnification 17,000. Fig. 5. Longitudinally cut fibrils. Magnification x 33,000. Fig. 6. Transversely cut fibrils. Magnification < 55,000. membranes. The width of this fibrillar zone varies with the pigment dispersion. By fully disperse Stock Photohttps://www.alamy.com/image-license-details/?v=1https://www.alamy.com/electron-microscopy-proceedings-of-the-stockholm-conference-september-1956-electron-microscopy-mechanism-of-pigment-migration-within-teleost-melanophores-215-fig-3-fibrillar-zone-of-a-contracted-melanophore-the-width-being-about-35-microns-magnification-20000-fig-4-fibrillar-zone-of-a-dispersed-melanophore-the-width-being-about-04-micron-magnification-17000-fig-5-longitudinally-cut-fibrils-magnification-x-33000-fig-6-transversely-cut-fibrils-magnification-lt-55000-membranes-the-width-of-this-fibrillar-zone-varies-with-the-pigment-dispersion-by-fully-disperse-image231854976.html
RMRD5WAT–. Electron microscopy; proceedings of the Stockholm Conference, September, 1956. Electron microscopy. Mechanism of Pigment Migration within Teleost Melanophores 215. Fig. 3. Fibrillar zone of a contracted melanophore, the width being about 3.5 microns. Magnification 20,000. Fig. 4. Fibrillar zone of a dispersed melanophore, the width being about 0.4 micron. Magnification 17,000. Fig. 5. Longitudinally cut fibrils. Magnification x 33,000. Fig. 6. Transversely cut fibrils. Magnification < 55,000. membranes. The width of this fibrillar zone varies with the pigment dispersion. By fully disperse
 . Electron microscopy; proceedings of the Stockholm Conference, September, 1956. Electron microscopy. Fig. 3. Fibrillar zone of a contracted melanophore, the width being about 3.5 microns. Magnification 20,000. Fig. 4. Fibrillar zone of a dispersed melanophore, the width being about 0.4 micron. Magnification 17,000. Fig. 5. Longitudinally cut fibrils. Magnification x 33,000. Fig. 6. Transversely cut fibrils. Magnification < 55,000. membranes. The width of this fibrillar zone varies with the pigment dispersion. By fully dispersed melanophores the width is about 0.5 n and by fully concentrate Stock Photohttps://www.alamy.com/image-license-details/?v=1https://www.alamy.com/electron-microscopy-proceedings-of-the-stockholm-conference-september-1956-electron-microscopy-fig-3-fibrillar-zone-of-a-contracted-melanophore-the-width-being-about-35-microns-magnification-20000-fig-4-fibrillar-zone-of-a-dispersed-melanophore-the-width-being-about-04-micron-magnification-17000-fig-5-longitudinally-cut-fibrils-magnification-x-33000-fig-6-transversely-cut-fibrils-magnification-lt-55000-membranes-the-width-of-this-fibrillar-zone-varies-with-the-pigment-dispersion-by-fully-dispersed-melanophores-the-width-is-about-05-n-and-by-fully-concentrate-image231854975.html
RMRD5WAR–. Electron microscopy; proceedings of the Stockholm Conference, September, 1956. Electron microscopy. Fig. 3. Fibrillar zone of a contracted melanophore, the width being about 3.5 microns. Magnification 20,000. Fig. 4. Fibrillar zone of a dispersed melanophore, the width being about 0.4 micron. Magnification 17,000. Fig. 5. Longitudinally cut fibrils. Magnification x 33,000. Fig. 6. Transversely cut fibrils. Magnification < 55,000. membranes. The width of this fibrillar zone varies with the pigment dispersion. By fully dispersed melanophores the width is about 0.5 n and by fully concentrate
 . The Biological bulletin. Biology; Zoology; Biology; Marine Biology. * 3 FiGfKE 1. AspluiicJina embryos labelled in vitro with H3-thymidine for 1.5 hours; OsO4 fixation, 0.5-micron methacrylate section, autoradiograph exposed 21 days. In mitotic phase embryos (1-3). all nuclei are heavily labelled; in transition embryo (4), some nuclei are not labelled, while in post-mitotic embryos (5 and 6), only a few vitellarium nuclei are labelled. FIGURE 2. Vitellarium of mature female labelled /;; riro for 41 hours; glutaraldehyde and OsO* fixation, 2-micron methacrylate section, exposed 14 days. Immat Stock Photohttps://www.alamy.com/image-license-details/?v=1https://www.alamy.com/the-biological-bulletin-biology-zoology-biology-marine-biology-3-figfke-1-aspluiicjina-embryos-labelled-in-vitro-with-h3-thymidine-for-15-hours-oso4-fixation-05-micron-methacrylate-section-autoradiograph-exposed-21-days-in-mitotic-phase-embryos-1-3-all-nuclei-are-heavily-labelled-in-transition-embryo-4-some-nuclei-are-not-labelled-while-in-post-mitotic-embryos-5-and-6-only-a-few-vitellarium-nuclei-are-labelled-figure-2-vitellarium-of-mature-female-labelled-riro-for-41-hours-glutaraldehyde-and-oso-fixation-2-micron-methacrylate-section-exposed-14-days-immat-image234652691.html
RMRHN9W7–. The Biological bulletin. Biology; Zoology; Biology; Marine Biology. * 3 FiGfKE 1. AspluiicJina embryos labelled in vitro with H3-thymidine for 1.5 hours; OsO4 fixation, 0.5-micron methacrylate section, autoradiograph exposed 21 days. In mitotic phase embryos (1-3). all nuclei are heavily labelled; in transition embryo (4), some nuclei are not labelled, while in post-mitotic embryos (5 and 6), only a few vitellarium nuclei are labelled. FIGURE 2. Vitellarium of mature female labelled /;; riro for 41 hours; glutaraldehyde and OsO* fixation, 2-micron methacrylate section, exposed 14 days. Immat
 . Parasites and parasitosis of the domestic animals : the zoo?logy and control of the animal parasites and the pathogenesis and treatment of parasitic diseases . Domestic animals. Fig. 123.—Belascaris marginata: male; C, female, natural size. A, head, enlarged; B, Toxascaris limbata (Toxascaris marginata). Ascaridse (p. 229).— The body is firm and whitish or pale red in color. The cephalic wings are long, narrow, and somewhat lanceolate. The spicules of the male are not quite equal. Length of female, 6.5-10 cm. (2 1/2-4 inches); male, 4-6 cm. (1 1/2- 2 3/8 inches). The eggs are 75 to 85 micron Stock Photohttps://www.alamy.com/image-license-details/?v=1https://www.alamy.com/parasites-and-parasitosis-of-the-domestic-animals-the-zoology-and-control-of-the-animal-parasites-and-the-pathogenesis-and-treatment-of-parasitic-diseases-domestic-animals-fig-123belascaris-marginata-male-c-female-natural-size-a-head-enlarged-b-toxascaris-limbata-toxascaris-marginata-ascaridse-p-229-the-body-is-firm-and-whitish-or-pale-red-in-color-the-cephalic-wings-are-long-narrow-and-somewhat-lanceolate-the-spicules-of-the-male-are-not-quite-equal-length-of-female-65-10-cm-2-12-4-inches-male-4-6-cm-1-12-2-38-inches-the-eggs-are-75-to-85-micron-image232353584.html
RMRE0HA8–. Parasites and parasitosis of the domestic animals : the zoo?logy and control of the animal parasites and the pathogenesis and treatment of parasitic diseases . Domestic animals. Fig. 123.—Belascaris marginata: male; C, female, natural size. A, head, enlarged; B, Toxascaris limbata (Toxascaris marginata). Ascaridse (p. 229).— The body is firm and whitish or pale red in color. The cephalic wings are long, narrow, and somewhat lanceolate. The spicules of the male are not quite equal. Length of female, 6.5-10 cm. (2 1/2-4 inches); male, 4-6 cm. (1 1/2- 2 3/8 inches). The eggs are 75 to 85 micron
 . The Biological bulletin. Biology; Zoology; Biology; Marine Biology. FIGURE 5. Cross section of intestine similar to that shown in Figure 4. At least 40 xenomas (arrows) 20 to 50 /j.m in diameter develop within the suhmncosa and protrude from the mucosa. Infected host cells hypertrophy and contain early schizont stages of the parasite, e, epithelium. One micron Epon section; % toluidine blue stain; bar represents 50 /j.m. FIGURE 6. Cross section of intestine from lightly infected smelt 2 weeks after feeding on a spore suspension. Progressive hypertrophy increased the xenomas to 100 to 125 ^u Stock Photohttps://www.alamy.com/image-license-details/?v=1https://www.alamy.com/the-biological-bulletin-biology-zoology-biology-marine-biology-figure-5-cross-section-of-intestine-similar-to-that-shown-in-figure-4-at-least-40-xenomas-arrows-20-to-50-jm-in-diameter-develop-within-the-suhmncosa-and-protrude-from-the-mucosa-infected-host-cells-hypertrophy-and-contain-early-schizont-stages-of-the-parasite-e-epithelium-one-micron-epon-section-toluidine-blue-stain-bar-represents-50-jm-figure-6-cross-section-of-intestine-from-lightly-infected-smelt-2-weeks-after-feeding-on-a-spore-suspension-progressive-hypertrophy-increased-the-xenomas-to-100-to-125-u-image234619700.html
RMRHKRR0–. The Biological bulletin. Biology; Zoology; Biology; Marine Biology. FIGURE 5. Cross section of intestine similar to that shown in Figure 4. At least 40 xenomas (arrows) 20 to 50 /j.m in diameter develop within the suhmncosa and protrude from the mucosa. Infected host cells hypertrophy and contain early schizont stages of the parasite, e, epithelium. One micron Epon section; % toluidine blue stain; bar represents 50 /j.m. FIGURE 6. Cross section of intestine from lightly infected smelt 2 weeks after feeding on a spore suspension. Progressive hypertrophy increased the xenomas to 100 to 125 ^u
 . The Biological bulletin. Biology; Zoology; Marine biology. GLUGEA HERTWIGI IN OSMERUS MORI)AX 339. Figure 5. Cross section of intestine similar to that shown in Figure 4. At least 40 xenomas (arrows) 20 to 50 nm in diameter develop within the submucosa and protrude from the mucosa. Infected host cells hypertrophy and contain early schizont stages of the parasite, e, epithelium. One micron Epon section; 1% toluidine blue stain; bar represents 50 fj.m. Figure 6. Cross section of intestine from lightly infected smelt 2 weeks after feeding on a spore suspension. Progressive hypertrophy increased Stock Photohttps://www.alamy.com/image-license-details/?v=1https://www.alamy.com/the-biological-bulletin-biology-zoology-marine-biology-glugea-hertwigi-in-osmerus-moriax-339-figure-5-cross-section-of-intestine-similar-to-that-shown-in-figure-4-at-least-40-xenomas-arrows-20-to-50-nm-in-diameter-develop-within-the-submucosa-and-protrude-from-the-mucosa-infected-host-cells-hypertrophy-and-contain-early-schizont-stages-of-the-parasite-e-epithelium-one-micron-epon-section-1-toluidine-blue-stain-bar-represents-50-fjm-figure-6-cross-section-of-intestine-from-lightly-infected-smelt-2-weeks-after-feeding-on-a-spore-suspension-progressive-hypertrophy-increased-image234625786.html
RMRHM3GA–. The Biological bulletin. Biology; Zoology; Marine biology. GLUGEA HERTWIGI IN OSMERUS MORI)AX 339. Figure 5. Cross section of intestine similar to that shown in Figure 4. At least 40 xenomas (arrows) 20 to 50 nm in diameter develop within the submucosa and protrude from the mucosa. Infected host cells hypertrophy and contain early schizont stages of the parasite, e, epithelium. One micron Epon section; 1% toluidine blue stain; bar represents 50 fj.m. Figure 6. Cross section of intestine from lightly infected smelt 2 weeks after feeding on a spore suspension. Progressive hypertrophy increased
 . Annals of the South African Museum = Annale van die Suid-Afrikaanse Museum. Natural history. MICRON!ANIMALS AS PALAEOENVIRONMENTAL INDICATORS. 0 J ^ ( 4 5 6 x 10 000 yrs BP Fig. 32. First alternative correlation of the Boom- plaas A and Die Kelders 1 M.S.A. sequences. BPA levels OLP to BOL1-3 and the DK1 M.S.A. sequence correlated using individual species. (Solid line = Boomplaas A; dashed line = Die Kelders 1.). Please note that these images are extracted from scanned page images that may have been digitally enhanced for readability - coloration and appearance of these illustrations may not Stock Photohttps://www.alamy.com/image-license-details/?v=1https://www.alamy.com/annals-of-the-south-african-museum-=-annale-van-die-suid-afrikaanse-museum-natural-history-micron!animals-as-palaeoenvironmental-indicators-0-j-4-5-6-x-10-000-yrs-bp-fig-32-first-alternative-correlation-of-the-boom-plaas-a-and-die-kelders-1-msa-sequences-bpa-levels-olp-to-bol1-3-and-the-dk1-msa-sequence-correlated-using-individual-species-solid-line-=-boomplaas-a-dashed-line-=-die-kelders-1-please-note-that-these-images-are-extracted-from-scanned-page-images-that-may-have-been-digitally-enhanced-for-readability-coloration-and-appearance-of-these-illustrations-may-not-image236440099.html
RMRMJNN7–. Annals of the South African Museum = Annale van die Suid-Afrikaanse Museum. Natural history. MICRON!ANIMALS AS PALAEOENVIRONMENTAL INDICATORS. 0 J ^ ( 4 5 6 x 10 000 yrs BP Fig. 32. First alternative correlation of the Boom- plaas A and Die Kelders 1 M.S.A. sequences. BPA levels OLP to BOL1-3 and the DK1 M.S.A. sequence correlated using individual species. (Solid line = Boomplaas A; dashed line = Die Kelders 1.). Please note that these images are extracted from scanned page images that may have been digitally enhanced for readability - coloration and appearance of these illustrations may not