Absolute temperature scale Stock Photos and Images
(83)See absolute temperature scale stock video clipsQuick filters:
Absolute temperature scale Stock Photos and Images
 Ireland, North, Belfast, Botanic Gardens, Statue of Lord Kelvin creator of the absolute temperature scale. Stock Photohttps://www.alamy.com/image-license-details/?v=1https://www.alamy.com/stock-photo-ireland-north-belfast-botanic-gardens-statue-of-lord-kelvin-creator-31299015.html
RMBPWP5Y–Ireland, North, Belfast, Botanic Gardens, Statue of Lord Kelvin creator of the absolute temperature scale.
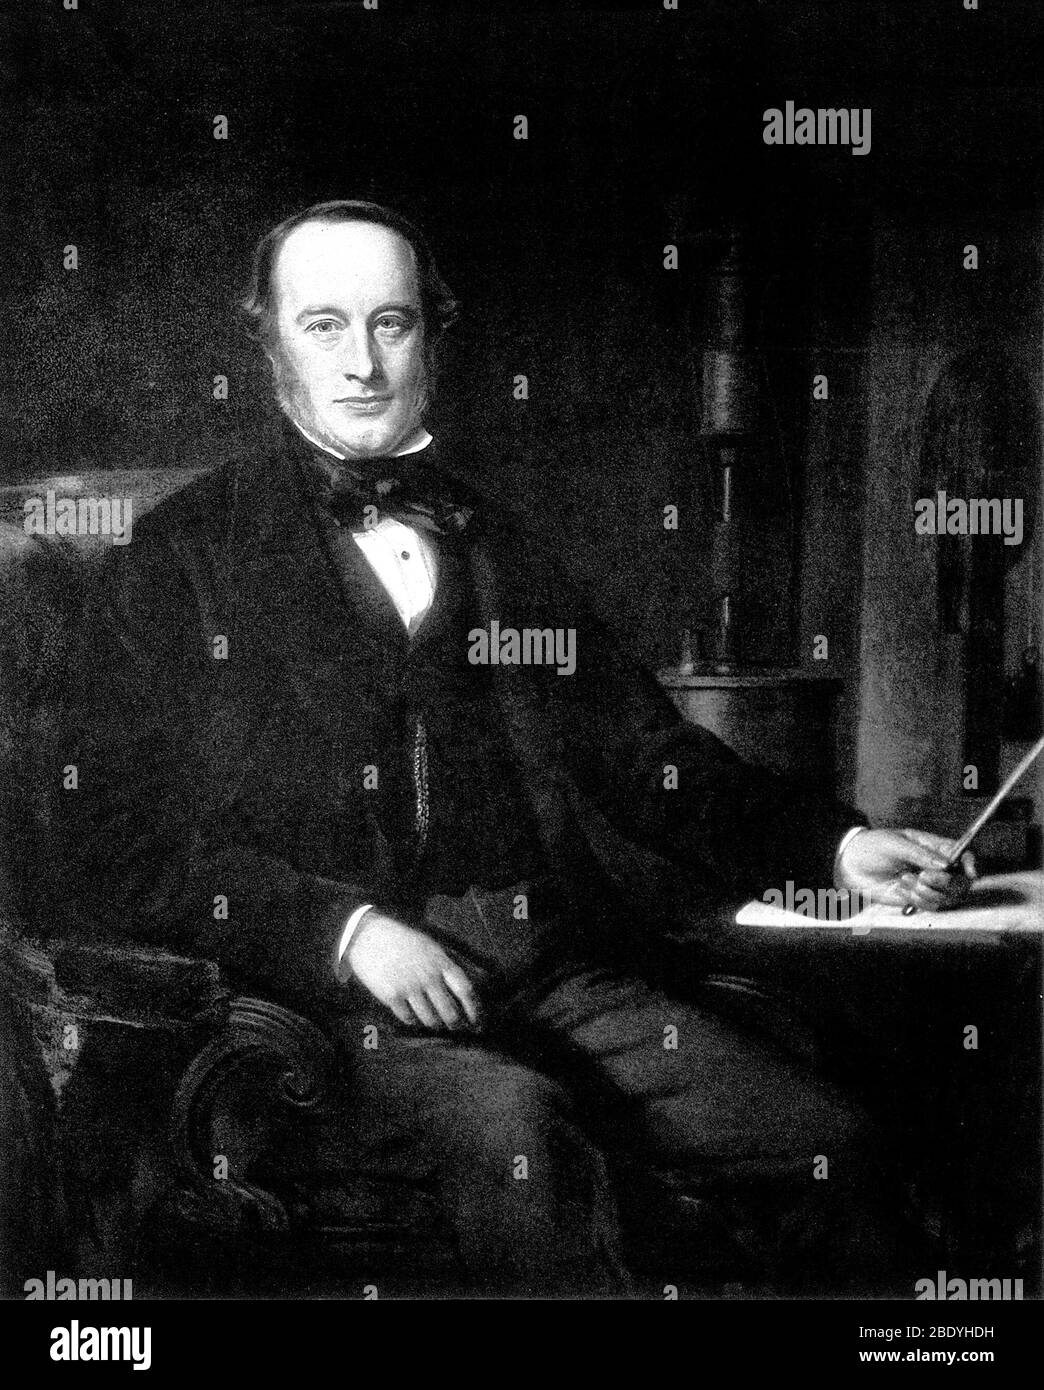 James Prescott Joule, English Physicist Stock Photohttps://www.alamy.com/image-license-details/?v=1https://www.alamy.com/james-prescott-joule-english-physicist-image352804301.html
RM2BDYHDH–James Prescott Joule, English Physicist
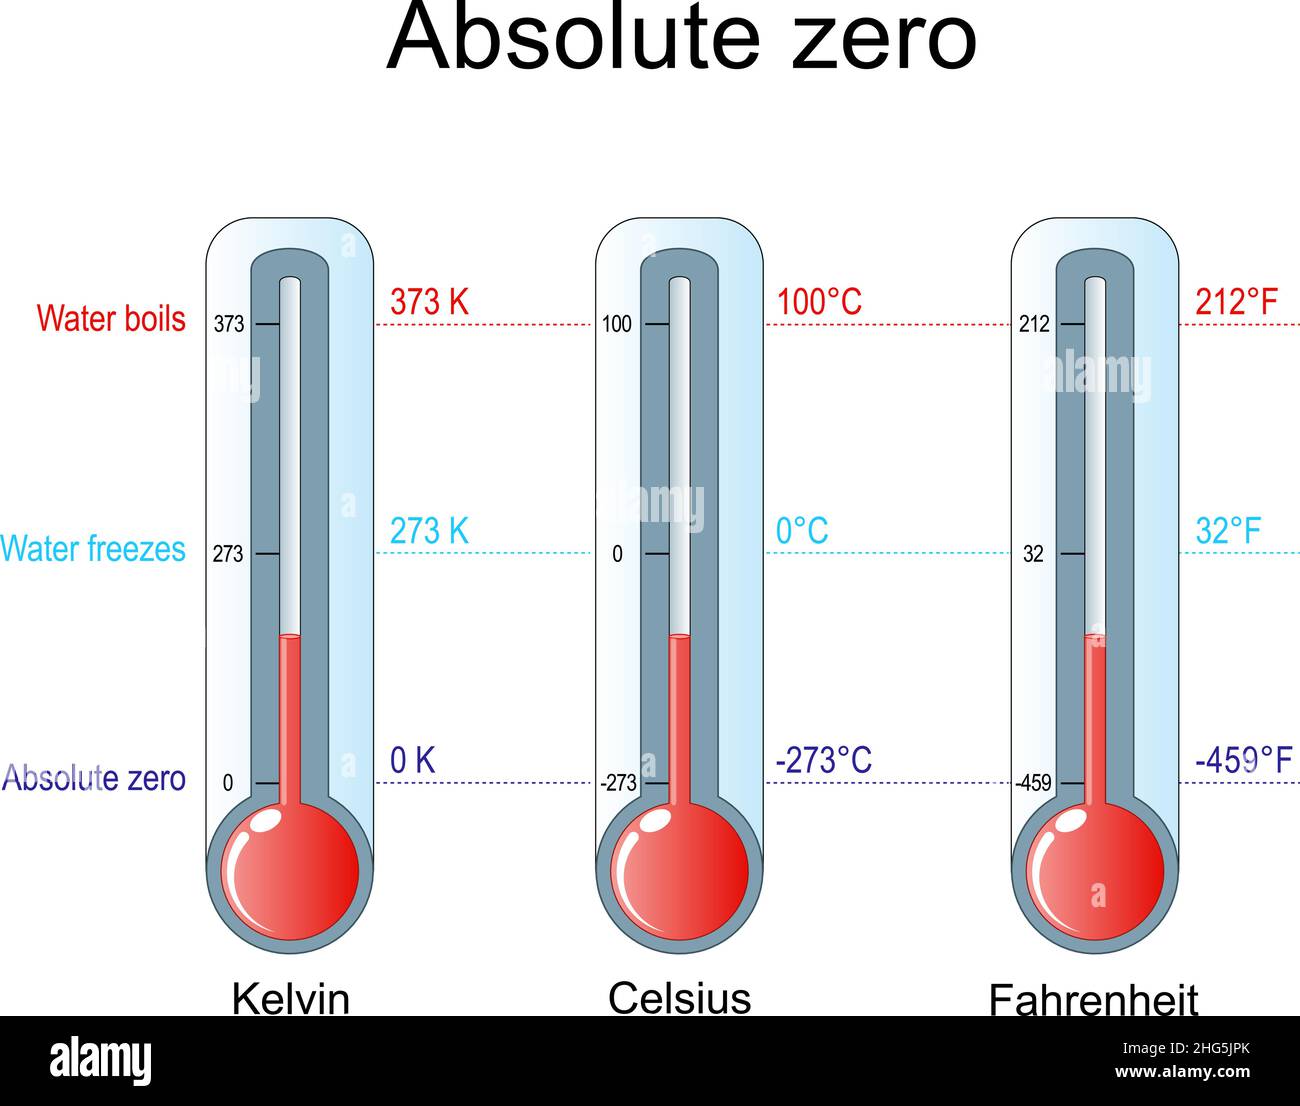 Absolute zero, Water freezes and Water boils. Three thermometers with scale of Celsius, Kelvin, Fahrenheit. Vector illustration Stock Vectorhttps://www.alamy.com/image-license-details/?v=1https://www.alamy.com/absolute-zero-water-freezes-and-water-boils-three-thermometers-with-scale-of-celsius-kelvin-fahrenheit-vector-illustration-image457428571.html
RF2HG5JPK–Absolute zero, Water freezes and Water boils. Three thermometers with scale of Celsius, Kelvin, Fahrenheit. Vector illustration
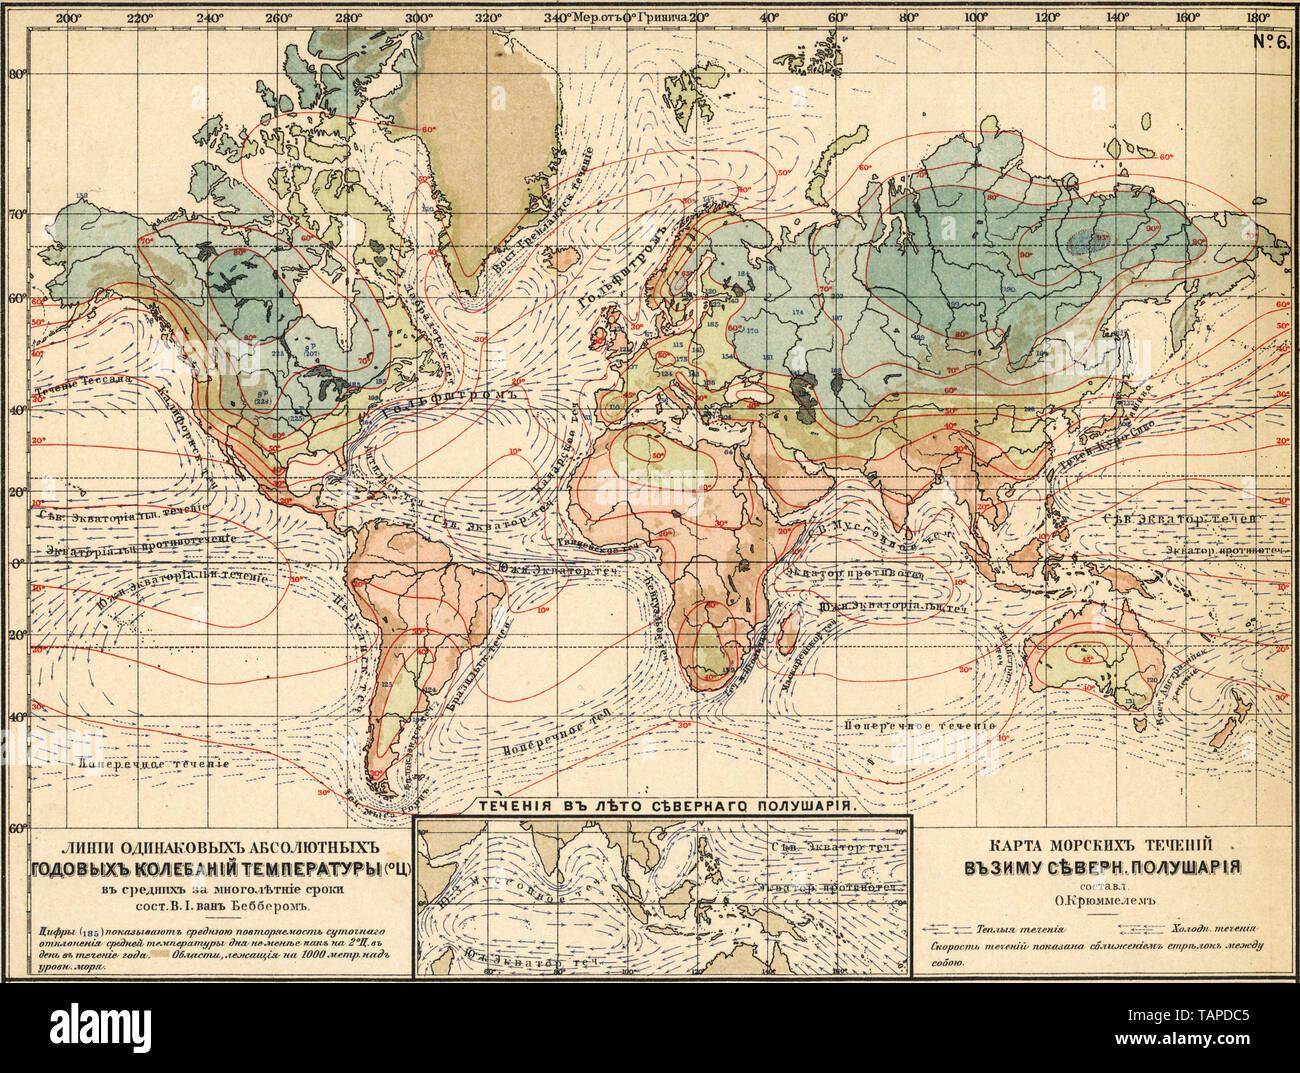 Lines of the same absolute annual temperature fluctuations. Map of the sea currents in the winter of the Northern Hemisphere. Sea currents in the summer of the Northern Hemisphere. 1910 Stock Photohttps://www.alamy.com/image-license-details/?v=1https://www.alamy.com/lines-of-the-same-absolute-annual-temperature-fluctuations-map-of-the-sea-currents-in-the-winter-of-the-northern-hemisphere-sea-currents-in-the-summer-of-the-northern-hemisphere-1910-image247585189.html
RMTAPDC5–Lines of the same absolute annual temperature fluctuations. Map of the sea currents in the winter of the Northern Hemisphere. Sea currents in the summer of the Northern Hemisphere. 1910
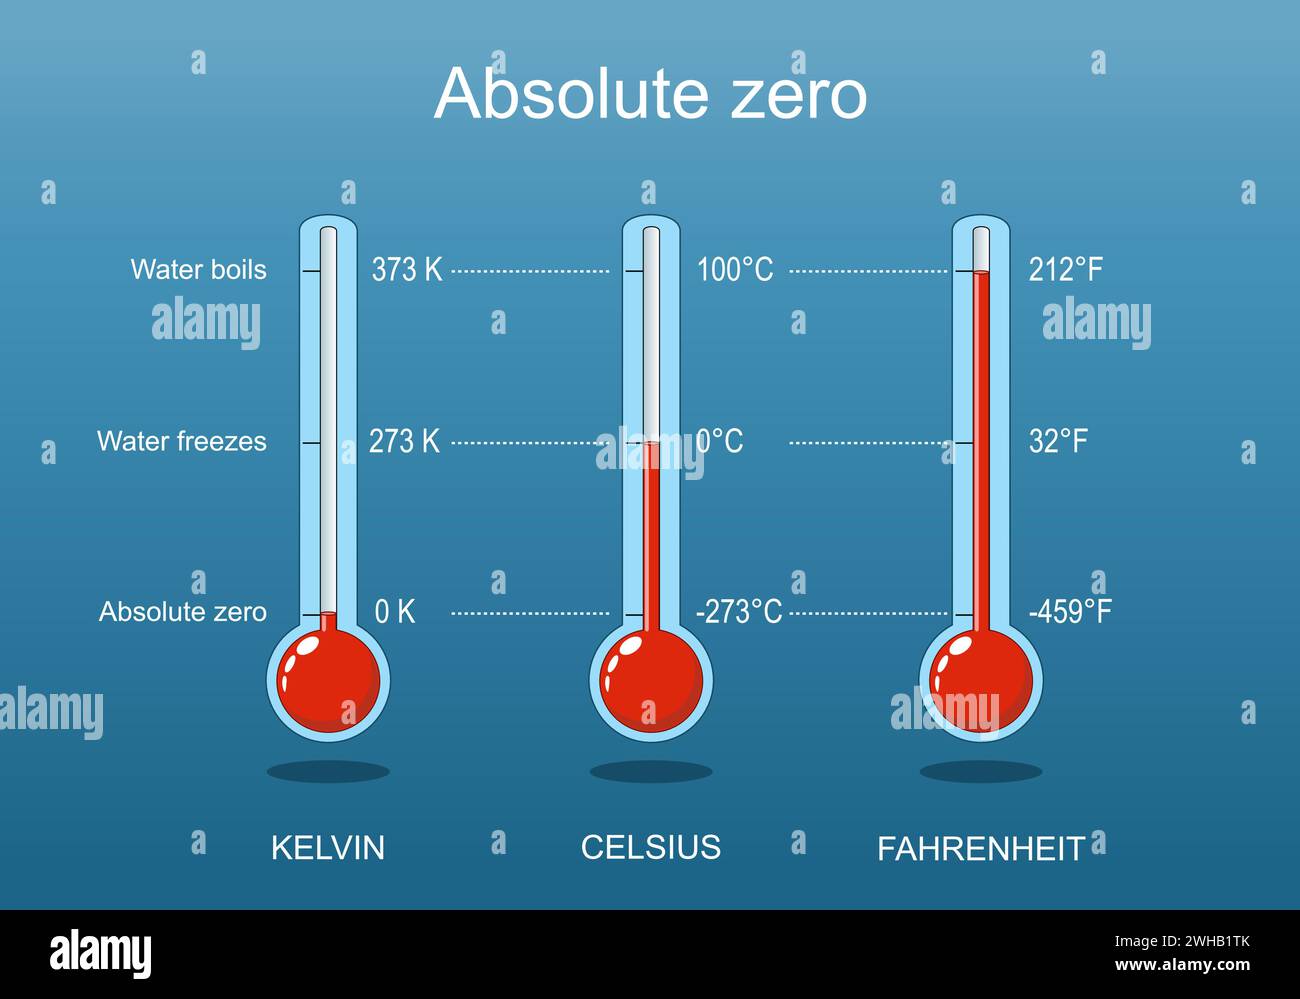 Absolute zero, Water freezes and Water boils. Three thermometers with scale of Celsius, Kelvin, Fahrenheit. Isometric Vector. Flat illustration Stock Vectorhttps://www.alamy.com/image-license-details/?v=1https://www.alamy.com/absolute-zero-water-freezes-and-water-boils-three-thermometers-with-scale-of-celsius-kelvin-fahrenheit-isometric-vector-flat-illustration-image595844611.html
RF2WHB1TK–Absolute zero, Water freezes and Water boils. Three thermometers with scale of Celsius, Kelvin, Fahrenheit. Isometric Vector. Flat illustration
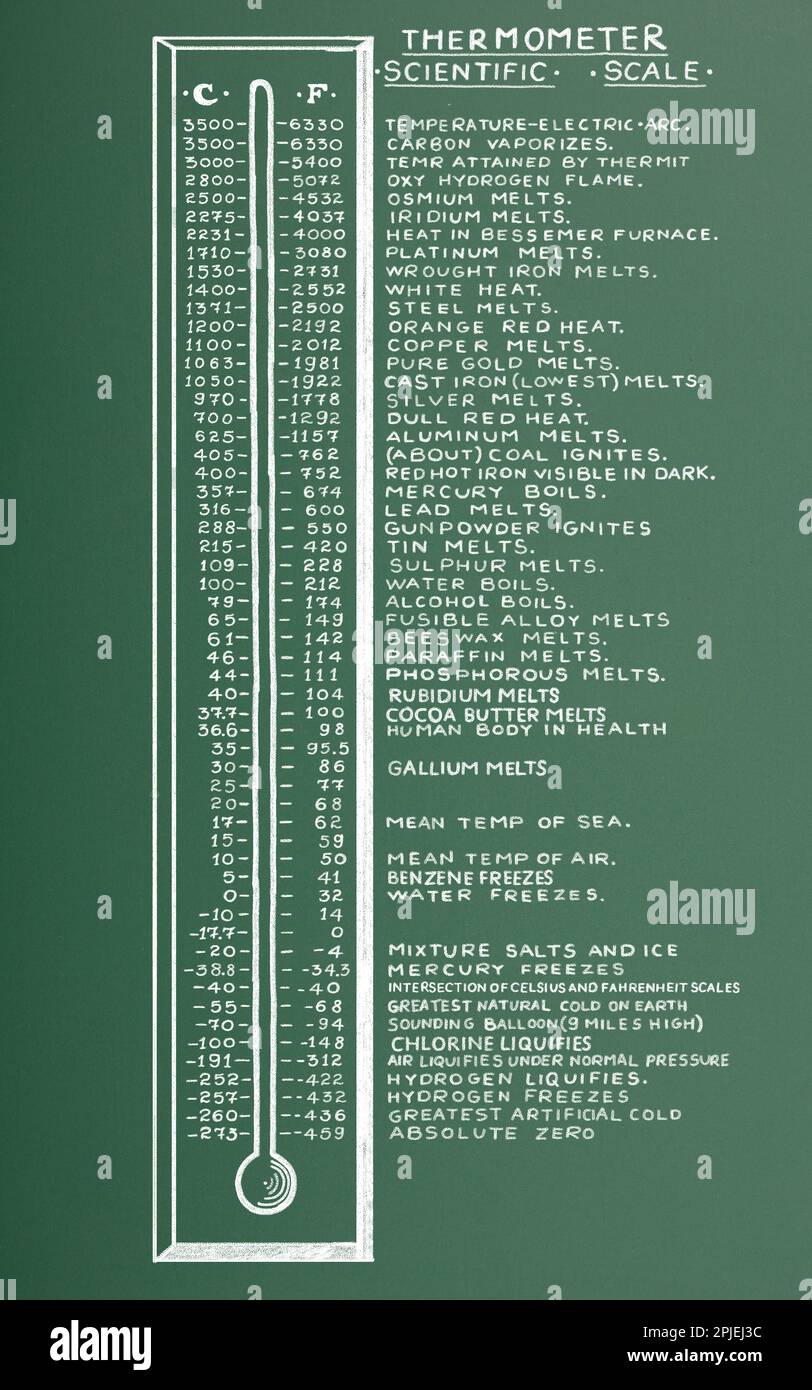 Scientific Bar Thermometer with Celsius and Fahrenheit temperature scales. Table of boiling and freezing temperature of chemical elements and products Stock Photohttps://www.alamy.com/image-license-details/?v=1https://www.alamy.com/scientific-bar-thermometer-with-celsius-and-fahrenheit-temperature-scales-table-of-boiling-and-freezing-temperature-of-chemical-elements-and-products-image544906752.html
RF2PJEJ3C–Scientific Bar Thermometer with Celsius and Fahrenheit temperature scales. Table of boiling and freezing temperature of chemical elements and products
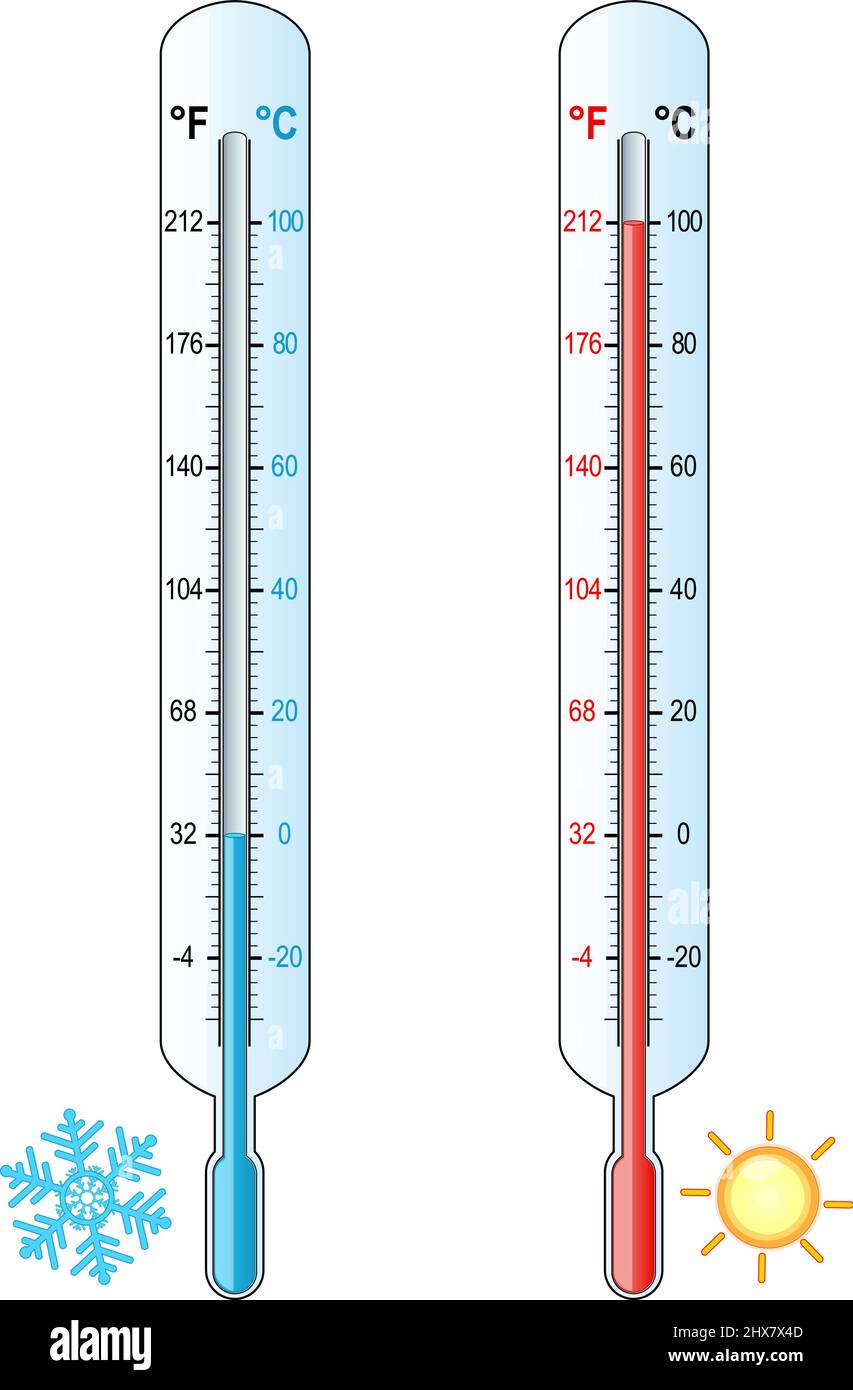 thermometers with scale of Celsius, Kelvin, Fahrenheit. Vector illustration comparison and difference. Absolute zero, Water freezes and Water boils. Stock Vectorhttps://www.alamy.com/image-license-details/?v=1https://www.alamy.com/thermometers-with-scale-of-celsius-kelvin-fahrenheit-vector-illustration-comparison-and-difference-absolute-zero-water-freezes-and-water-boils-image463624797.html
RF2HX7X4D–thermometers with scale of Celsius, Kelvin, Fahrenheit. Vector illustration comparison and difference. Absolute zero, Water freezes and Water boils.
 A fahrenheit scale Stock Vectorhttps://www.alamy.com/image-license-details/?v=1https://www.alamy.com/a-fahrenheit-scale-image444557913.html
RF2GR7A49–A fahrenheit scale
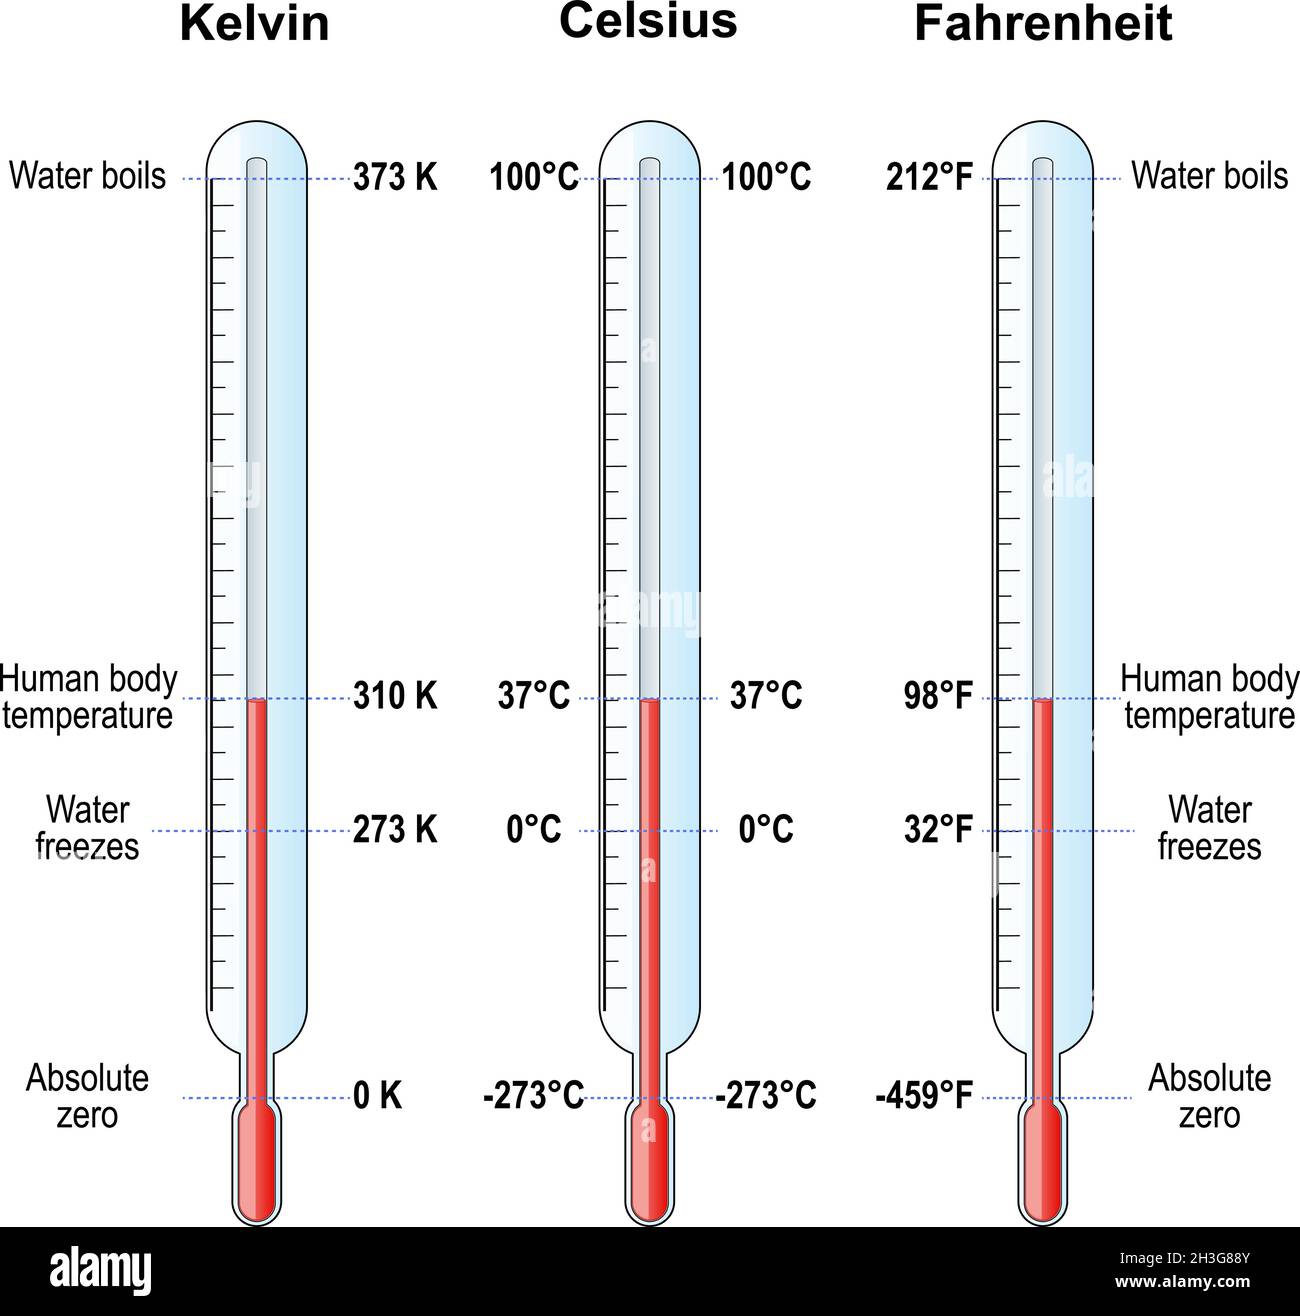 temperature scales. Celsius, Fahrenheit and Kelvin thermometers. comparison and difference. vector illustration Stock Vectorhttps://www.alamy.com/image-license-details/?v=1https://www.alamy.com/temperature-scales-celsius-fahrenheit-and-kelvin-thermometers-comparison-and-difference-vector-illustration-image449671291.html
RF2H3G88Y–temperature scales. Celsius, Fahrenheit and Kelvin thermometers. comparison and difference. vector illustration
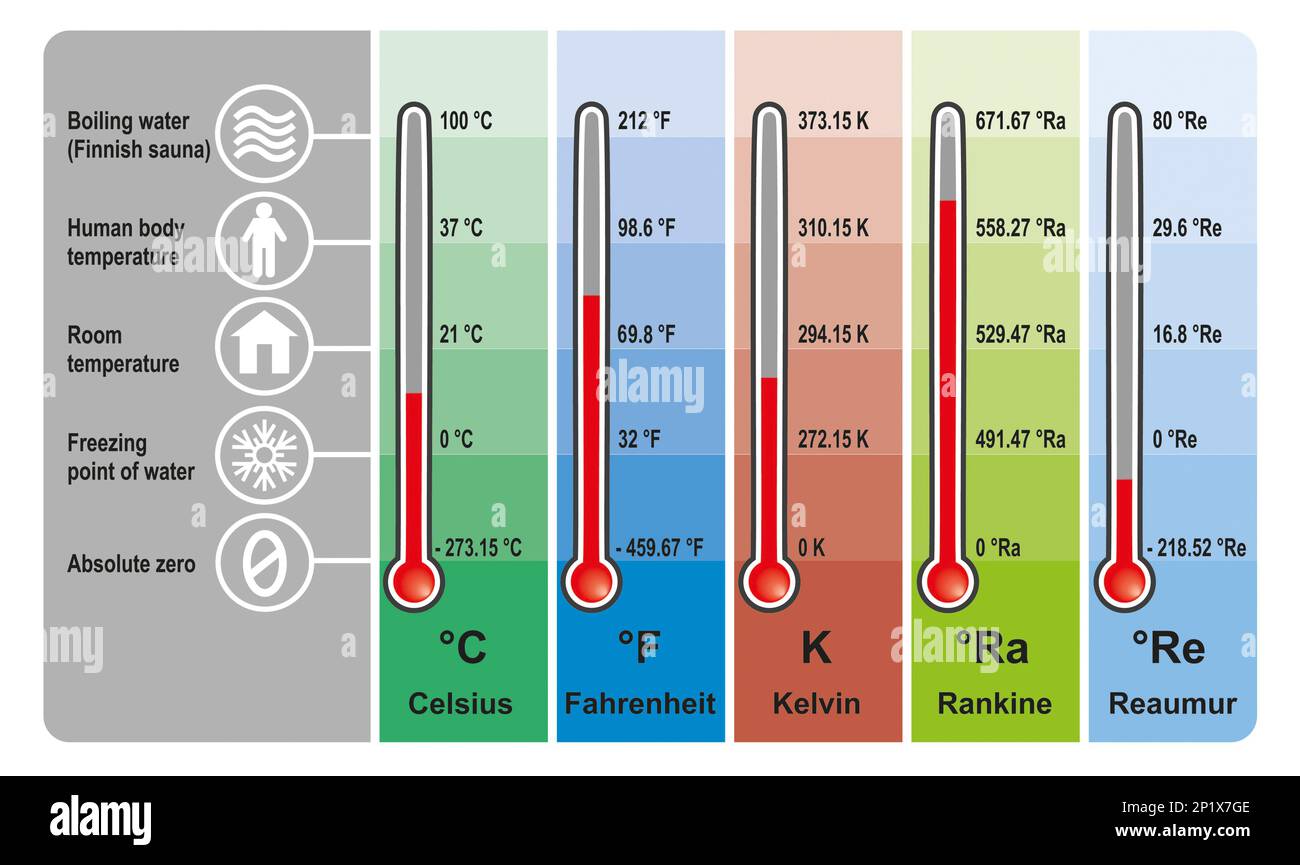 Temperature unit conversions, illustration Stock Photohttps://www.alamy.com/image-license-details/?v=1https://www.alamy.com/temperature-unit-conversions-illustration-image534712766.html
RF2P1X7GE–Temperature unit conversions, illustration
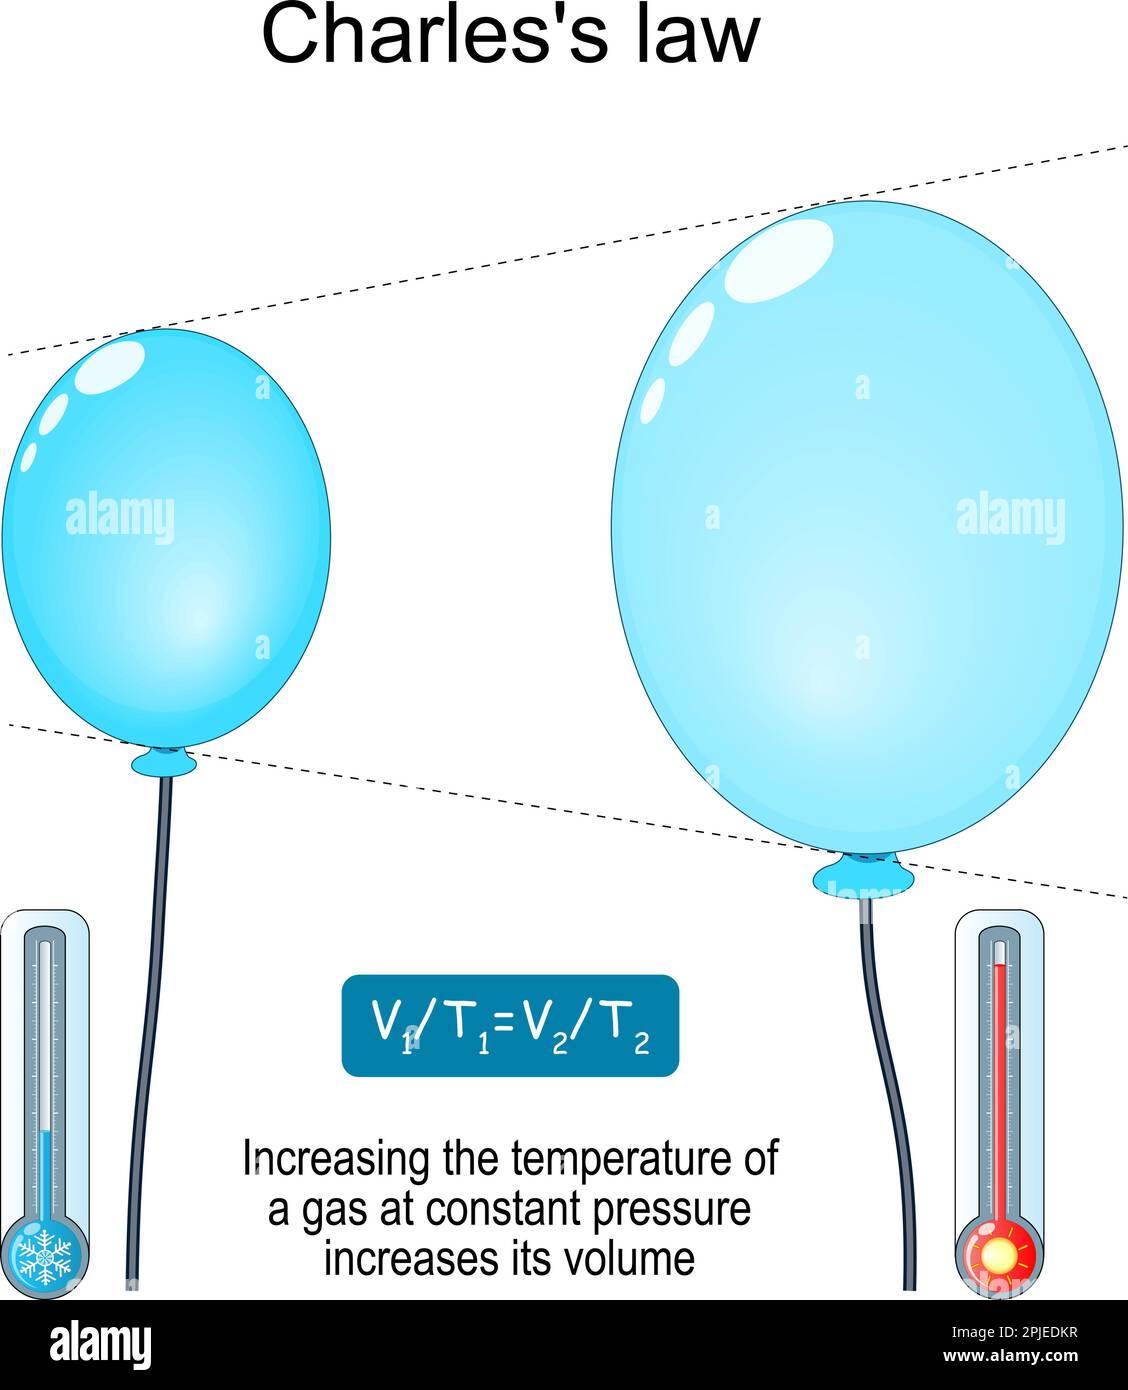 Charles's law. relationship between volume and temperature. Increasing the temperature of a gas at constant pressure increases its volume. Explanation Stock Vectorhttps://www.alamy.com/image-license-details/?v=1https://www.alamy.com/charless-law-relationship-between-volume-and-temperature-increasing-the-temperature-of-a-gas-at-constant-pressure-increases-its-volume-explanation-image544903291.html
RF2PJEDKR–Charles's law. relationship between volume and temperature. Increasing the temperature of a gas at constant pressure increases its volume. Explanation
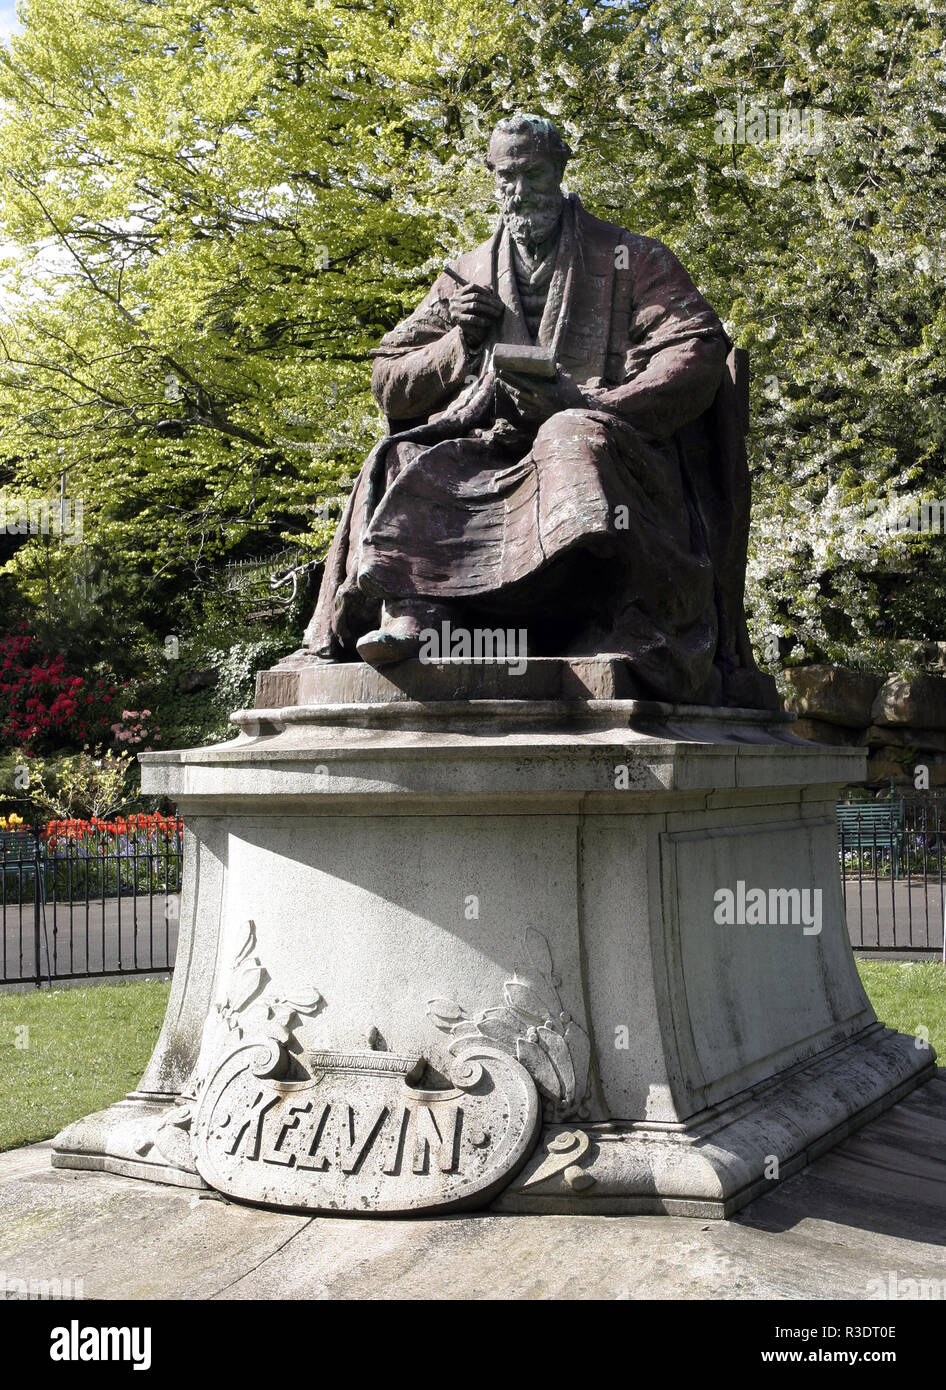 This statue of Lord Kelvin, (William Thomson), who was a mathematical physicist and engineer and is best known for devising the absolute temperature scale. The statue sits in Kelvingrove park beside the River Kelvin in Glasgow. Stock Photohttps://www.alamy.com/image-license-details/?v=1https://www.alamy.com/this-statue-of-lord-kelvin-william-thomson-who-was-a-mathematical-physicist-and-engineer-and-is-best-known-for-devising-the-absolute-temperature-scale-the-statue-sits-in-kelvingrove-park-beside-the-river-kelvin-in-glasgow-image225882958.html
RMR3DT0E–This statue of Lord Kelvin, (William Thomson), who was a mathematical physicist and engineer and is best known for devising the absolute temperature scale. The statue sits in Kelvingrove park beside the River Kelvin in Glasgow.
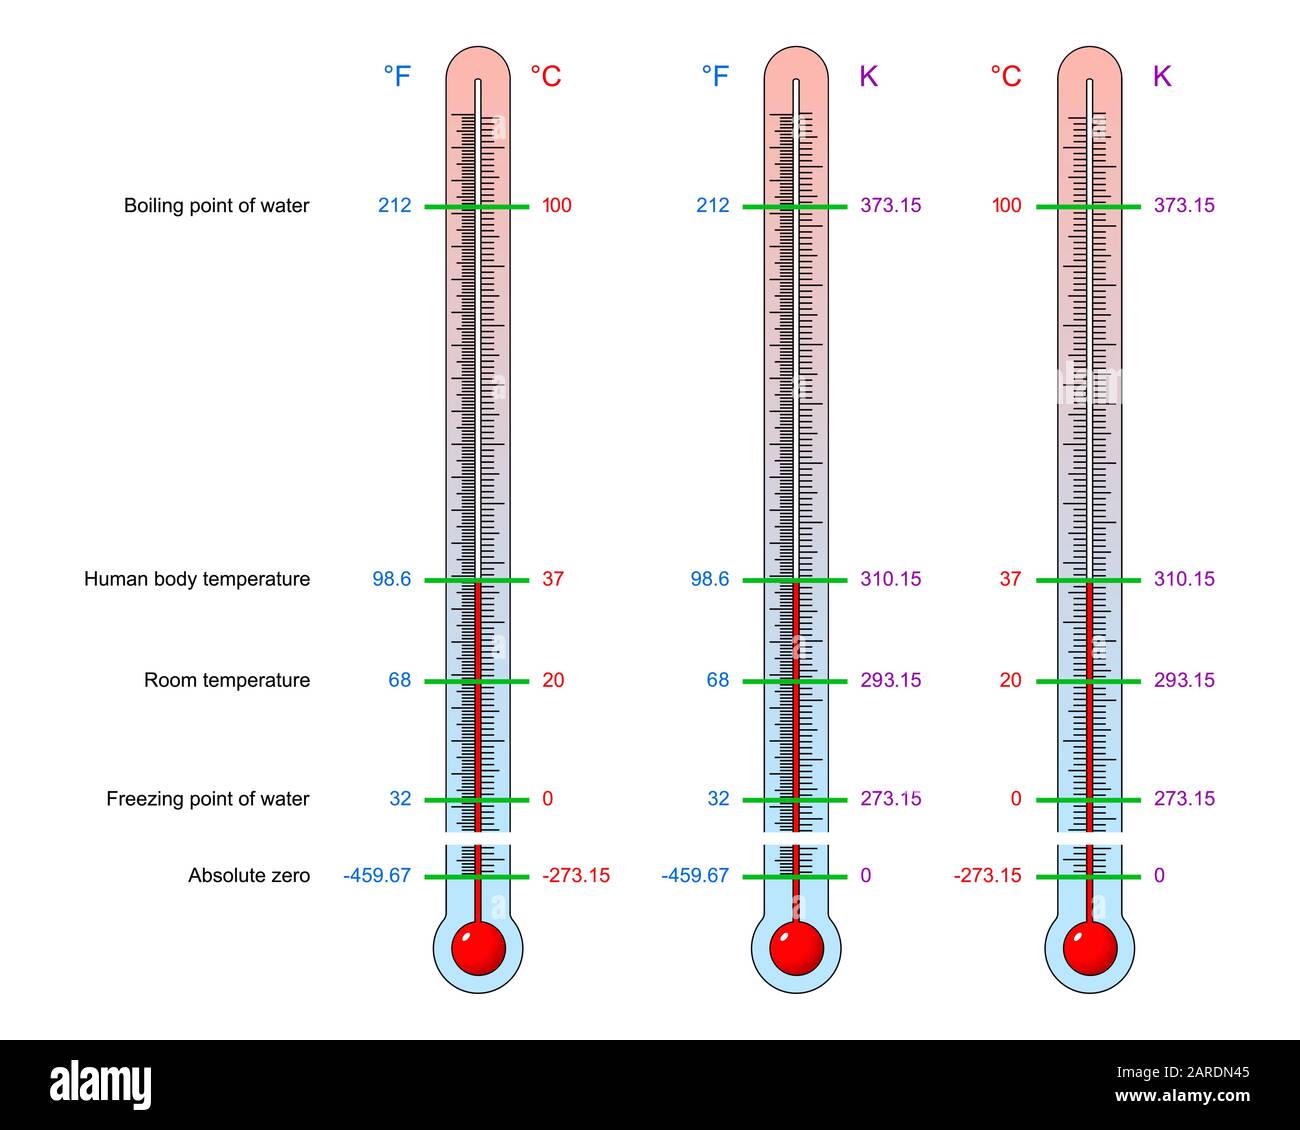 Thermometers with basic values of temperature with the scale division in units of Fahrenheit, Celsius, Kelvin. Vector illustration Stock Vectorhttps://www.alamy.com/image-license-details/?v=1https://www.alamy.com/thermometers-with-basic-values-of-temperature-with-the-scale-division-in-units-of-fahrenheit-celsius-kelvin-vector-illustration-image341436037.html
RF2ARDN45–Thermometers with basic values of temperature with the scale division in units of Fahrenheit, Celsius, Kelvin. Vector illustration
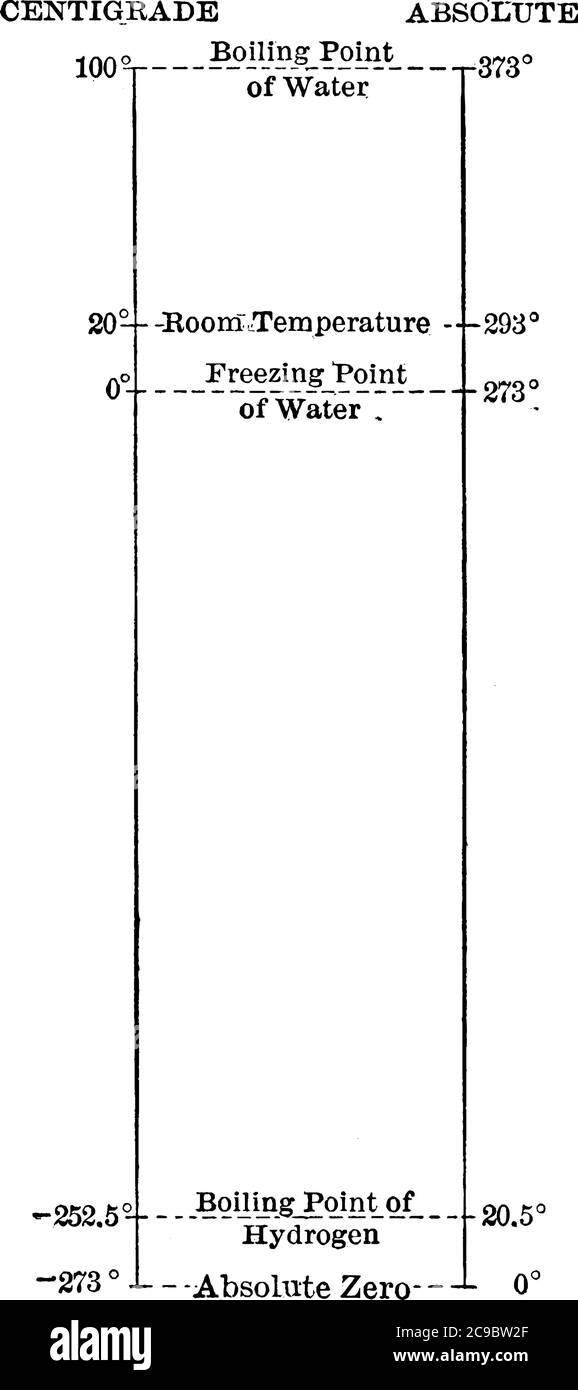 Temperature Scales showing the differences between the Centigrade and absolute (Kelvin) temperature scales at the boiling point of water, room tempera Stock Vectorhttps://www.alamy.com/image-license-details/?v=1https://www.alamy.com/temperature-scales-showing-the-differences-between-the-centigrade-and-absolute-kelvin-temperature-scales-at-the-boiling-point-of-water-room-tempera-image367210775.html
RF2C9BW2F–Temperature Scales showing the differences between the Centigrade and absolute (Kelvin) temperature scales at the boiling point of water, room tempera
RF2HP9GMY–Humidity Icon
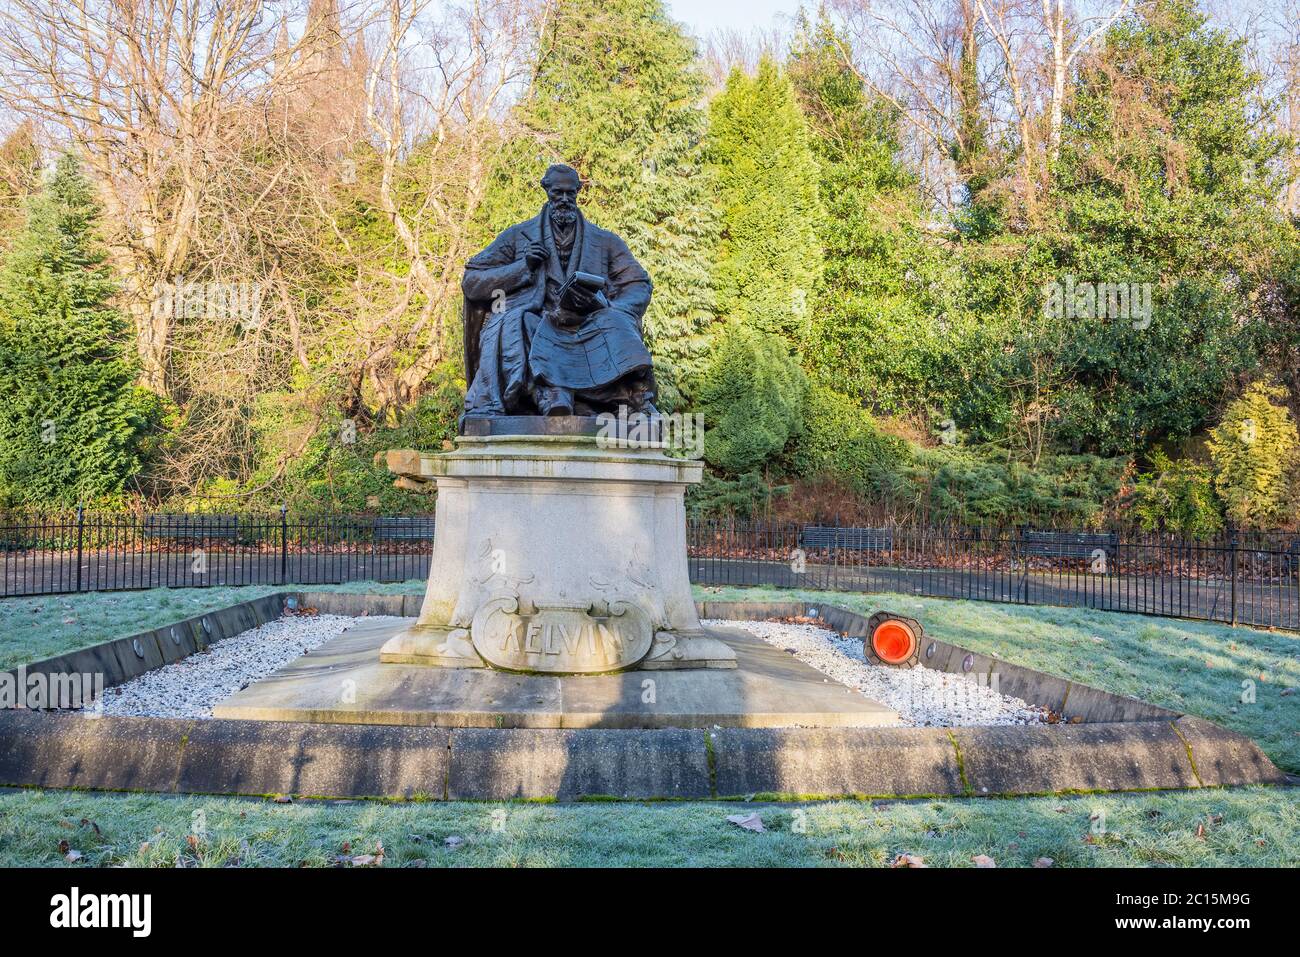 Statue of Lord Kelvin in garden in Kelvingrove Park, Glasgow Stock Photohttps://www.alamy.com/image-license-details/?v=1https://www.alamy.com/statue-of-lord-kelvin-in-garden-in-kelvingrove-park-glasgow-image362158092.html
RF2C15M9G–Statue of Lord Kelvin in garden in Kelvingrove Park, Glasgow
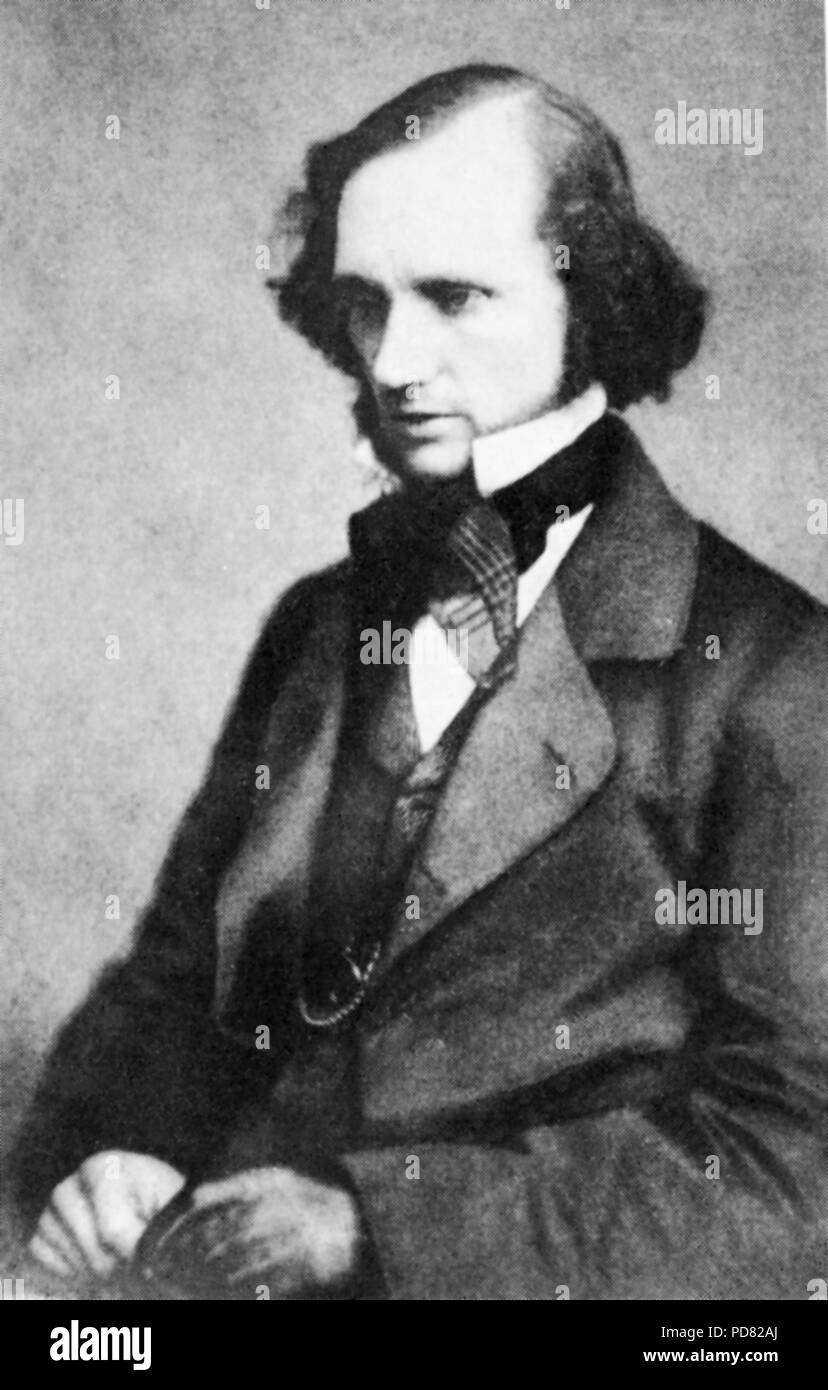 William Thomson, Lord Kelvin, mathematical physicist and engineer, whose input was crucial in the development of the electric telegraph and who defined the absolute thermodynamic temperature Kelvin Scale using as its null point absolute zero Stock Photohttps://www.alamy.com/image-license-details/?v=1https://www.alamy.com/william-thomson-lord-kelvin-mathematical-physicist-and-engineer-whose-input-was-crucial-in-the-development-of-the-electric-telegraph-and-who-defined-the-absolute-thermodynamic-temperature-kelvin-scale-using-as-its-null-point-absolute-zero-image214692426.html
RMPD82AJ–William Thomson, Lord Kelvin, mathematical physicist and engineer, whose input was crucial in the development of the electric telegraph and who defined the absolute thermodynamic temperature Kelvin Scale using as its null point absolute zero
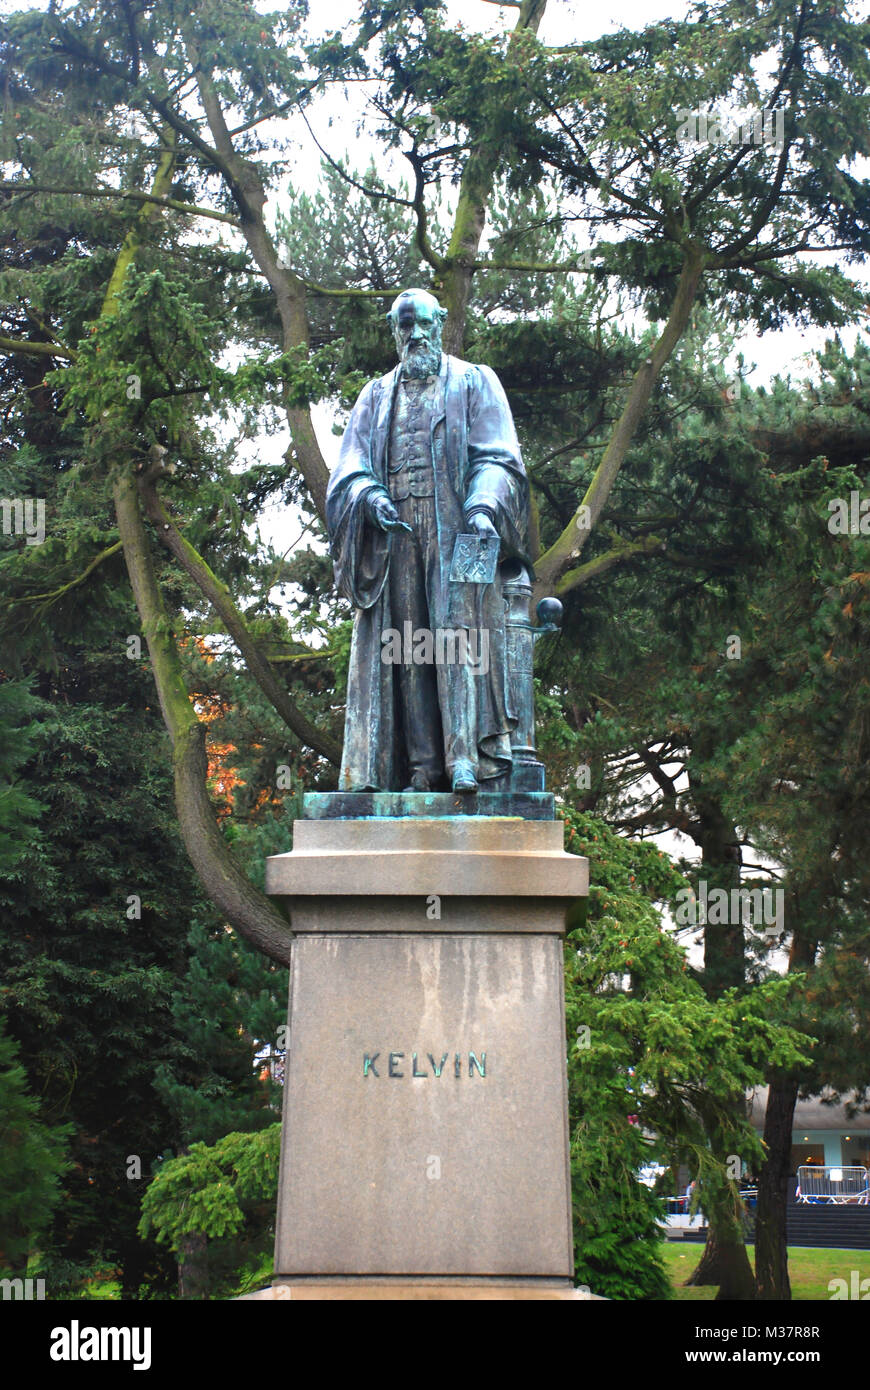 Lord Kelvin Statue in Botanic Gardens, Belfast, Northern Ireland, UK Stock Photohttps://www.alamy.com/image-license-details/?v=1https://www.alamy.com/stock-photo-lord-kelvin-statue-in-botanic-gardens-belfast-northern-ireland-uk-174119591.html
RMM37R8R–Lord Kelvin Statue in Botanic Gardens, Belfast, Northern Ireland, UK
RF2HKH5XJ–Fahrenheit Simple vector icon. Illustration symbol design template for web mobile UI element.
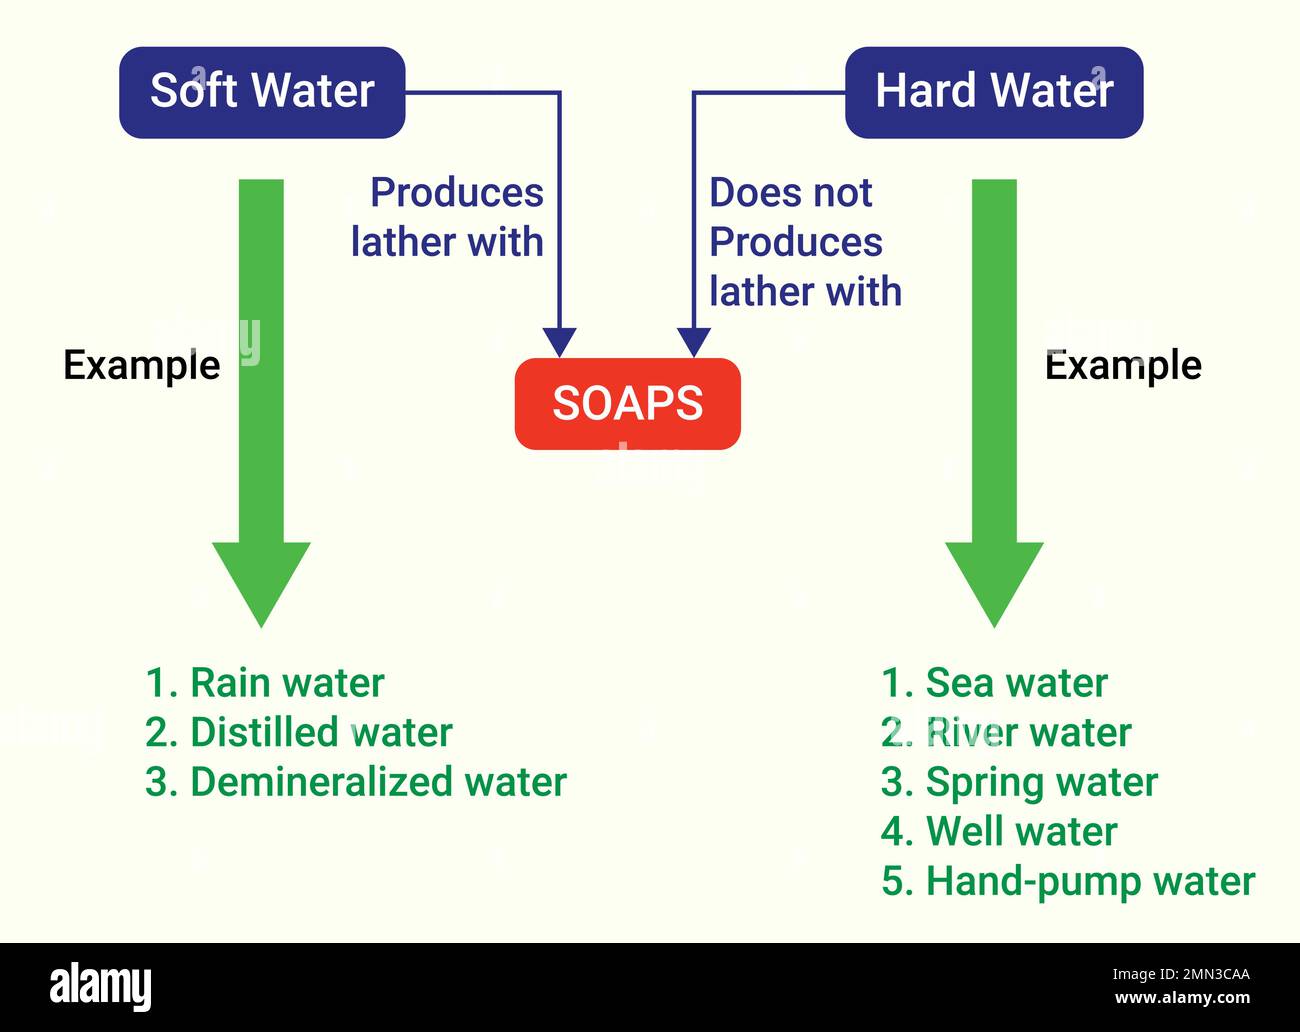 Difference between hard water and soft water Stock Vectorhttps://www.alamy.com/image-license-details/?v=1https://www.alamy.com/difference-between-hard-water-and-soft-water-image512084002.html
RF2MN3CAA–Difference between hard water and soft water
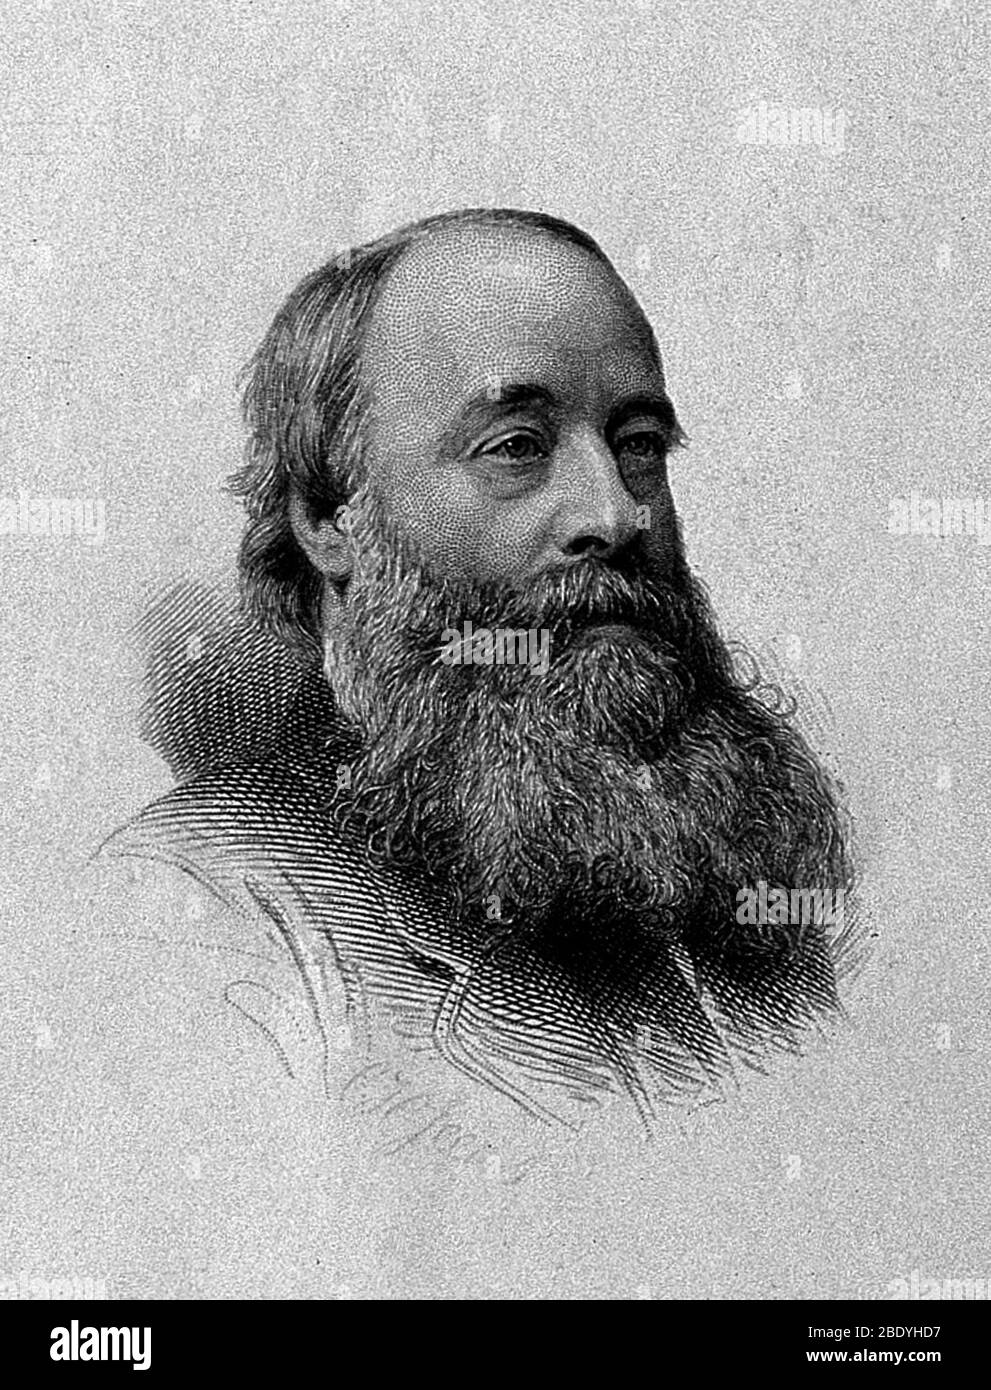 James Prescott Joule, English Physicist Stock Photohttps://www.alamy.com/image-license-details/?v=1https://www.alamy.com/james-prescott-joule-english-physicist-image352804291.html
RM2BDYHD7–James Prescott Joule, English Physicist
 A thermometer closeup Stock Photohttps://www.alamy.com/image-license-details/?v=1https://www.alamy.com/a-thermometer-closeup-image5498941.html
RMAXGT3E–A thermometer closeup
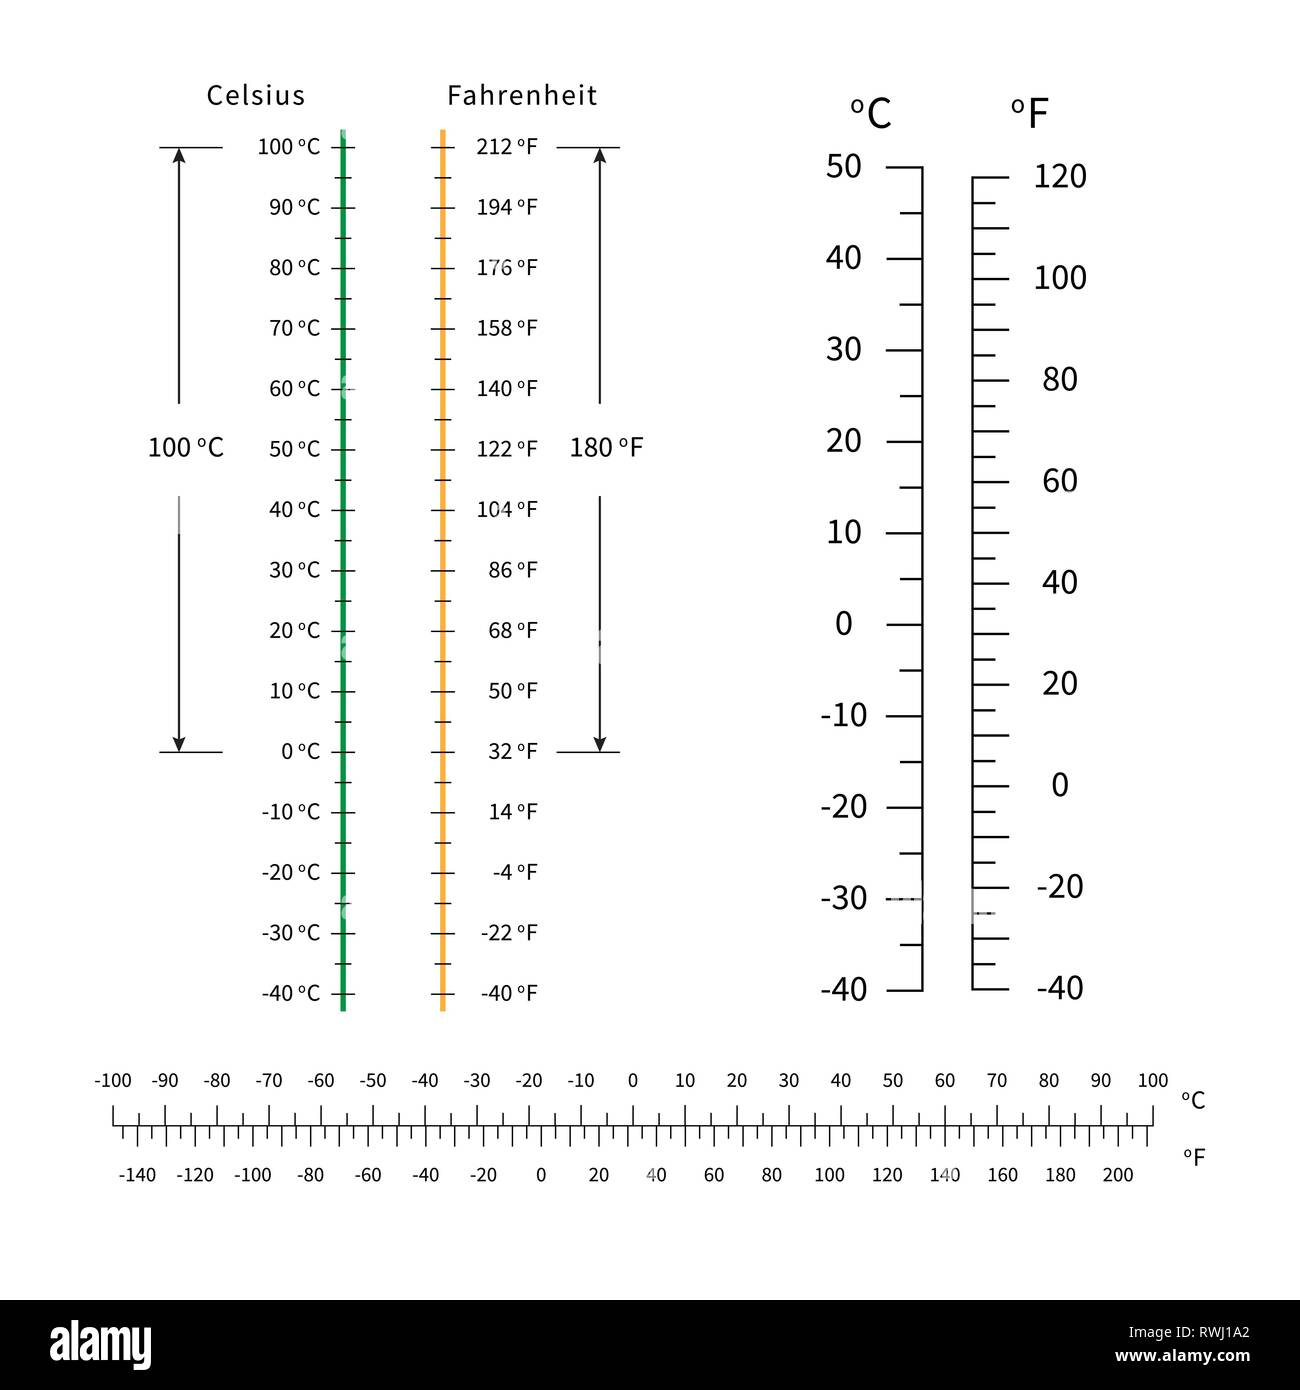 celsius and fahrenheit temperature scale. markup for meteorology thermometers. vector. Stock Vectorhttps://www.alamy.com/image-license-details/?v=1https://www.alamy.com/celsius-and-fahrenheit-temperature-scale-markup-for-meteorology-thermometers-vector-image239497386.html
RFRWJ1A2–celsius and fahrenheit temperature scale. markup for meteorology thermometers. vector.
RF2K40B9N–Humidity Icon. Editable Bold Outline With Color Fill Design. Vector Illustration.
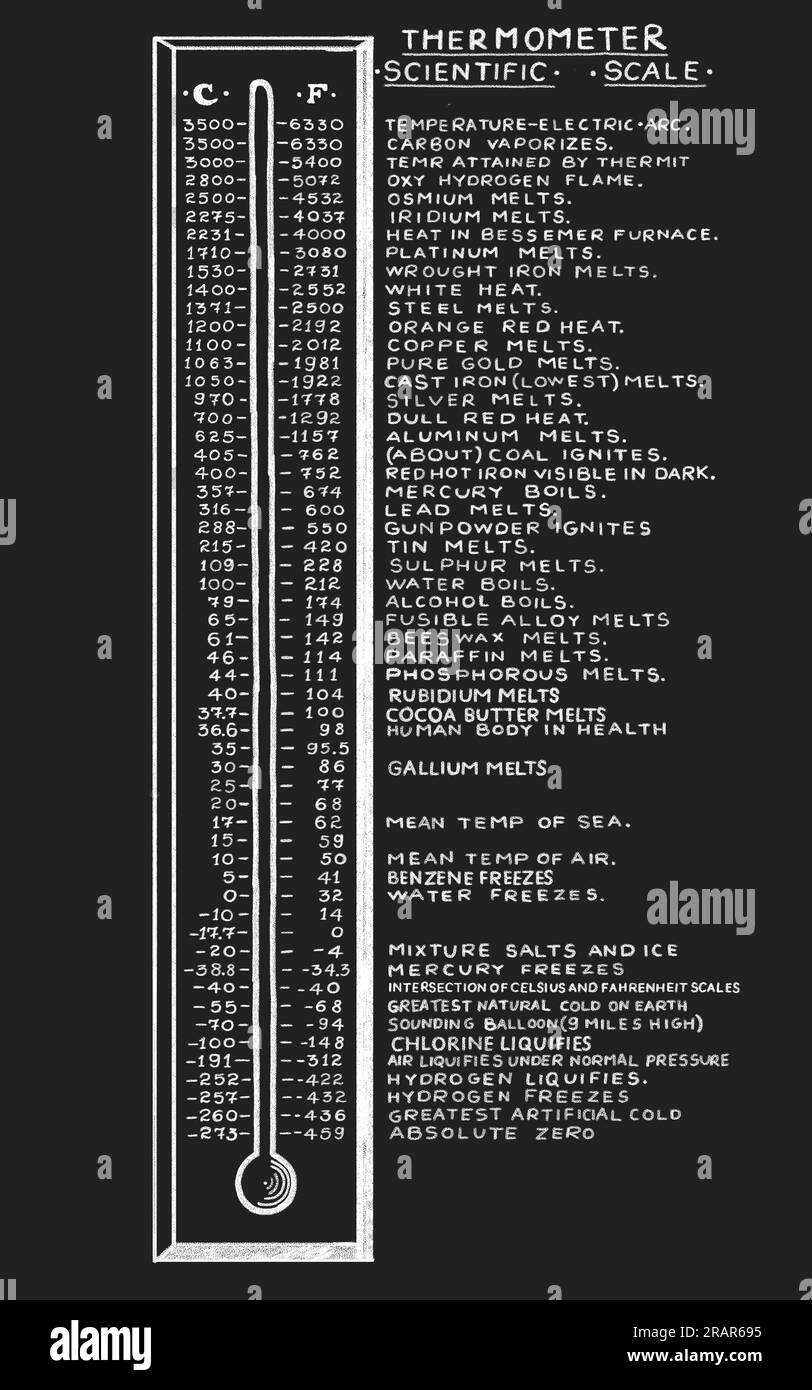 Scientific Bar Thermometer with Celsius and Fahrenheit temperature scales. Table of boiling and freezing temperature of chemical elements and products Stock Photohttps://www.alamy.com/image-license-details/?v=1https://www.alamy.com/scientific-bar-thermometer-with-celsius-and-fahrenheit-temperature-scales-table-of-boiling-and-freezing-temperature-of-chemical-elements-and-products-image557388193.html
RF2RAR695–Scientific Bar Thermometer with Celsius and Fahrenheit temperature scales. Table of boiling and freezing temperature of chemical elements and products
RF2JPM2Y3–Humidity Icon. Flat Circle Stencil Design With Long Shadow. Vector Illustration.
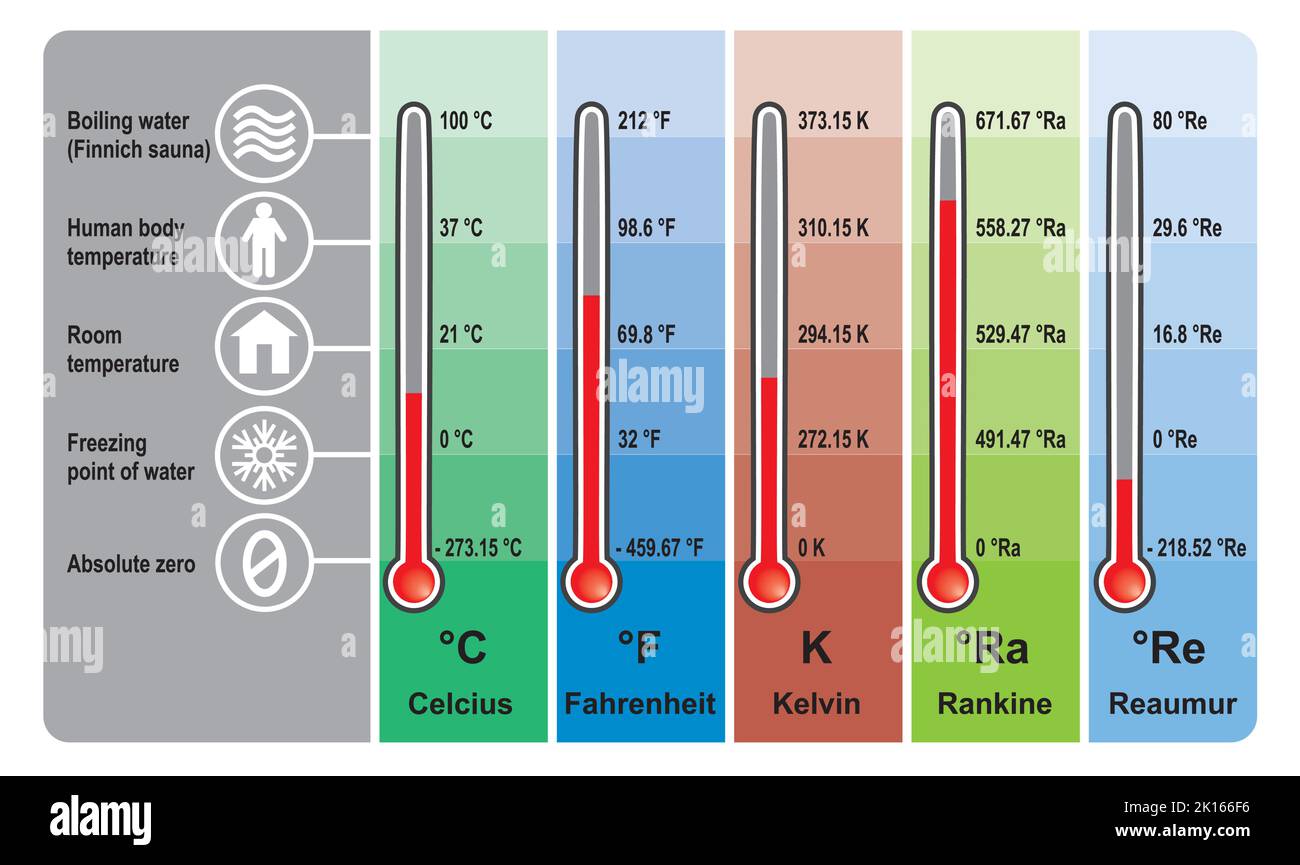 Temperature Units And Temperature Unit Conversion. Isolated on Thermometer Design. Colorful Symbols. Vector Illustration. Stock Vectorhttps://www.alamy.com/image-license-details/?v=1https://www.alamy.com/temperature-units-and-temperature-unit-conversion-isolated-on-thermometer-design-colorful-symbols-vector-illustration-image482641802.html
RF2K166F6–Temperature Units And Temperature Unit Conversion. Isolated on Thermometer Design. Colorful Symbols. Vector Illustration.
RF2JHJDGK–Humidity Icon. Editable Bold Outline With Color Fill Design. Vector Illustration.
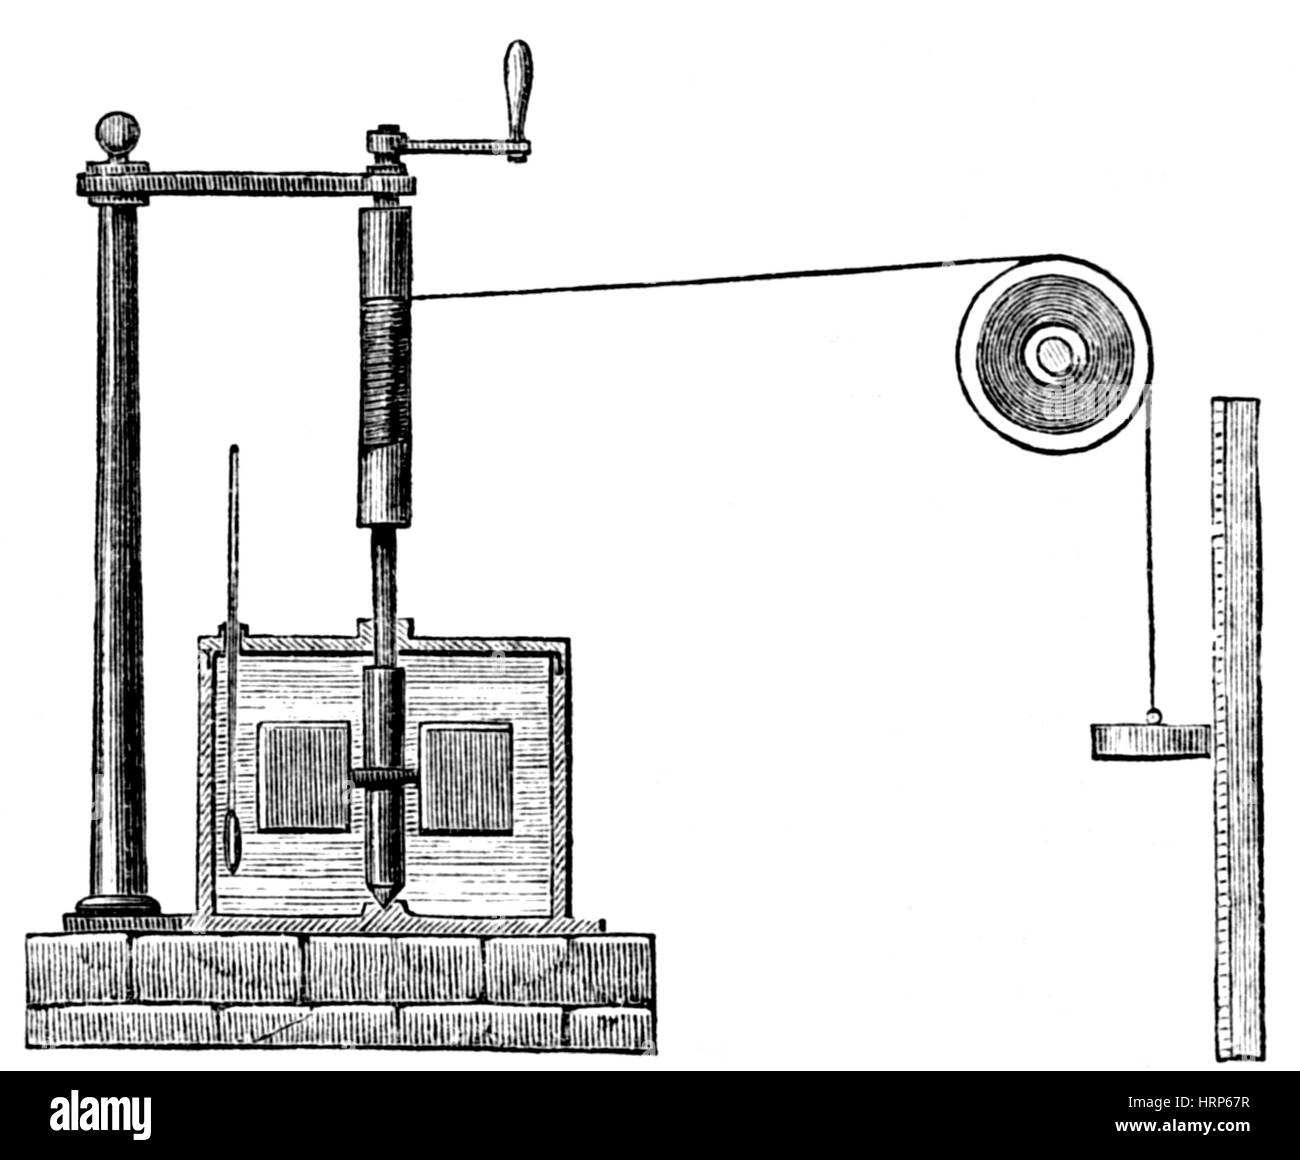 James Joule's Electric Motor Heat Apparatus, 1869 Stock Photohttps://www.alamy.com/image-license-details/?v=1https://www.alamy.com/stock-photo-james-joules-electric-motor-heat-apparatus-1869-135097531.html
RMHRP67R–James Joule's Electric Motor Heat Apparatus, 1869
RF2JGJ056–Humidity Icon. Bold outline design with editable stroke width. Vector Illustration.
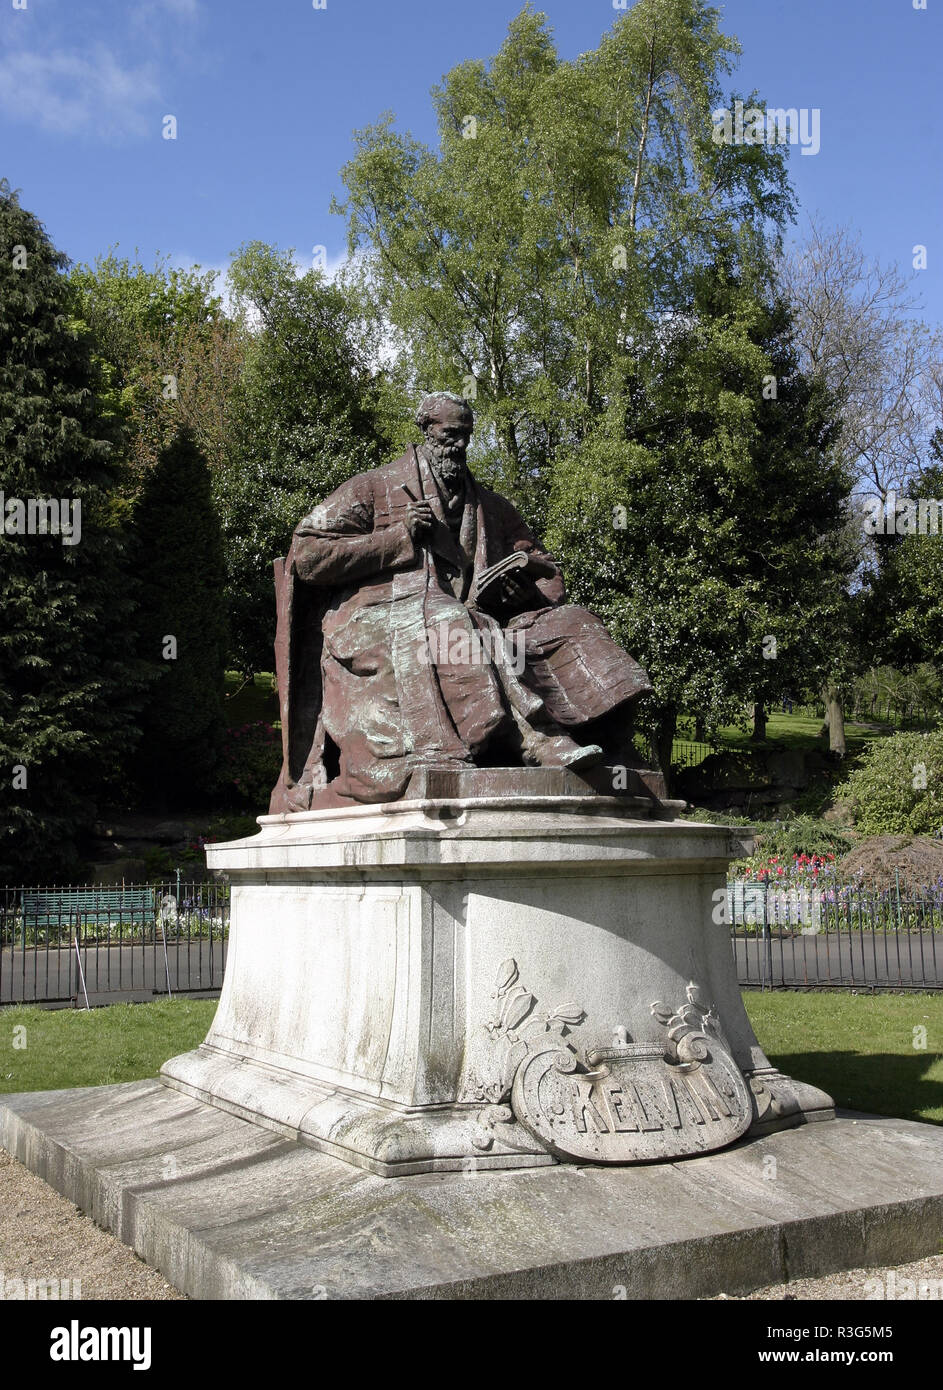 This statue of Lord Kelvin, (William Thomson), who was a mathematical physicist and engineer and is best known for devising the absolute temperature scale. The statue sits in Kelvingrove park beside the River Kelvin in Glasgow. Stock Photohttps://www.alamy.com/image-license-details/?v=1https://www.alamy.com/this-statue-of-lord-kelvin-william-thomson-who-was-a-mathematical-physicist-and-engineer-and-is-best-known-for-devising-the-absolute-temperature-scale-the-statue-sits-in-kelvingrove-park-beside-the-river-kelvin-in-glasgow-image225934469.html
RMR3G5M5–This statue of Lord Kelvin, (William Thomson), who was a mathematical physicist and engineer and is best known for devising the absolute temperature scale. The statue sits in Kelvingrove park beside the River Kelvin in Glasgow.
RF2JEKE4K–Humidity Icon. Editable Bold Outline With Color Fill Design. Vector Illustration.
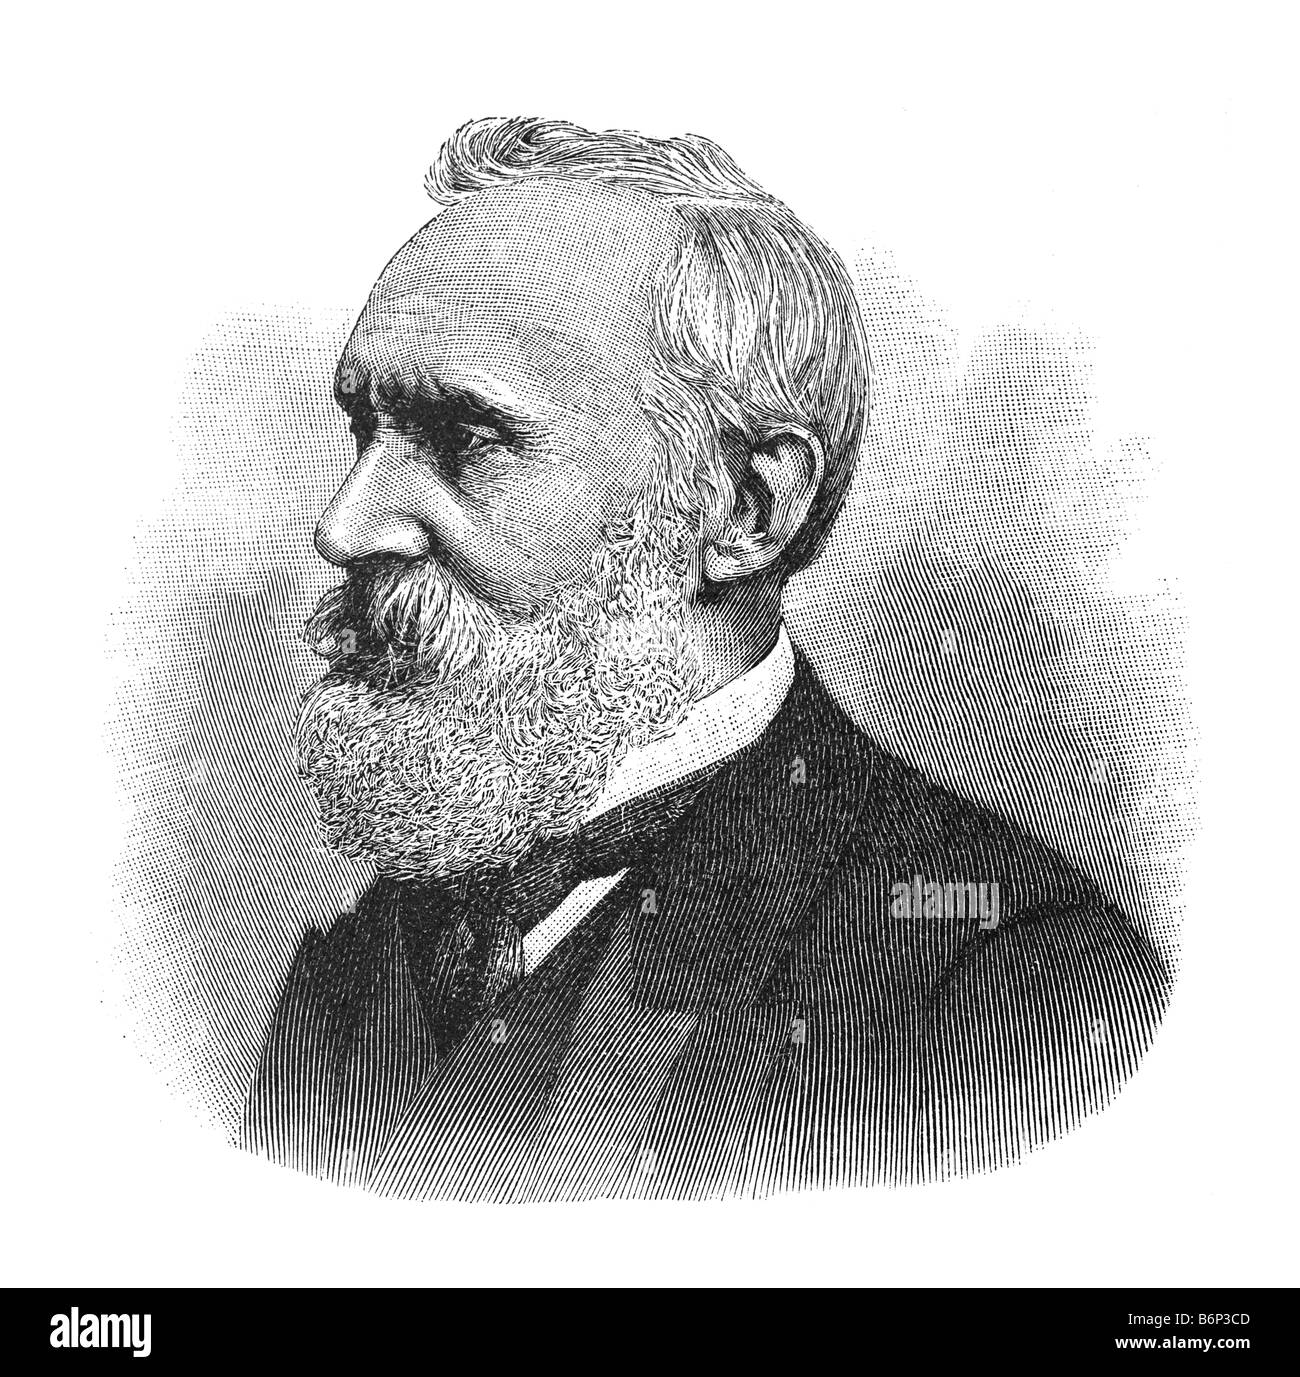 William Thomson, 1st Baron Kelvin, Lord, 26. June 1824 Belfast, Northireland - 17. Dez 1907 Netherhall near Largs, Scottland Stock Photohttps://www.alamy.com/image-license-details/?v=1https://www.alamy.com/stock-photo-william-thomson-1st-baron-kelvin-lord-26-june-1824-belfast-northireland-21383949.html
RMB6P3CD–William Thomson, 1st Baron Kelvin, Lord, 26. June 1824 Belfast, Northireland - 17. Dez 1907 Netherhall near Largs, Scottland
RF2JAT843–Humidity Icon. Bold outline design with editable stroke width. Vector Illustration.
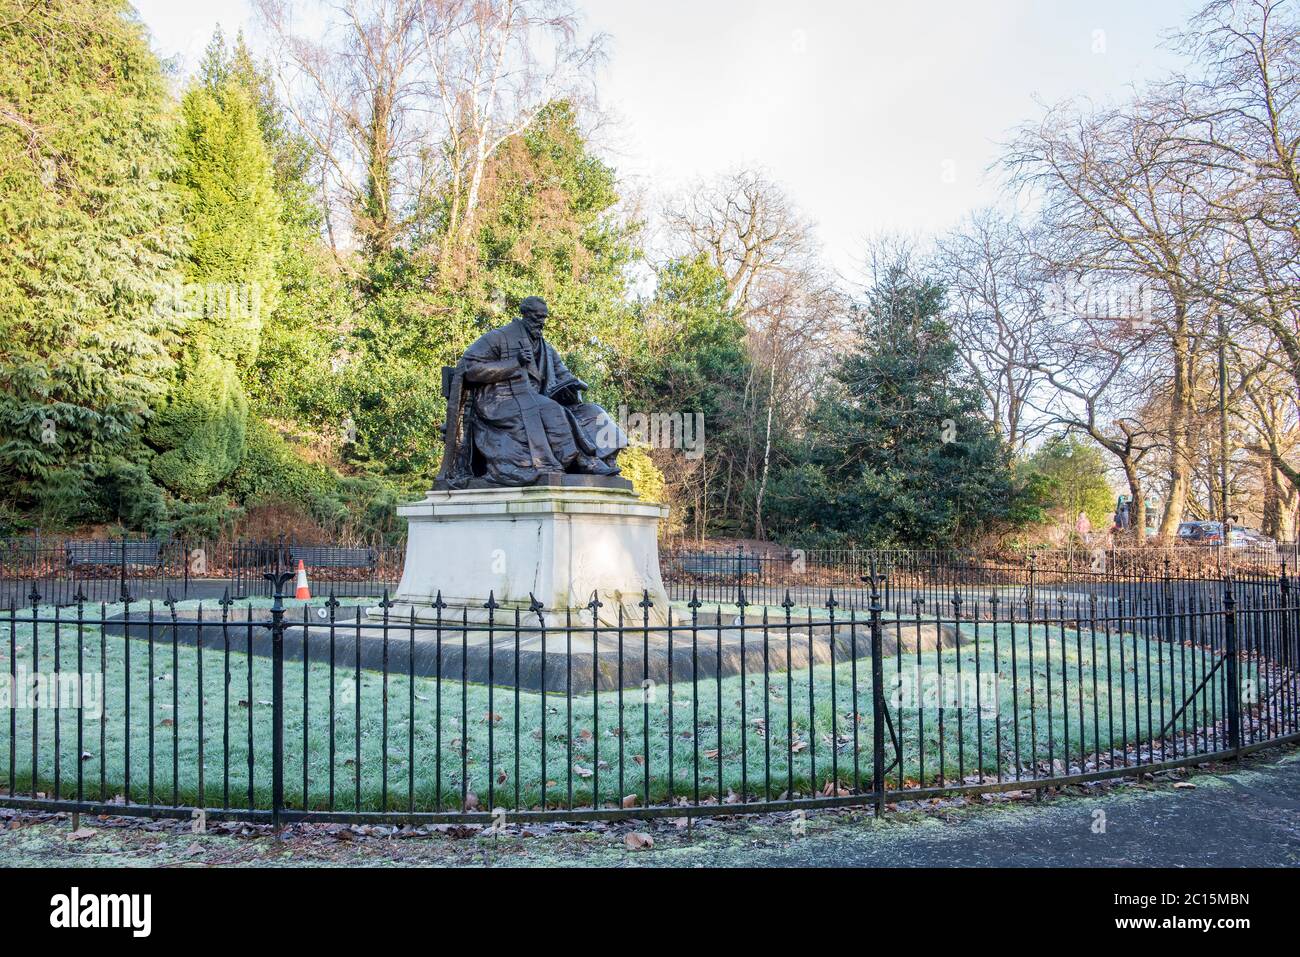 Statue of Lord Kelvin in garden in Kelvingrove Park, Glasgow Stock Photohttps://www.alamy.com/image-license-details/?v=1https://www.alamy.com/statue-of-lord-kelvin-in-garden-in-kelvingrove-park-glasgow-image362158153.html
RF2C15MBN–Statue of Lord Kelvin in garden in Kelvingrove Park, Glasgow
RF2J9AC9F–Humidity Icon. Editable Bold Outline With Color Fill Design. Vector Illustration.
 A universal formulary : containing the methods of preparing and administering officinal and other medicines : the whole adapted to physicians and pharmaceutists . d into 100 parts or de-grees. The lowest division marked 0,at the bottom of the scale, denotes thespecific grayity of pure water at a tem-perature of 15° Cent.; and the highestdivision, at the top of the scale, the spe-cific gravity of absolute alcohol at thesame temperature. The intermediatedegrees indicate the number of volumes of absolute alcohol in 100 volumesof the spirit tried. The instrument is accompanied by a table for corre Stock Photohttps://www.alamy.com/image-license-details/?v=1https://www.alamy.com/a-universal-formulary-containing-the-methods-of-preparing-and-administering-officinal-and-other-medicines-the-whole-adapted-to-physicians-and-pharmaceutists-d-into-100-parts-or-de-grees-the-lowest-division-marked-0at-the-bottom-of-the-scale-denotes-thespecific-grayity-of-pure-water-at-a-tem-perature-of-15-cent-and-the-highestdivision-at-the-top-of-the-scale-the-spe-cific-gravity-of-absolute-alcohol-at-thesame-temperature-the-intermediatedegrees-indicate-the-number-of-volumes-of-absolute-alcohol-in-100-volumesof-the-spirit-tried-the-instrument-is-accompanied-by-a-table-for-corre-image340130864.html
RM2ANA8AT–A universal formulary : containing the methods of preparing and administering officinal and other medicines : the whole adapted to physicians and pharmaceutists . d into 100 parts or de-grees. The lowest division marked 0,at the bottom of the scale, denotes thespecific grayity of pure water at a tem-perature of 15° Cent.; and the highestdivision, at the top of the scale, the spe-cific gravity of absolute alcohol at thesame temperature. The intermediatedegrees indicate the number of volumes of absolute alcohol in 100 volumesof the spirit tried. The instrument is accompanied by a table for corre
RF2HD7W0A–Humidity Icon. Flat Color Design. Vector Illustration.
 Flow chart for Action of Litmus Stock Vectorhttps://www.alamy.com/image-license-details/?v=1https://www.alamy.com/flow-chart-for-action-of-litmus-image512084805.html
RF2MN3DB1–Flow chart for Action of Litmus
RFT9YMP1–Humidity Icon. Flat Color Ladder Design. Vector Illustration.
 A thermometer with shallow depth of field focus on freezing temperatures Stock Photohttps://www.alamy.com/image-license-details/?v=1https://www.alamy.com/a-thermometer-with-shallow-depth-of-field-focus-on-freezing-temperatures-image5498946.html
RMAXGT43–A thermometer with shallow depth of field focus on freezing temperatures
RF2CWAYBH–Humidity Icon. Flat Color Design. Vector Illustration.
RF2PPP7BT–Humidity Icon
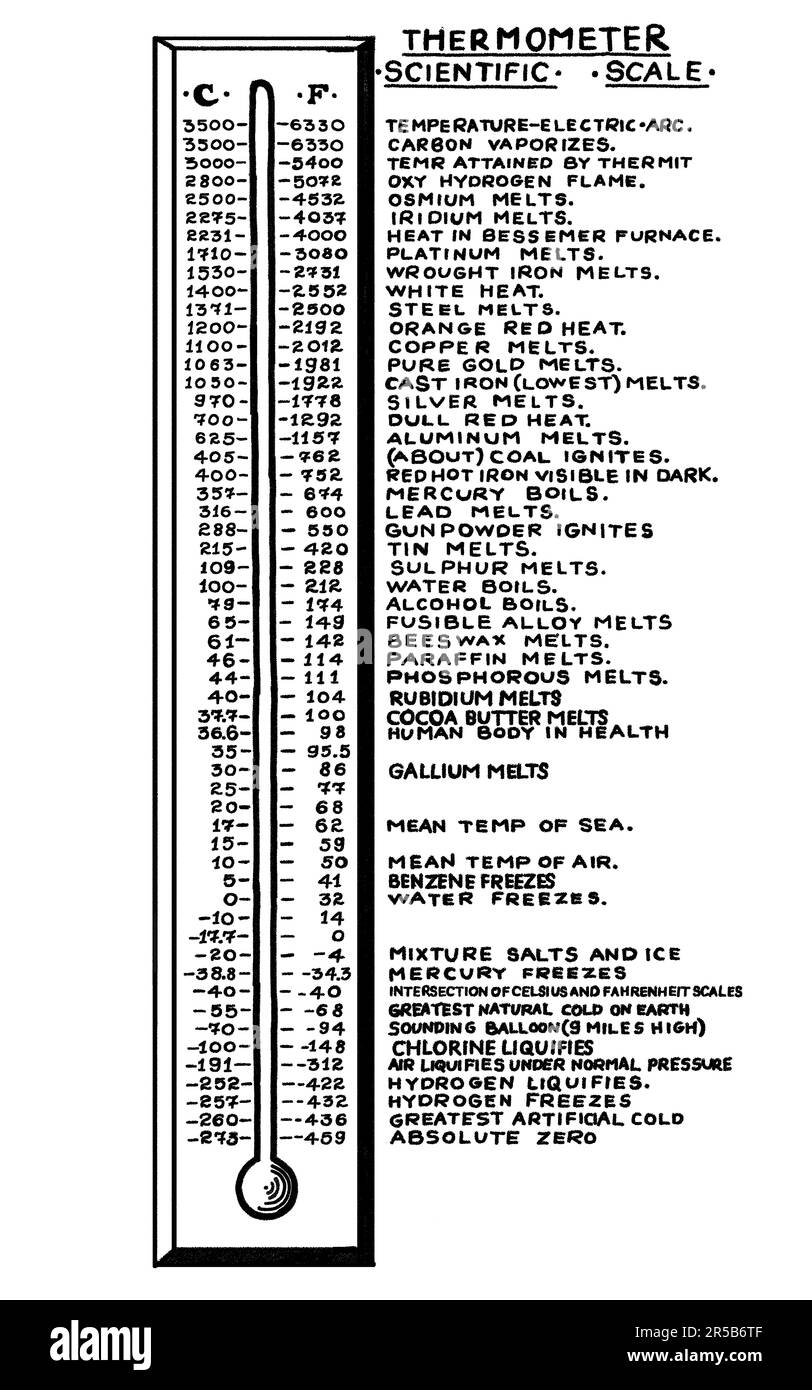 Scientific Bar Thermometer with Celsius and Fahrenheit temperature scales. Table of boiling and freezing temperature of chemical elements and products Stock Photohttps://www.alamy.com/image-license-details/?v=1https://www.alamy.com/scientific-bar-thermometer-with-celsius-and-fahrenheit-temperature-scales-table-of-boiling-and-freezing-temperature-of-chemical-elements-and-products-image554051919.html
RF2R5B6TF–Scientific Bar Thermometer with Celsius and Fahrenheit temperature scales. Table of boiling and freezing temperature of chemical elements and products
RF2GM66NT–Minus thermometer icon. Outline minus thermometer vector icon color flat isolated on white
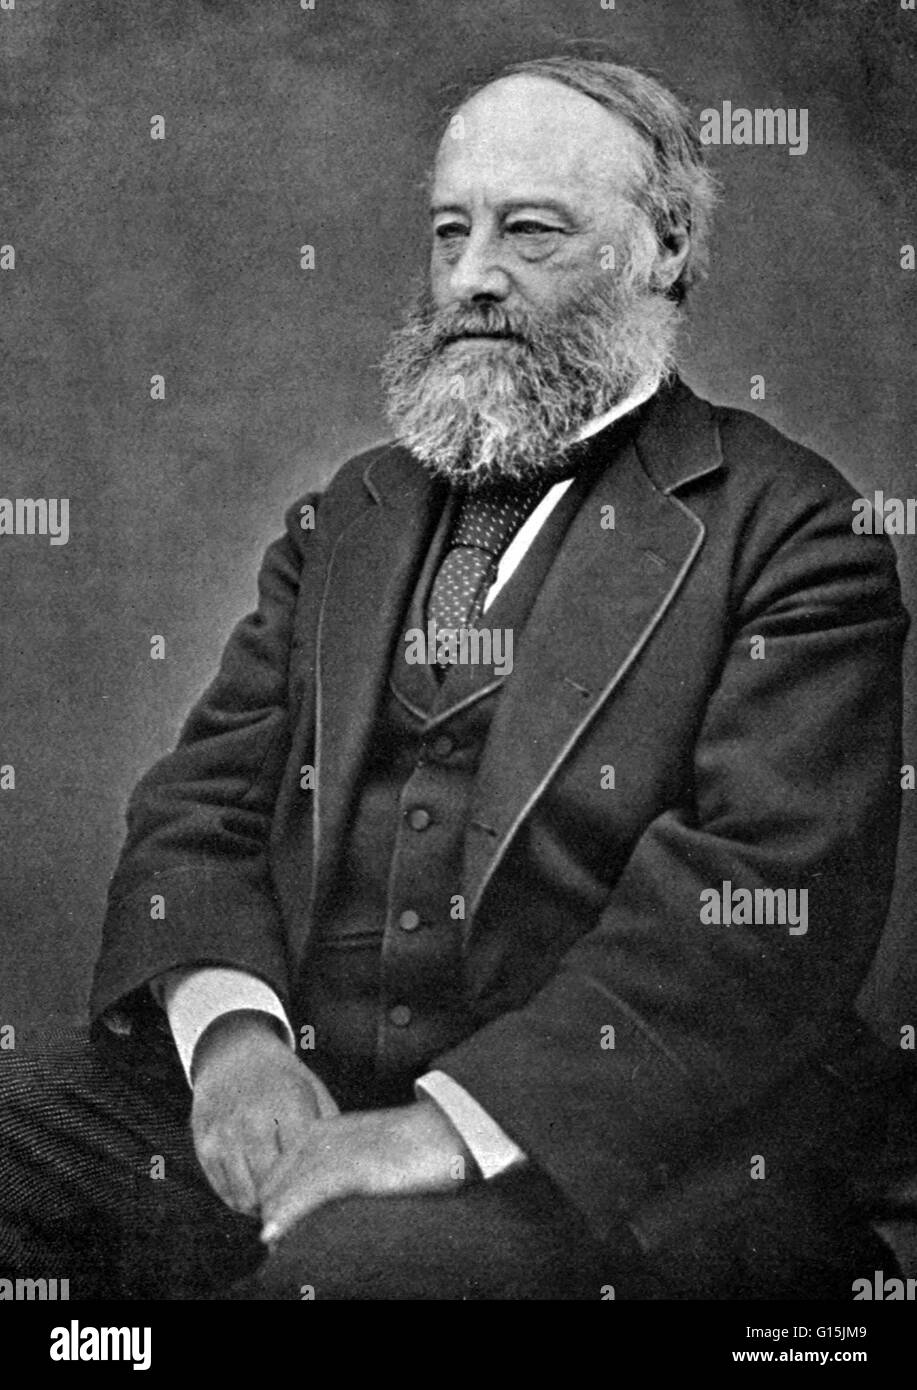 James Prescott Joule (1818-1889) was an English physicist and brewer. He studied the nature of heat, and discovered its relationship to mechanical work. This led to the theory of conservation of energy, which led to the development of the first law of the Stock Photohttps://www.alamy.com/image-license-details/?v=1https://www.alamy.com/stock-photo-james-prescott-joule-1818-1889-was-an-english-physicist-and-brewer-104001305.html
RMG15JM9–James Prescott Joule (1818-1889) was an English physicist and brewer. He studied the nature of heat, and discovered its relationship to mechanical work. This led to the theory of conservation of energy, which led to the development of the first law of the
 Laboratory exercises to accompany Carhart and Chute's First principles of physics . are 0°C. and 100° C, respectively, as these tempera-tures are easy to obtain with ice and steam. The gas isconfined in a Charles law tube by means of a mercury 198 LABORATORY EXERCISES plug, which is free to move as the volume of the gaschanges. The relation between volume and temperature underconstant pressure is most conveniently expressed withreference to the absolute scale of temperature. On thisscale the zero corresponds to — 273° C. The Centigradezero is equivalent to 273° A. To change Centigradetemperatu Stock Photohttps://www.alamy.com/image-license-details/?v=1https://www.alamy.com/laboratory-exercises-to-accompany-carhart-and-chutes-first-principles-of-physics-are-0c-and-100-c-respectively-as-these-tempera-tures-are-easy-to-obtain-with-ice-and-steam-the-gas-isconfined-in-a-charles-law-tube-by-means-of-a-mercury-198-laboratory-exercises-plug-which-is-free-to-move-as-the-volume-of-the-gaschanges-the-relation-between-volume-and-temperature-underconstant-pressure-is-most-conveniently-expressed-withreference-to-the-absolute-scale-of-temperature-on-thisscale-the-zero-corresponds-to-273-c-the-centigradezero-is-equivalent-to-273-a-to-change-centigradetemperatu-image340309511.html
RM2ANJC73–Laboratory exercises to accompany Carhart and Chute's First principles of physics . are 0°C. and 100° C, respectively, as these tempera-tures are easy to obtain with ice and steam. The gas isconfined in a Charles law tube by means of a mercury 198 LABORATORY EXERCISES plug, which is free to move as the volume of the gaschanges. The relation between volume and temperature underconstant pressure is most conveniently expressed withreference to the absolute scale of temperature. On thisscale the zero corresponds to — 273° C. The Centigradezero is equivalent to 273° A. To change Centigradetemperatu
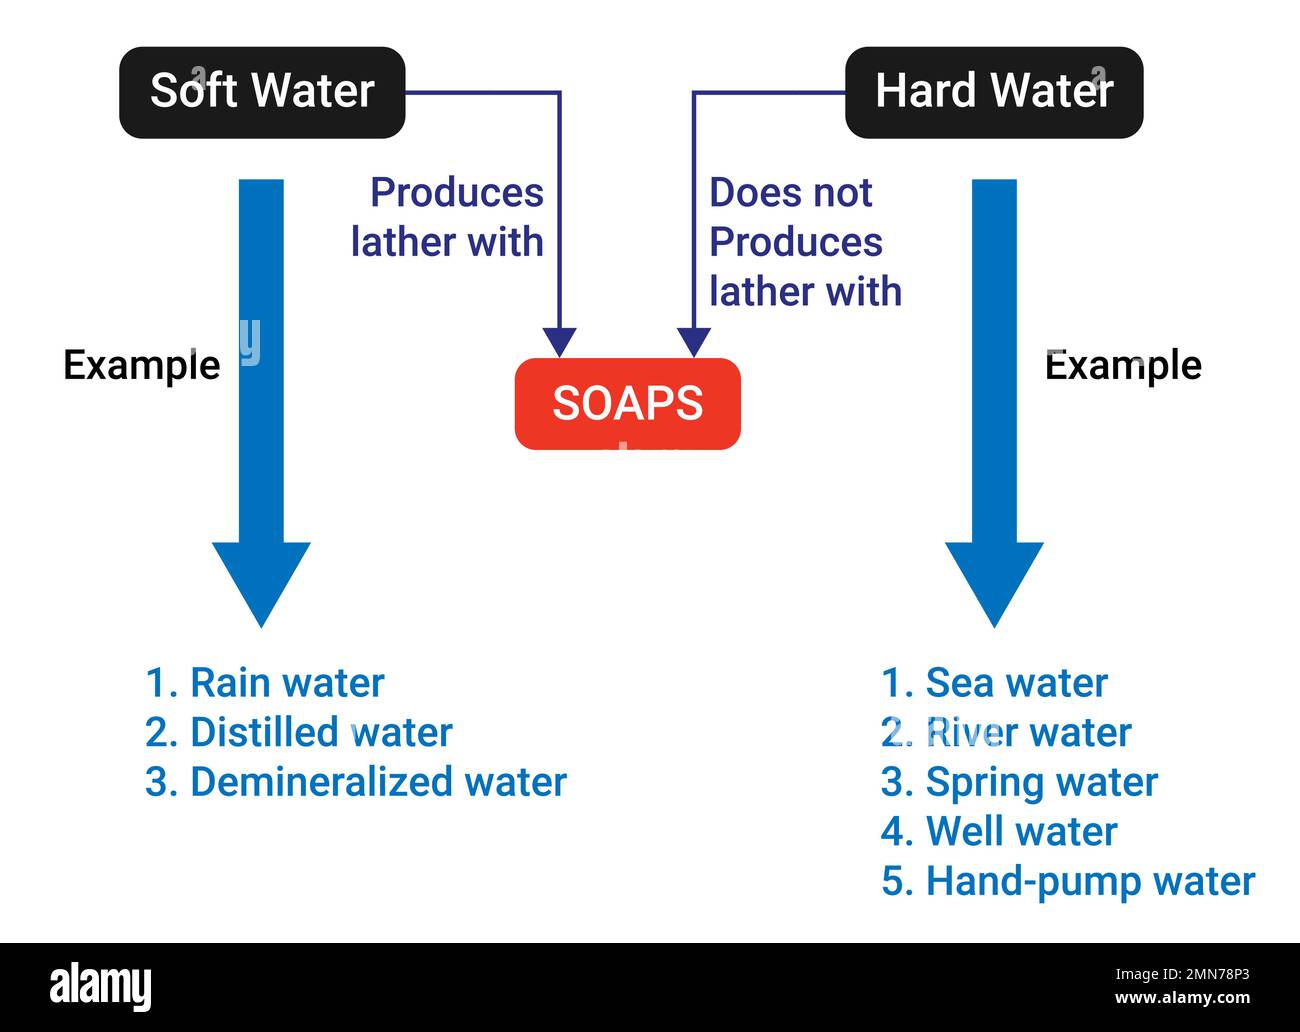 Difference between hard water and soft water Stock Vectorhttps://www.alamy.com/image-license-details/?v=1https://www.alamy.com/difference-between-hard-water-and-soft-water-image512169003.html
RF2MN78P3–Difference between hard water and soft water
 A thermometer closeup Stock Photohttps://www.alamy.com/image-license-details/?v=1https://www.alamy.com/a-thermometer-closeup-image5498943.html
RMAXGT40–A thermometer closeup
RF2A4YKXK–Humidity Icon. Thin Line With Blue Fill Design. Vector Illustration.
RF2PTY88R–Humidity Icon
RFTWJKM4–Humidity Icon. Shadow Reflection Design. Vector Illustration.
RFRCA16W–Minus thermometer icon, outline style
RFHK0Y20–Humidity icon. White background with shadow design. Vector illustration.
RFRY03FK–Humidity icon. Flat color design. Vector illustration.
RFH0PCTK–Humidity icon. Black background with white. Vector illustration.
 Bulletin . ibrium of temperature.0 From the three figures it is found that theaverage temperature indicated by the three thermocouples embeddednear the hotter surface of the air space is 514° C, ordinary scale, or1,418° F.- on the absolute scale, and the average of the indicationsof the three couples embedded near the colder surface is about 408° C,ordinary scale, or 1,227° F., absolute scale. We have then: Tj-1,418° F. and T2=1,227°F. a It should be remembered, however, that in the experiments discussed the junctions of the thermo-couples were embedded In the brick about 1 incli from the surf Stock Photohttps://www.alamy.com/image-license-details/?v=1https://www.alamy.com/bulletin-ibrium-of-temperature0-from-the-three-figures-it-is-found-that-theaverage-temperature-indicated-by-the-three-thermocouples-embeddednear-the-hotter-surface-of-the-air-space-is-514-c-ordinary-scale-or1418-f-on-the-absolute-scale-and-the-average-of-the-indicationsof-the-three-couples-embedded-near-the-colder-surface-is-about-408-cordinary-scale-or-1227-f-absolute-scale-we-have-then-tj-1418-f-and-t2=1227f-a-it-should-be-remembered-however-that-in-the-experiments-discussed-the-junctions-of-the-thermo-couples-were-embedded-in-the-brick-about-1-incli-from-the-surf-image343110623.html
RM2AX612R–Bulletin . ibrium of temperature.0 From the three figures it is found that theaverage temperature indicated by the three thermocouples embeddednear the hotter surface of the air space is 514° C, ordinary scale, or1,418° F.- on the absolute scale, and the average of the indicationsof the three couples embedded near the colder surface is about 408° C,ordinary scale, or 1,227° F., absolute scale. We have then: Tj-1,418° F. and T2=1,227°F. a It should be remembered, however, that in the experiments discussed the junctions of the thermo-couples were embedded In the brick about 1 incli from the surf
 Flow chart for Action of Litmus Stock Vectorhttps://www.alamy.com/image-license-details/?v=1https://www.alamy.com/flow-chart-for-action-of-litmus-image512182463.html
RF2MN7WXR–Flow chart for Action of Litmus
 A thermometer closeup Stock Photohttps://www.alamy.com/image-license-details/?v=1https://www.alamy.com/a-thermometer-closeup-image5498938.html
RMAXGT3B–A thermometer closeup
RF2PR13A8–Humidity Icon
RFH3KPG5–Humidity icon. Blue frame design. Vector illustration.
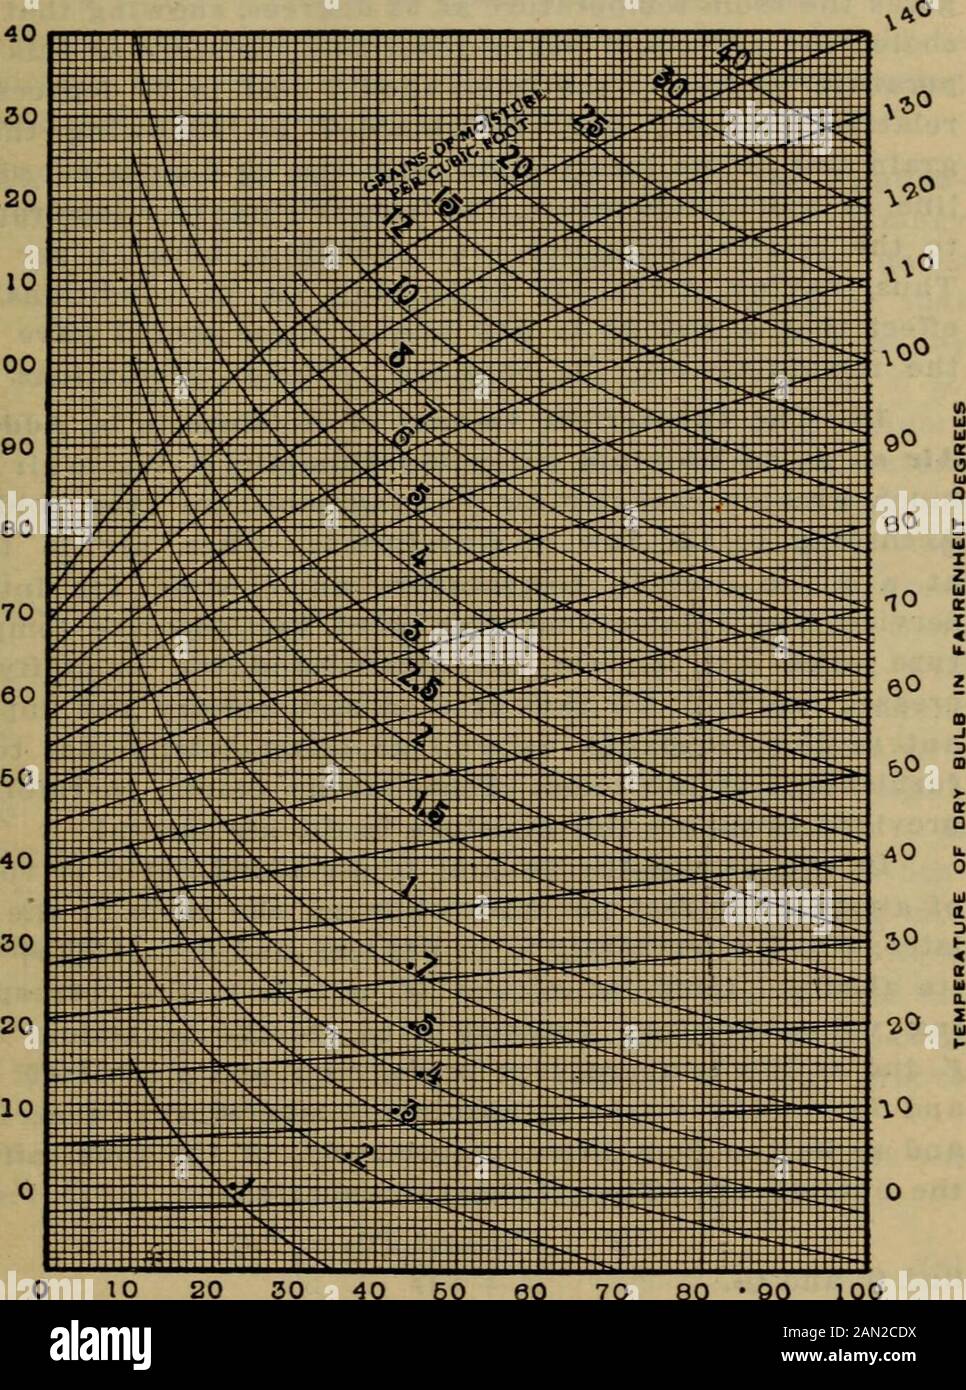 Handbook for heating and ventilating engineers . e along thebottom of the chart is one of relative humidity. The scale ofnumbers up the center of the chart refers to the lines curvingdownward from left to right, and indicates the absolute hu-midity, i. e,, grains of moisture per cubic foot with the air.The use of the chart may be most readily understood by afew applications. Application.—Given dry bulb 70 degrees and wet bulb COdegrees. Determine relative humidity, absolute humidity,temperature of dew point for room, etc. First, starting onthe right hand scale at 70, follow down the line this Stock Photohttps://www.alamy.com/image-license-details/?v=1https://www.alamy.com/handbook-for-heating-and-ventilating-engineers-e-along-thebottom-of-the-chart-is-one-of-relative-humidity-the-scale-ofnumbers-up-the-center-of-the-chart-refers-to-the-lines-curvingdownward-from-left-to-right-and-indicates-the-absolute-hu-midity-i-e-grains-of-moisture-per-cubic-foot-with-the-airthe-use-of-the-chart-may-be-most-readily-understood-by-afew-applications-applicationgiven-dry-bulb-70-degrees-and-wet-bulb-codegrees-determine-relative-humidity-absolute-humiditytemperature-of-dew-point-for-room-etc-first-starting-onthe-right-hand-scale-at-70-follow-down-the-line-this-image339958470.html
RM2AN2CDX–Handbook for heating and ventilating engineers . e along thebottom of the chart is one of relative humidity. The scale ofnumbers up the center of the chart refers to the lines curvingdownward from left to right, and indicates the absolute hu-midity, i. e,, grains of moisture per cubic foot with the air.The use of the chart may be most readily understood by afew applications. Application.—Given dry bulb 70 degrees and wet bulb COdegrees. Determine relative humidity, absolute humidity,temperature of dew point for room, etc. First, starting onthe right hand scale at 70, follow down the line this
RF2PPR108–Humidity Icon
RFHAKXB6–Humidity icon. Gray background with green. Vector illustration.
RFGJPDB8–Humidity icon. Shadow reflection design. Vector illustration.
 Canadian grocer July-December 1908 . es are equipped with a thermostat, like a watch,which makes them weigh with absolute accuracy in any temperature. No swinging pendulum, no moving indicators, no poises to shift, nobeams to bother with, no ball to forget, no friction to pay for. This scale saves time and money. THt SCALE THAT SAVES IS NO EXPENSE. Drop us a line for full information. TKe Computing Scale Co. of Canada, Limited 164 W. tiiag St., Toronto, Out. Balmoral Scotch Marmalade Is made by men who knowand who use only selectedSeville bitter oranges andpure Canadian granulatedsugar. It is Stock Photohttps://www.alamy.com/image-license-details/?v=1https://www.alamy.com/canadian-grocer-july-december-1908-es-are-equipped-with-a-thermostat-like-a-watchwhich-makes-them-weigh-with-absolute-accuracy-in-any-temperature-no-swinging-pendulum-no-moving-indicators-no-poises-to-shift-nobeams-to-bother-with-no-ball-to-forget-no-friction-to-pay-for-this-scale-saves-time-and-money-tht-scale-that-saves-is-no-expense-drop-us-a-line-for-full-information-tke-computing-scale-co-of-canada-limited-164-w-tiiag-st-toronto-out-balmoral-scotch-marmalade-is-made-by-men-who-knowand-who-use-only-selectedseville-bitter-oranges-andpure-canadian-granulatedsugar-it-is-image338176437.html
RM2AJ57DW–Canadian grocer July-December 1908 . es are equipped with a thermostat, like a watch,which makes them weigh with absolute accuracy in any temperature. No swinging pendulum, no moving indicators, no poises to shift, nobeams to bother with, no ball to forget, no friction to pay for. This scale saves time and money. THt SCALE THAT SAVES IS NO EXPENSE. Drop us a line for full information. TKe Computing Scale Co. of Canada, Limited 164 W. tiiag St., Toronto, Out. Balmoral Scotch Marmalade Is made by men who knowand who use only selectedSeville bitter oranges andpure Canadian granulatedsugar. It is
 summer Stock Photohttps://www.alamy.com/image-license-details/?v=1https://www.alamy.com/stock-photo-summer-141127008.html
RFJ5GTX8–summer
RFGK9411–Humidity icon. Glossy button design. Vector illustration.
 Handbook of thermodynamic tables and diagrams; a selection of tables and diagrams from Engineering thermodynamics . SO 40 50 55 280 290 300 305 455 465 475 480 630 610 Lower Scale = Temperature in Degrees F. Upper Scale = Pressure in IDs. per sq.in. aba. Chart 18.—Steam, Latent Heat (Table XL). 650 655 170 HANDBOOK OF THERMODYNAMIC CllEO ? ^^ 12 13 , 14 ?i ^^ ^-^ ^ ^ ^ ^-?- ri^ 190 200 210 6.0 . 7.0 8.0 9.0 1 1 1 1 ^^^ 1 ^ ^ ^ ^^? u r i Lower Scale = Temperature Degrees .FahrenheitUpper Scale=Pressure Lbs. Per Square Inch Absolute 820 900 1000 11521205 1200 Stock Photohttps://www.alamy.com/image-license-details/?v=1https://www.alamy.com/handbook-of-thermodynamic-tables-and-diagrams-a-selection-of-tables-and-diagrams-from-engineering-thermodynamics-so-40-50-55-280-290-300-305-455-465-475-480-630-610-lower-scale-=-temperature-in-degrees-f-upper-scale-=-pressure-in-ids-per-sqin-aba-chart-18steam-latent-heat-table-xl-650-655-170-handbook-of-thermodynamic-clleo-12-13-14-i-ri-190-200-210-60-70-80-90-1-1-1-1-1-u-r-i-lower-scale-=-temperature-degrees-fahrenheitupper-scale=pressure-lbs-per-square-inch-absolute-820-900-1000-11521205-1200-image338380321.html
RM2AJEFFD–Handbook of thermodynamic tables and diagrams; a selection of tables and diagrams from Engineering thermodynamics . SO 40 50 55 280 290 300 305 455 465 475 480 630 610 Lower Scale = Temperature in Degrees F. Upper Scale = Pressure in IDs. per sq.in. aba. Chart 18.—Steam, Latent Heat (Table XL). 650 655 170 HANDBOOK OF THERMODYNAMIC CllEO ? ^^ 12 13 , 14 ?i ^^ ^-^ ^ ^ ^ ^-?- ri^ 190 200 210 6.0 . 7.0 8.0 9.0 1 1 1 1 ^^^ 1 ^ ^ ^ ^^? u r i Lower Scale = Temperature Degrees .FahrenheitUpper Scale=Pressure Lbs. Per Square Inch Absolute 820 900 1000 11521205 1200
RFGK40A5–Humidity icon on gray background with round shadow. Vector illustration.
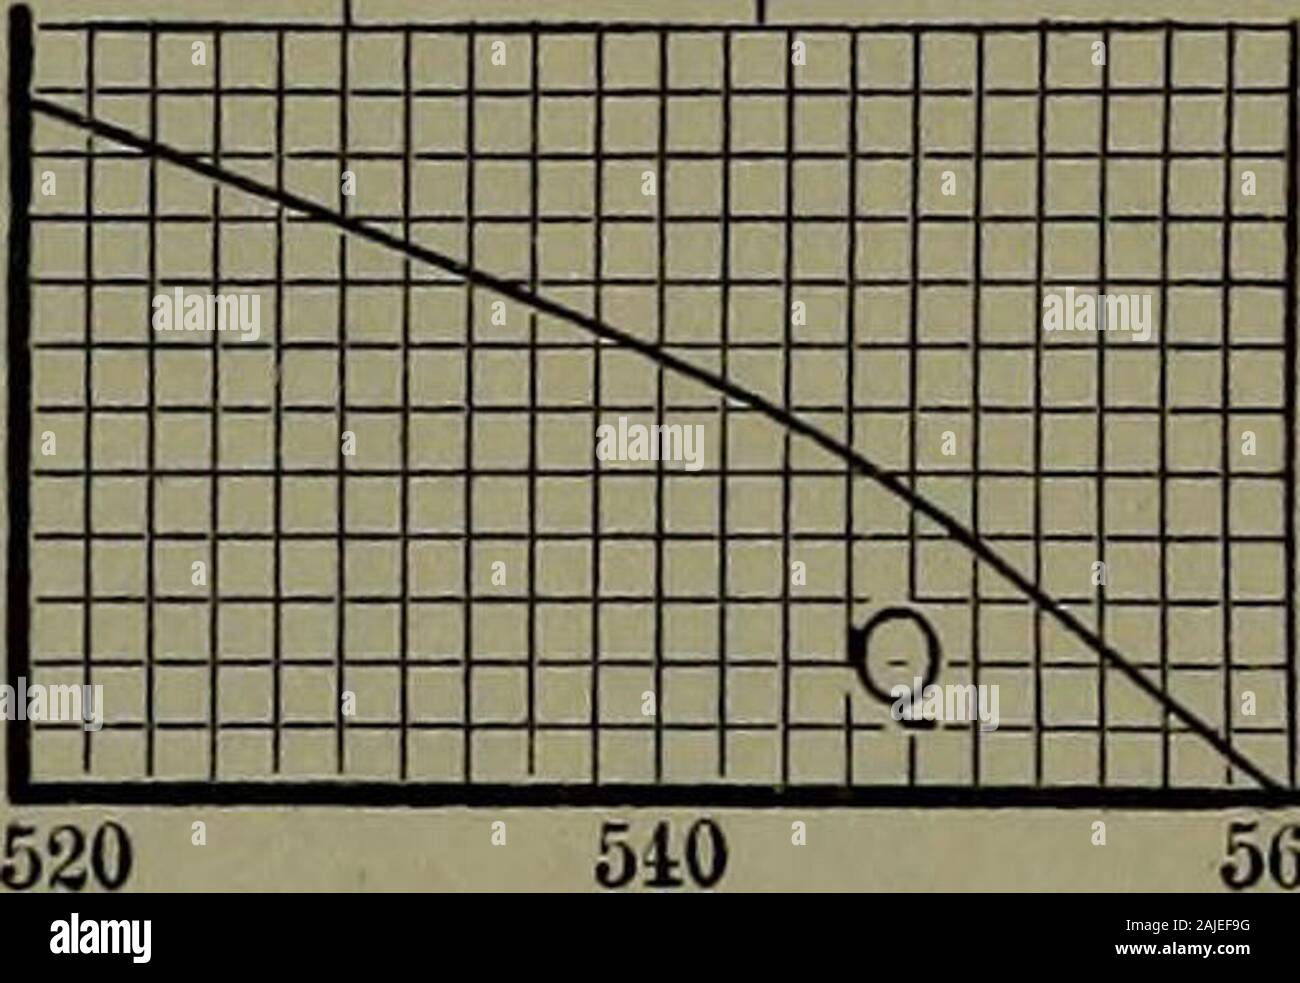 Handbook of thermodynamic tables and diagrams; a selection of tables and diagrams from Engineering thermodynamics . SO 40 50 55 280 290 300 305 455 465 475 480 630 610 Lower Scale = Temperature in Degrees F. Upper Scale = Pressure in IDs. per sq.in. aba. Chart 18.—Steam, Latent Heat (Table XL). 650 655 170 HANDBOOK OF THERMODYNAMIC CllEO ? ^^ 12 13 , 14 ?i ^^ ^-^ ^ ^ ^ ^-?- ri^ 190 200 210 6.0 . 7.0 8.0 9.0 1 1 1 1 ^^^ 1 ^ ^ ^ ^^? u r i Lower Scale = Temperature Degrees .FahrenheitUpper Scale=Pressure Lbs. Per Square Inch Absolute 820 900 1000 11521205 1200. 180 lUO.5.0 6.0 1130 1125 Stock Photohttps://www.alamy.com/image-license-details/?v=1https://www.alamy.com/handbook-of-thermodynamic-tables-and-diagrams-a-selection-of-tables-and-diagrams-from-engineering-thermodynamics-so-40-50-55-280-290-300-305-455-465-475-480-630-610-lower-scale-=-temperature-in-degrees-f-upper-scale-=-pressure-in-ids-per-sqin-aba-chart-18steam-latent-heat-table-xl-650-655-170-handbook-of-thermodynamic-clleo-12-13-14-i-ri-190-200-210-60-70-80-90-1-1-1-1-1-u-r-i-lower-scale-=-temperature-degrees-fahrenheitupper-scale=pressure-lbs-per-square-inch-absolute-820-900-1000-11521205-1200-180-luo50-60-1130-1125-image338380156.html
RM2AJEF9G–Handbook of thermodynamic tables and diagrams; a selection of tables and diagrams from Engineering thermodynamics . SO 40 50 55 280 290 300 305 455 465 475 480 630 610 Lower Scale = Temperature in Degrees F. Upper Scale = Pressure in IDs. per sq.in. aba. Chart 18.—Steam, Latent Heat (Table XL). 650 655 170 HANDBOOK OF THERMODYNAMIC CllEO ? ^^ 12 13 , 14 ?i ^^ ^-^ ^ ^ ^ ^-?- ri^ 190 200 210 6.0 . 7.0 8.0 9.0 1 1 1 1 ^^^ 1 ^ ^ ^ ^^? u r i Lower Scale = Temperature Degrees .FahrenheitUpper Scale=Pressure Lbs. Per Square Inch Absolute 820 900 1000 11521205 1200. 180 lUO.5.0 6.0 1130 1125
RFGJGPY5–Humidity icon. Thin circle design. Vector illustration.
RFH76791–Humidity icon. Orange background with black. Vector illustration.
 . Stoichiometry . tant pressure variesdirectly as the absolute temperature.^ and 100° at 760 mm. pressure is for the air or nitrogen thermometer, ooiS; forthe hydrogen thermometer, gooi°; for CO3, o*i43. The absolute scale of temperature, as derived from the air thermometer,agrees almost exactly with the thermodynamical scale, which is independent ofthe nature of the body considered. The hydrogen and helium thermom.eters show THE PROPERTIES OF GASES 17 The relation between volume and absolute temperature is showngraphically in Fig. 2. The straight lines of equal pressure, or isokirs, radiate f Stock Photohttps://www.alamy.com/image-license-details/?v=1https://www.alamy.com/stoichiometry-tant-pressure-variesdirectly-as-the-absolute-temperature-and-100-at-760-mm-pressure-is-for-the-air-or-nitrogen-thermometer-oois-forthe-hydrogen-thermometer-gooi-for-co3-oi43-the-absolute-scale-of-temperature-as-derived-from-the-air-thermometeragrees-almost-exactly-with-the-thermodynamical-scale-which-is-independent-ofthe-nature-of-the-body-considered-the-hydrogen-and-helium-thermometers-show-the-properties-of-gases-17-the-relation-between-volume-and-absolute-temperature-is-showngraphically-in-fig-2-the-straight-lines-of-equal-pressure-or-isokirs-radiate-f-image370120099.html
RM2CE4BXY–. Stoichiometry . tant pressure variesdirectly as the absolute temperature.^ and 100° at 760 mm. pressure is for the air or nitrogen thermometer, ooiS; forthe hydrogen thermometer, gooi°; for CO3, o*i43. The absolute scale of temperature, as derived from the air thermometer,agrees almost exactly with the thermodynamical scale, which is independent ofthe nature of the body considered. The hydrogen and helium thermom.eters show THE PROPERTIES OF GASES 17 The relation between volume and absolute temperature is showngraphically in Fig. 2. The straight lines of equal pressure, or isokirs, radiate f
 . The steam-engine and other heat-motors . ofthe indicator-card is given by m4^ of the entropy diagram. Second Method of Drawing the Constant-volume Curve.—Lett3s3 and t2s2, Fig. 121? represent two of any number of entropy-lines of steam at constant pressure. Let OT and OE be the absolute temperature and entropy axes.Prolong TO and lay off on the prolongation OF a scale of volumes.The scale must be so chosen that OV is at least equal to the volumeof one pound weight of steam at the lowest pressure. Since the ENTROPY. 221 diagram deals with one weight of steam only, it is convenient totake the Stock Photohttps://www.alamy.com/image-license-details/?v=1https://www.alamy.com/the-steam-engine-and-other-heat-motors-ofthe-indicator-card-is-given-by-m4-of-the-entropy-diagram-second-method-of-drawing-the-constant-volume-curvelett3s3-and-t2s2-fig-121-represent-two-of-any-number-of-entropy-lines-of-steam-at-constant-pressure-let-ot-and-oe-be-the-absolute-temperature-and-entropy-axesprolong-to-and-lay-off-on-the-prolongation-of-a-scale-of-volumesthe-scale-must-be-so-chosen-that-ov-is-at-least-equal-to-the-volumeof-one-pound-weight-of-steam-at-the-lowest-pressure-since-the-entropy-221-diagram-deals-with-one-weight-of-steam-only-it-is-convenient-totake-the-image369646246.html
RM2CDARFJ–. The steam-engine and other heat-motors . ofthe indicator-card is given by m4^ of the entropy diagram. Second Method of Drawing the Constant-volume Curve.—Lett3s3 and t2s2, Fig. 121? represent two of any number of entropy-lines of steam at constant pressure. Let OT and OE be the absolute temperature and entropy axes.Prolong TO and lay off on the prolongation OF a scale of volumes.The scale must be so chosen that OV is at least equal to the volumeof one pound weight of steam at the lowest pressure. Since the ENTROPY. 221 diagram deals with one weight of steam only, it is convenient totake the
 . A text book of physics, for the use of students of science and engineering . ed by a tube of fine bore to tubes BD and EC. whichmay be raised or lowered along a scale. This instrument constitutesan air thermometer. The bulb A is introduced into the spare in whichthe temperature has to be measured, and the sliding tubes areadjusted until the mercury level is restored to a fixed mark at B.The absolute pressure in the bulb is determined in the mannerexplained in Expt. .I. and the temperature is calculated from the XXXI AIR THERMOMETER 409 pressure. The instrument may be calibrated by immersing Stock Photohttps://www.alamy.com/image-license-details/?v=1https://www.alamy.com/a-text-book-of-physics-for-the-use-of-students-of-science-and-engineering-ed-by-a-tube-of-fine-bore-to-tubes-bd-and-ec-whichmay-be-raised-or-lowered-along-a-scale-this-instrument-constitutesan-air-thermometer-the-bulb-a-is-introduced-into-the-spare-in-whichthe-temperature-has-to-be-measured-and-the-sliding-tubes-areadjusted-until-the-mercury-level-is-restored-to-a-fixed-mark-at-bthe-absolute-pressure-in-the-bulb-is-determined-in-the-mannerexplained-in-expt-i-and-the-temperature-is-calculated-from-the-xxxi-air-thermometer-409-pressure-the-instrument-may-be-calibrated-by-immersing-image370059778.html
RM2CE1K0J–. A text book of physics, for the use of students of science and engineering . ed by a tube of fine bore to tubes BD and EC. whichmay be raised or lowered along a scale. This instrument constitutesan air thermometer. The bulb A is introduced into the spare in whichthe temperature has to be measured, and the sliding tubes areadjusted until the mercury level is restored to a fixed mark at B.The absolute pressure in the bulb is determined in the mannerexplained in Expt. .I. and the temperature is calculated from the XXXI AIR THERMOMETER 409 pressure. The instrument may be calibrated by immersing
 . The steam-engine and other heat-motors. the indicator-card is given by m±t of the entropy diagram. Second Method of Drawing the Constant-volume Curve.—Let/3s3 and £2*2; Fig. 121, represent two of any number of entropy-lines of steam at constant pressure. Let OT and OE be the absolute temperature and entropy axes.Prolong TO and lay off on the prolongation OF a scale of volumes.The scale must be so chosen that OF is at least equal to the volumeof one pound weight of steam at the lowest pressure. Since the ENTROPY. 221 diagram deals with one weight of steam only, it is convenient totake the vo Stock Photohttps://www.alamy.com/image-license-details/?v=1https://www.alamy.com/the-steam-engine-and-other-heat-motors-the-indicator-card-is-given-by-mt-of-the-entropy-diagram-second-method-of-drawing-the-constant-volume-curvelet3s3-and-22-fig-121-represent-two-of-any-number-of-entropy-lines-of-steam-at-constant-pressure-let-ot-and-oe-be-the-absolute-temperature-and-entropy-axesprolong-to-and-lay-off-on-the-prolongation-of-a-scale-of-volumesthe-scale-must-be-so-chosen-that-of-is-at-least-equal-to-the-volumeof-one-pound-weight-of-steam-at-the-lowest-pressure-since-the-entropy-221-diagram-deals-with-one-weight-of-steam-only-it-is-convenient-totake-the-vo-image370720873.html
RM2CF3P75–. The steam-engine and other heat-motors. the indicator-card is given by m±t of the entropy diagram. Second Method of Drawing the Constant-volume Curve.—Let/3s3 and £2*2; Fig. 121, represent two of any number of entropy-lines of steam at constant pressure. Let OT and OE be the absolute temperature and entropy axes.Prolong TO and lay off on the prolongation OF a scale of volumes.The scale must be so chosen that OF is at least equal to the volumeof one pound weight of steam at the lowest pressure. Since the ENTROPY. 221 diagram deals with one weight of steam only, it is convenient totake the vo
![. Nature . trumentsent up from that stationon that day has not beenfound. Distances measured ver-tically along the glasssides of the models repre-sent heights above sea-level on the scale of 5miles to 4 inches. Tlievertical scale of the modelis therefore twenty timesthe horizontal scale of th%map. The total height represented is 24 kilometres (15miles). The observations from each station are plotted on theedge? of the models. Isotherms (full lines) are drawn on NO. 2124, VOL. 84] the glass sides for every 5° C, the temperature being ex-pressed in absolute measure. The space between theisotherm Stock Photo . Nature . trumentsent up from that stationon that day has not beenfound. Distances measured ver-tically along the glasssides of the models repre-sent heights above sea-level on the scale of 5miles to 4 inches. Tlievertical scale of the modelis therefore twenty timesthe horizontal scale of th%map. The total height represented is 24 kilometres (15miles). The observations from each station are plotted on theedge? of the models. Isotherms (full lines) are drawn on NO. 2124, VOL. 84] the glass sides for every 5° C, the temperature being ex-pressed in absolute measure. The space between theisotherm Stock Photo](https://c8.alamy.com/comp/2CJ7F6X/nature-trumentsent-up-from-that-stationon-that-day-has-not-beenfound-distances-measured-ver-tically-along-the-glasssides-of-the-models-repre-sent-heights-above-sea-level-on-the-scale-of-5miles-to-4-inches-tlievertical-scale-of-the-modelis-therefore-twenty-timesthe-horizontal-scale-of-thmap-the-total-height-represented-is-24-kilometres-15miles-the-observations-from-each-station-are-plotted-on-theedge-of-the-models-isotherms-full-lines-are-drawn-on-no-2124-vol-84-the-glass-sides-for-every-5-c-the-temperature-being-ex-pressed-in-absolute-measure-the-space-between-theisotherm-2CJ7F6X.jpg) . Nature . trumentsent up from that stationon that day has not beenfound. Distances measured ver-tically along the glasssides of the models repre-sent heights above sea-level on the scale of 5miles to 4 inches. Tlievertical scale of the modelis therefore twenty timesthe horizontal scale of th%map. The total height represented is 24 kilometres (15miles). The observations from each station are plotted on theedge? of the models. Isotherms (full lines) are drawn on NO. 2124, VOL. 84] the glass sides for every 5° C, the temperature being ex-pressed in absolute measure. The space between theisotherm Stock Photohttps://www.alamy.com/image-license-details/?v=1https://www.alamy.com/nature-trumentsent-up-from-that-stationon-that-day-has-not-beenfound-distances-measured-ver-tically-along-the-glasssides-of-the-models-repre-sent-heights-above-sea-level-on-the-scale-of-5miles-to-4-inches-tlievertical-scale-of-the-modelis-therefore-twenty-timesthe-horizontal-scale-of-thmap-the-total-height-represented-is-24-kilometres-15miles-the-observations-from-each-station-are-plotted-on-theedge-of-the-models-isotherms-full-lines-are-drawn-on-no-2124-vol-84-the-glass-sides-for-every-5-c-the-temperature-being-ex-pressed-in-absolute-measure-the-space-between-theisotherm-image372647154.html
. Nature . trumentsent up from that stationon that day has not beenfound. Distances measured ver-tically along the glasssides of the models repre-sent heights above sea-level on the scale of 5miles to 4 inches. Tlievertical scale of the modelis therefore twenty timesthe horizontal scale of th%map. The total height represented is 24 kilometres (15miles). The observations from each station are plotted on theedge? of the models. Isotherms (full lines) are drawn on NO. 2124, VOL. 84] the glass sides for every 5° C, the temperature being ex-pressed in absolute measure. The space between theisotherm Stock Photohttps://www.alamy.com/image-license-details/?v=1https://www.alamy.com/nature-trumentsent-up-from-that-stationon-that-day-has-not-beenfound-distances-measured-ver-tically-along-the-glasssides-of-the-models-repre-sent-heights-above-sea-level-on-the-scale-of-5miles-to-4-inches-tlievertical-scale-of-the-modelis-therefore-twenty-timesthe-horizontal-scale-of-thmap-the-total-height-represented-is-24-kilometres-15miles-the-observations-from-each-station-are-plotted-on-theedge-of-the-models-isotherms-full-lines-are-drawn-on-no-2124-vol-84-the-glass-sides-for-every-5-c-the-temperature-being-ex-pressed-in-absolute-measure-the-space-between-theisotherm-image372647154.htmlRM2CJ7F6X–. Nature . trumentsent up from that stationon that day has not beenfound. Distances measured ver-tically along the glasssides of the models repre-sent heights above sea-level on the scale of 5miles to 4 inches. Tlievertical scale of the modelis therefore twenty timesthe horizontal scale of th%map. The total height represented is 24 kilometres (15miles). The observations from each station are plotted on theedge? of the models. Isotherms (full lines) are drawn on NO. 2124, VOL. 84] the glass sides for every 5° C, the temperature being ex-pressed in absolute measure. The space between theisotherm
 . A treatise on pharmacy for students and pharmacists. .15 of 1 per cent, for every degreeon the Fahrenheit scale. For example, if analcoholometer sinks in alcohol to 93° on the Tralles Alcoholometer withscale at 50° F. (10° C), the liquid contains really thermometer enclosed 58 GENERAL PHARMACY. 94.5 per cent, of absolute alcohol by volume, iustead of 93 as indi-cated on the scale, for the temperature is 10° Fahrenheit below thenormal, hence 10 X 0.15, or 1.5, must be added ; but if the tempera-ture had been 70° F. (21.11° C.) the true percentage of alcohol byvolume would have been only 91.5, Stock Photohttps://www.alamy.com/image-license-details/?v=1https://www.alamy.com/a-treatise-on-pharmacy-for-students-and-pharmacists-15-of-1-per-cent-for-every-degreeon-the-fahrenheit-scale-for-example-if-analcoholometer-sinks-in-alcohol-to-93-on-the-tralles-alcoholometer-withscale-at-50-f-10-c-the-liquid-contains-really-thermometer-enclosed-58-general-pharmacy-945-per-cent-of-absolute-alcohol-by-volume-iustead-of-93-as-indi-cated-on-the-scale-for-the-temperature-is-10-fahrenheit-below-thenormal-hence-10-x-015-or-15-must-be-added-but-if-the-tempera-ture-had-been-70-f-2111-c-the-true-percentage-of-alcohol-byvolume-would-have-been-only-915-image370305876.html
RM2CECTWT–. A treatise on pharmacy for students and pharmacists. .15 of 1 per cent, for every degreeon the Fahrenheit scale. For example, if analcoholometer sinks in alcohol to 93° on the Tralles Alcoholometer withscale at 50° F. (10° C), the liquid contains really thermometer enclosed 58 GENERAL PHARMACY. 94.5 per cent, of absolute alcohol by volume, iustead of 93 as indi-cated on the scale, for the temperature is 10° Fahrenheit below thenormal, hence 10 X 0.15, or 1.5, must be added ; but if the tempera-ture had been 70° F. (21.11° C.) the true percentage of alcohol byvolume would have been only 91.5,
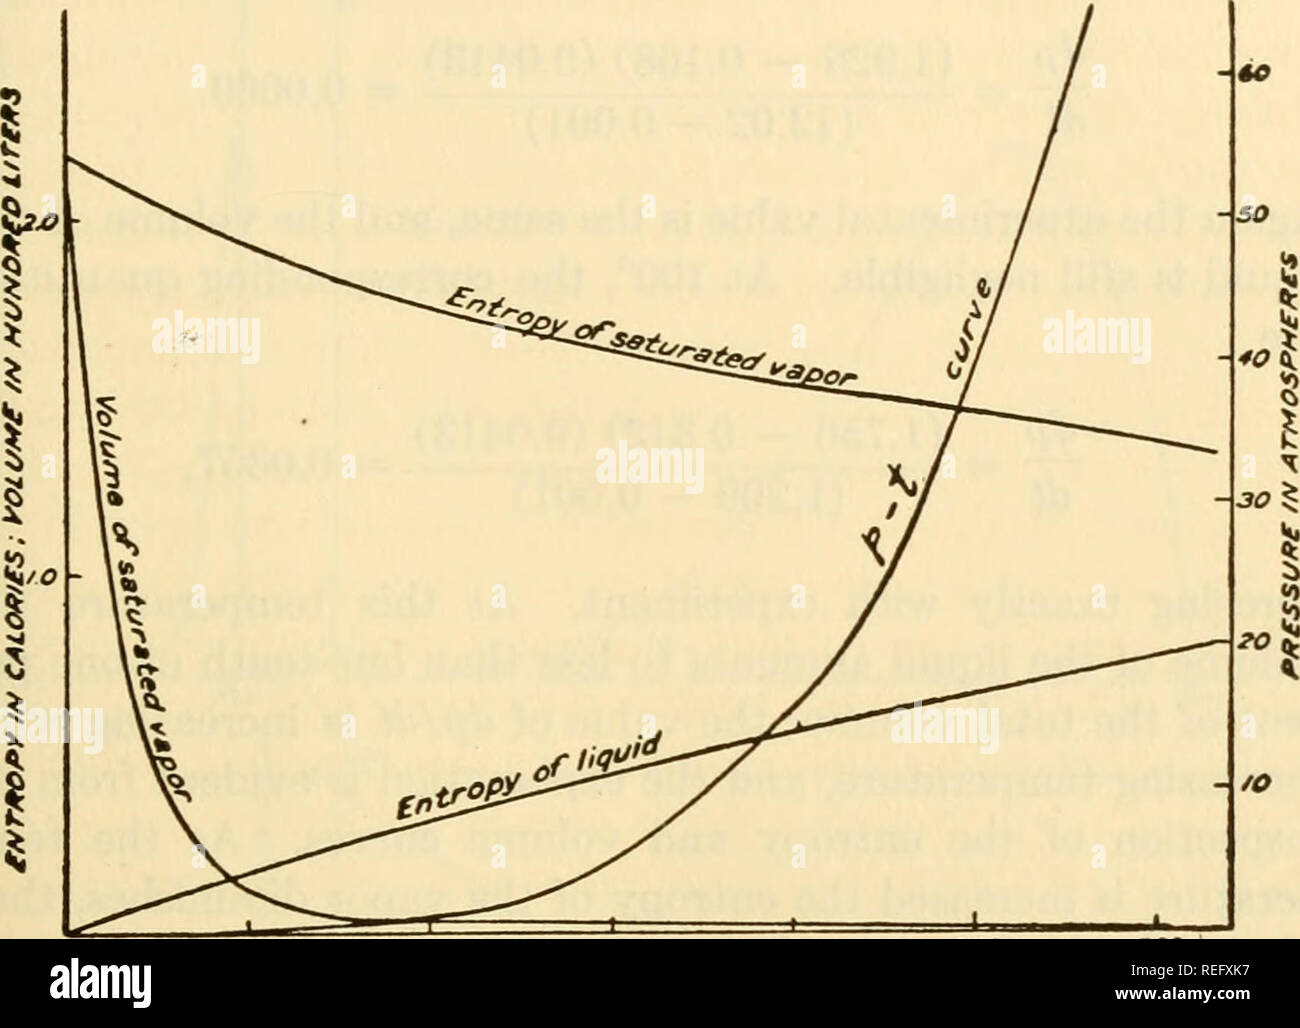 . A commentary on the scientific writings of J. Willard Gibbs. Gibbs, Joniah Willard, 1839-1908; Science; Thermodynamics. HETEROGENEOUS EQ UILIBRIUM 239 liquid at 0°C. is taken as zero or some other value. The entropy of the vapor is greater than that of the liquid by the entropy of vaporization, that is, the heat of vaporization divided by the absolute temperature. In the case of the volume, only the specific volume of the vapor is plotted, as that of the liquid is so small that it cannot be shown on the scale of the dia- gram. Let us now consider some actual values.. so /OO /so 200 T£Mf>e Stock Photohttps://www.alamy.com/image-license-details/?v=1https://www.alamy.com/a-commentary-on-the-scientific-writings-of-j-willard-gibbs-gibbs-joniah-willard-1839-1908-science-thermodynamics-heterogeneous-eq-uilibrium-239-liquid-at-0c-is-taken-as-zero-or-some-other-value-the-entropy-of-the-vapor-is-greater-than-that-of-the-liquid-by-the-entropy-of-vaporization-that-is-the-heat-of-vaporization-divided-by-the-absolute-temperature-in-the-case-of-the-volume-only-the-specific-volume-of-the-vapor-is-plotted-as-that-of-the-liquid-is-so-small-that-it-cannot-be-shown-on-the-scale-of-the-dia-gram-let-us-now-consider-some-actual-values-so-oo-so-200-tmfgte-image232690171.html
RMREFXK7–. A commentary on the scientific writings of J. Willard Gibbs. Gibbs, Joniah Willard, 1839-1908; Science; Thermodynamics. HETEROGENEOUS EQ UILIBRIUM 239 liquid at 0°C. is taken as zero or some other value. The entropy of the vapor is greater than that of the liquid by the entropy of vaporization, that is, the heat of vaporization divided by the absolute temperature. In the case of the volume, only the specific volume of the vapor is plotted, as that of the liquid is so small that it cannot be shown on the scale of the dia- gram. Let us now consider some actual values.. so /OO /so 200 T£Mf>e
 . Physical chemistry of vital phenomena, for students and investigators in the biological and medical sciences. Biochemistry; Chemistry, Physical and theoretical. 3o PHYSICAL CHEMISTRY. Fig. 6. Graph indicating the method of integrating the formula PV=RT (from MRR). ume in liters in which i mol solute is contained, R = 0.0821, and T is the absolute temperature, in which zero is — 273.090 on the centigrade scale (Fig. 6). Since the volume is the reciprocal of p the concentration, the formula becomes — = 0.0821 T, where c c is the molecular (molar) concentration. If the concentration is 1 and th Stock Photohttps://www.alamy.com/image-license-details/?v=1https://www.alamy.com/physical-chemistry-of-vital-phenomena-for-students-and-investigators-in-the-biological-and-medical-sciences-biochemistry-chemistry-physical-and-theoretical-3o-physical-chemistry-fig-6-graph-indicating-the-method-of-integrating-the-formula-pv=rt-from-mrr-ume-in-liters-in-which-i-mol-solute-is-contained-r-=-00821-and-t-is-the-absolute-temperature-in-which-zero-is-273090-on-the-centigrade-scale-fig-6-since-the-volume-is-the-reciprocal-of-p-the-concentration-the-formula-becomes-=-00821-t-where-c-c-is-the-molecular-molar-concentration-if-the-concentration-is-1-and-th-image232349716.html
RMRE0CC4–. Physical chemistry of vital phenomena, for students and investigators in the biological and medical sciences. Biochemistry; Chemistry, Physical and theoretical. 3o PHYSICAL CHEMISTRY. Fig. 6. Graph indicating the method of integrating the formula PV=RT (from MRR). ume in liters in which i mol solute is contained, R = 0.0821, and T is the absolute temperature, in which zero is — 273.090 on the centigrade scale (Fig. 6). Since the volume is the reciprocal of p the concentration, the formula becomes — = 0.0821 T, where c c is the molecular (molar) concentration. If the concentration is 1 and th
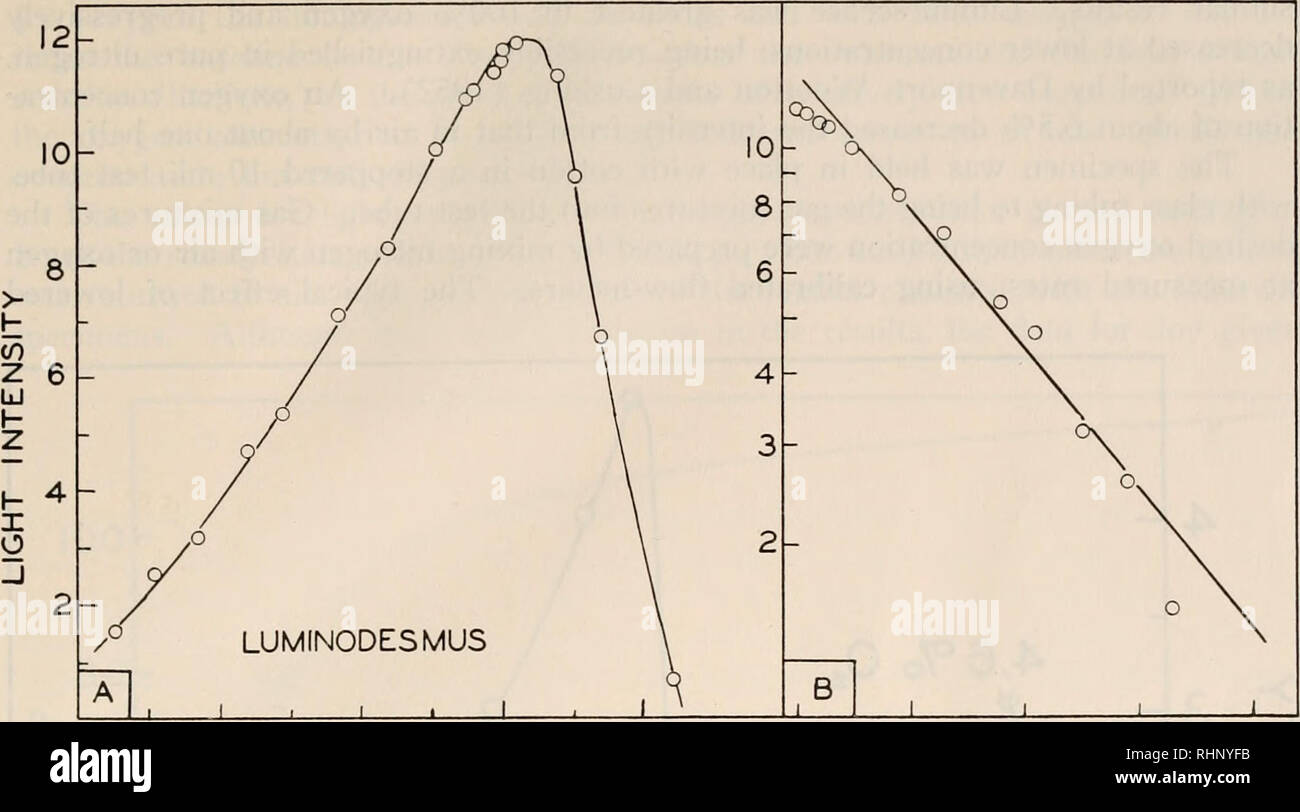 . The Biological bulletin. Biology; Zoology; Biology; Marine Biology. THE LUMINESCENCE OF LUMINODESMUS 123. 10 20 30 40 .0034 .0036 TEMPERATURE- °C. I/T-ABSOLUTE FIGURE 3. (A) Effect of temperature upon luminescence. Ordinate, light intensity in arbitrary units. See text for details. (B) Data of Figure 3A plotted according to the Arrhenius equation. Ordinate, light intensity in arbitrary units plotted on a log scale; abscissa, the reciprocal of absolute temperature. luminous bacteria, although the spectrum of bacterial emission may depend upon the density of the suspension (Harvey, 1952). 4. E Stock Photohttps://www.alamy.com/image-license-details/?v=1https://www.alamy.com/the-biological-bulletin-biology-zoology-biology-marine-biology-the-luminescence-of-luminodesmus-123-10-20-30-40-0034-0036-temperature-c-it-absolute-figure-3-a-effect-of-temperature-upon-luminescence-ordinate-light-intensity-in-arbitrary-units-see-text-for-details-b-data-of-figure-3a-plotted-according-to-the-arrhenius-equation-ordinate-light-intensity-in-arbitrary-units-plotted-on-a-log-scale-abscissa-the-reciprocal-of-absolute-temperature-luminous-bacteria-although-the-spectrum-of-bacterial-emission-may-depend-upon-the-density-of-the-suspension-harvey-1952-4-e-image234666527.html
RMRHNYFB–. The Biological bulletin. Biology; Zoology; Biology; Marine Biology. THE LUMINESCENCE OF LUMINODESMUS 123. 10 20 30 40 .0034 .0036 TEMPERATURE- °C. I/T-ABSOLUTE FIGURE 3. (A) Effect of temperature upon luminescence. Ordinate, light intensity in arbitrary units. See text for details. (B) Data of Figure 3A plotted according to the Arrhenius equation. Ordinate, light intensity in arbitrary units plotted on a log scale; abscissa, the reciprocal of absolute temperature. luminous bacteria, although the spectrum of bacterial emission may depend upon the density of the suspension (Harvey, 1952). 4. E
![. Compendium of meteorology. Meteorology. 7777777777777777, 50,000 //y//?/7/////////////*/ 1—IOKM-»! (a) t 40,000. Fig. 15.—Stationary waves in the free atmosphere on the lee side of mountains, (a) Streamlines across a mountain range with Moazagotl clouds on the lee side. (After Lyra [55].) (6) Cross section from Tatoosh Island, Wash., (PTA) to Minneapolis, Minn., (MP) for0300Z, January 14, 1945; isolines of potential temperature in degrees absolute. Vertical scale: units of pressure-altitude (ft) of U. S. standard atmosphere. (After Hess and Wagner [38].) During well-developed foehn currents, Stock Photo . Compendium of meteorology. Meteorology. 7777777777777777, 50,000 //y//?/7/////////////*/ 1—IOKM-»! (a) t 40,000. Fig. 15.—Stationary waves in the free atmosphere on the lee side of mountains, (a) Streamlines across a mountain range with Moazagotl clouds on the lee side. (After Lyra [55].) (6) Cross section from Tatoosh Island, Wash., (PTA) to Minneapolis, Minn., (MP) for0300Z, January 14, 1945; isolines of potential temperature in degrees absolute. Vertical scale: units of pressure-altitude (ft) of U. S. standard atmosphere. (After Hess and Wagner [38].) During well-developed foehn currents, Stock Photo](https://c8.alamy.com/comp/REDG6F/compendium-of-meteorology-meteorology-7777777777777777-50000-y7-1iokm-!-a-t-40000-fig-15stationary-waves-in-the-free-atmosphere-on-the-lee-side-of-mountains-a-streamlines-across-a-mountain-range-with-moazagotl-clouds-on-the-lee-side-after-lyra-55-6-cross-section-from-tatoosh-island-wash-pta-to-minneapolis-minn-mp-for0300z-january-14-1945-isolines-of-potential-temperature-in-degrees-absolute-vertical-scale-units-of-pressure-altitude-ft-of-u-s-standard-atmosphere-after-hess-and-wagner-38-during-well-developed-foehn-currents-REDG6F.jpg) . Compendium of meteorology. Meteorology. 7777777777777777, 50,000 //y//?/7/////////////*/ 1—IOKM-»! (a) t 40,000. Fig. 15.—Stationary waves in the free atmosphere on the lee side of mountains, (a) Streamlines across a mountain range with Moazagotl clouds on the lee side. (After Lyra [55].) (6) Cross section from Tatoosh Island, Wash., (PTA) to Minneapolis, Minn., (MP) for0300Z, January 14, 1945; isolines of potential temperature in degrees absolute. Vertical scale: units of pressure-altitude (ft) of U. S. standard atmosphere. (After Hess and Wagner [38].) During well-developed foehn currents, Stock Photohttps://www.alamy.com/image-license-details/?v=1https://www.alamy.com/compendium-of-meteorology-meteorology-7777777777777777-50000-y7-1iokm-!-a-t-40000-fig-15stationary-waves-in-the-free-atmosphere-on-the-lee-side-of-mountains-a-streamlines-across-a-mountain-range-with-moazagotl-clouds-on-the-lee-side-after-lyra-55-6-cross-section-from-tatoosh-island-wash-pta-to-minneapolis-minn-mp-for0300z-january-14-1945-isolines-of-potential-temperature-in-degrees-absolute-vertical-scale-units-of-pressure-altitude-ft-of-u-s-standard-atmosphere-after-hess-and-wagner-38-during-well-developed-foehn-currents-image232638071.html
. Compendium of meteorology. Meteorology. 7777777777777777, 50,000 //y//?/7/////////////*/ 1—IOKM-»! (a) t 40,000. Fig. 15.—Stationary waves in the free atmosphere on the lee side of mountains, (a) Streamlines across a mountain range with Moazagotl clouds on the lee side. (After Lyra [55].) (6) Cross section from Tatoosh Island, Wash., (PTA) to Minneapolis, Minn., (MP) for0300Z, January 14, 1945; isolines of potential temperature in degrees absolute. Vertical scale: units of pressure-altitude (ft) of U. S. standard atmosphere. (After Hess and Wagner [38].) During well-developed foehn currents, Stock Photohttps://www.alamy.com/image-license-details/?v=1https://www.alamy.com/compendium-of-meteorology-meteorology-7777777777777777-50000-y7-1iokm-!-a-t-40000-fig-15stationary-waves-in-the-free-atmosphere-on-the-lee-side-of-mountains-a-streamlines-across-a-mountain-range-with-moazagotl-clouds-on-the-lee-side-after-lyra-55-6-cross-section-from-tatoosh-island-wash-pta-to-minneapolis-minn-mp-for0300z-january-14-1945-isolines-of-potential-temperature-in-degrees-absolute-vertical-scale-units-of-pressure-altitude-ft-of-u-s-standard-atmosphere-after-hess-and-wagner-38-during-well-developed-foehn-currents-image232638071.htmlRMREDG6F–. Compendium of meteorology. Meteorology. 7777777777777777, 50,000 //y//?/7/////////////*/ 1—IOKM-»! (a) t 40,000. Fig. 15.—Stationary waves in the free atmosphere on the lee side of mountains, (a) Streamlines across a mountain range with Moazagotl clouds on the lee side. (After Lyra [55].) (6) Cross section from Tatoosh Island, Wash., (PTA) to Minneapolis, Minn., (MP) for0300Z, January 14, 1945; isolines of potential temperature in degrees absolute. Vertical scale: units of pressure-altitude (ft) of U. S. standard atmosphere. (After Hess and Wagner [38].) During well-developed foehn currents,