Absorption spectra for carbon Stock Photos and Images
(9)See absorption spectra for carbon stock video clipsAbsorption spectra for carbon Stock Photos and Images
 Absorption Spectra for Carbon Stock Photohttps://www.alamy.com/image-license-details/?v=1https://www.alamy.com/stock-photo-absorption-spectra-for-carbon-30129318.html
RMBN0E72–Absorption Spectra for Carbon
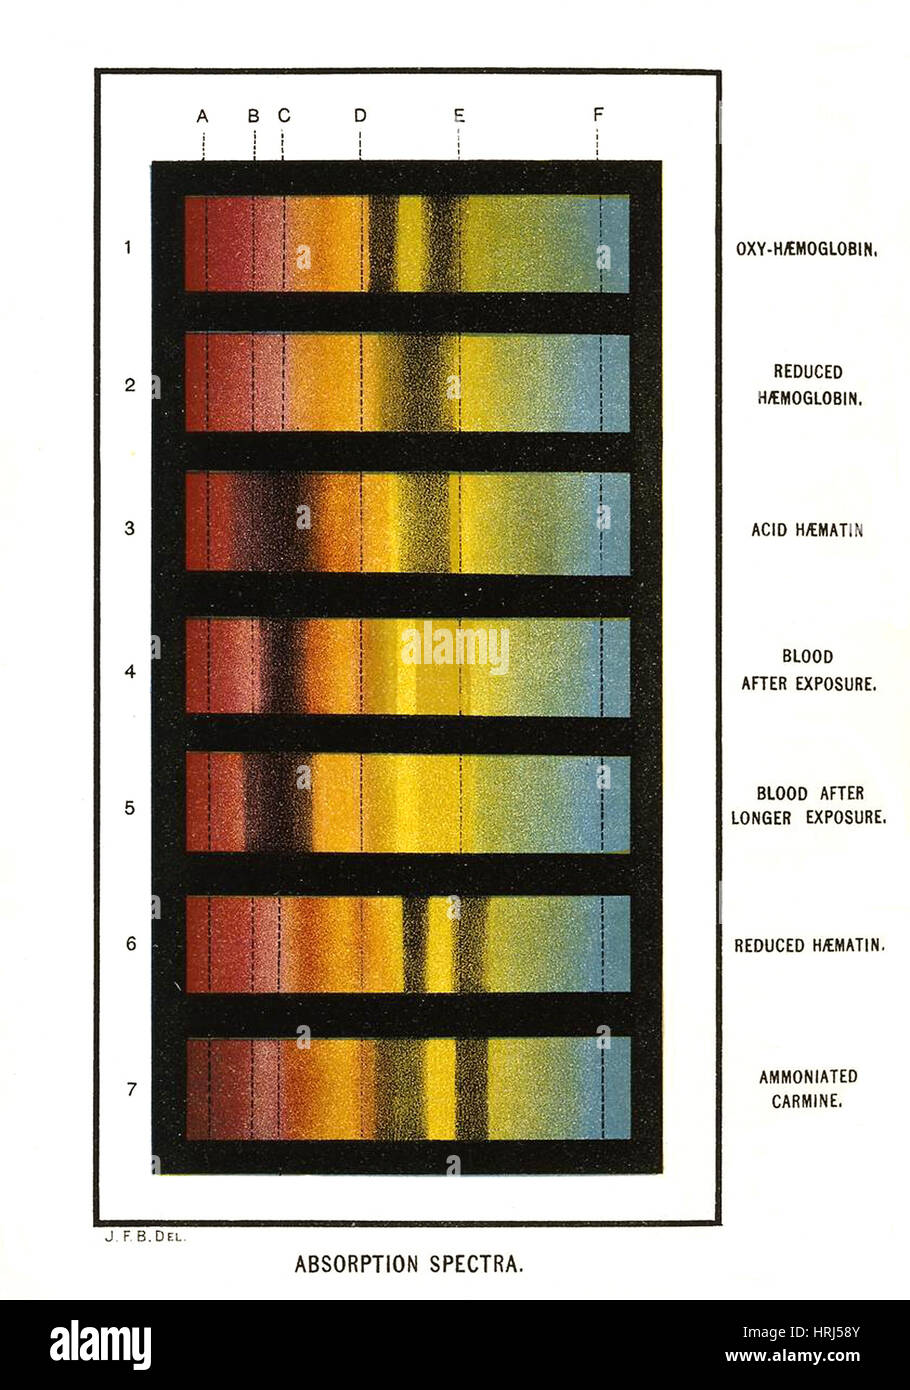
 Spectra Chart, Blood Samples, 1894 Stock Photohttps://www.alamy.com/image-license-details/?v=1https://www.alamy.com/stock-photo-spectra-chart-blood-samples-1894-135008971.html
RMHRJ58Y–Spectra Chart, Blood Samples, 1894
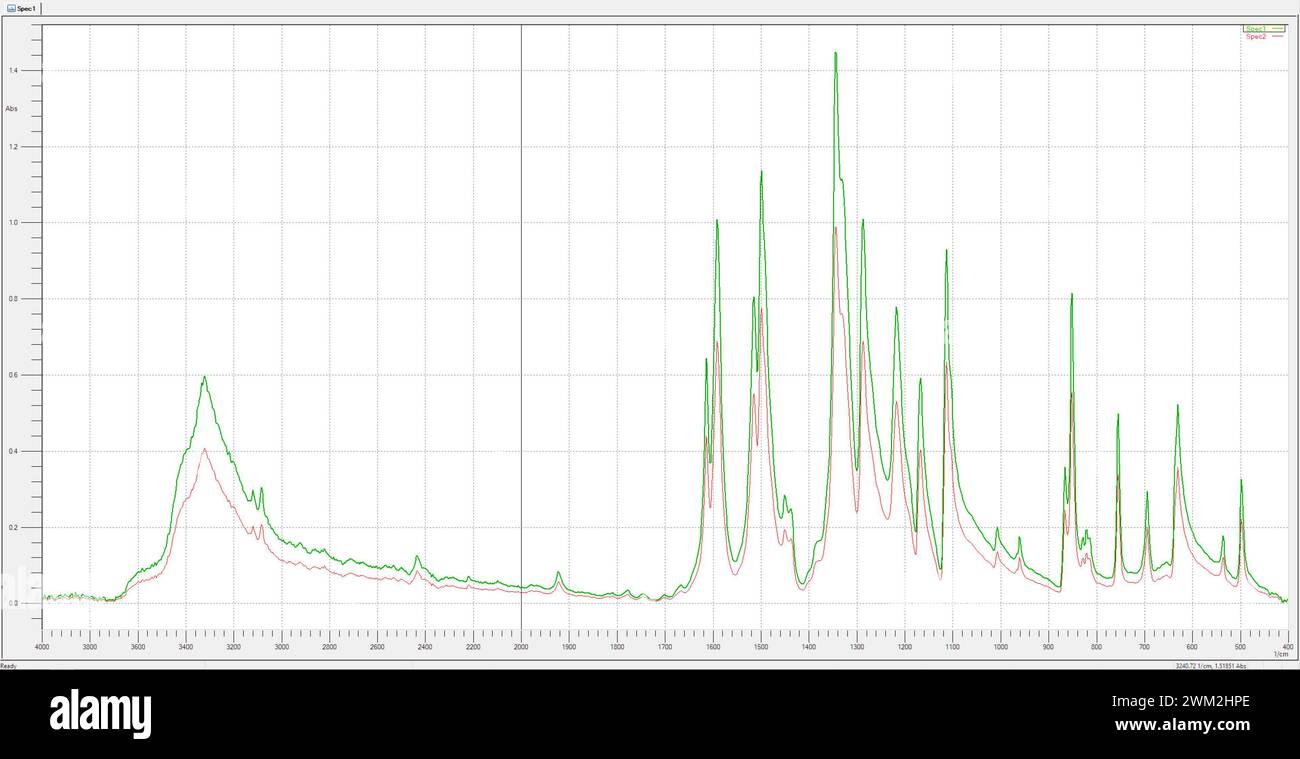
 red and green overlayed absorbance infrared spectrum graph of two spectra Stock Photohttps://www.alamy.com/image-license-details/?v=1https://www.alamy.com/red-and-green-overlayed-absorbance-infrared-spectrum-graph-of-two-spectra-image597503494.html
RM2WM2HPE–red and green overlayed absorbance infrared spectrum graph of two spectra
 . Carotenoids, their comparative biochemistry. Carotenoids. CAROTENOIDS Me Me Me. ? Brown Chromoprotein The difference in physical properties between astaxanthin and astacin are noted below. Absorption m.p. spectra maximum Carbon disulphide Astaxanthin .. 215-216°'« 502 my..^'''^ 240-243'^^' Astacin 500 my.. 5 a It must be remembered that astaxanthin, once considered a specific •crustacean carotenoid, has recently been detected in plants {see p. 135) and insects (see p. 221). Formation It is now generally accepted that synthesis of carotenoids de novo by arthropods (or, for that matter, by any Stock Photohttps://www.alamy.com/image-license-details/?v=1https://www.alamy.com/carotenoids-their-comparative-biochemistry-carotenoids-carotenoids-me-me-me-brown-chromoprotein-the-difference-in-physical-properties-between-astaxanthin-and-astacin-are-noted-below-absorption-mp-spectra-maximum-carbon-disulphide-astaxanthin-215-216-502-my-240-243-astacin-500-my-5-a-it-must-be-remembered-that-astaxanthin-once-considered-a-specific-crustacean-carotenoid-has-recently-been-detected-in-plants-see-p-135-and-insects-see-p-221-formation-it-is-now-generally-accepted-that-synthesis-of-carotenoids-de-novo-by-arthropods-or-for-that-matter-by-any-image233459881.html
RMRFR0CW–. Carotenoids, their comparative biochemistry. Carotenoids. CAROTENOIDS Me Me Me. ? Brown Chromoprotein The difference in physical properties between astaxanthin and astacin are noted below. Absorption m.p. spectra maximum Carbon disulphide Astaxanthin .. 215-216°'« 502 my..^'''^ 240-243'^^' Astacin 500 my.. 5 a It must be remembered that astaxanthin, once considered a specific •crustacean carotenoid, has recently been detected in plants {see p. 135) and insects (see p. 221). Formation It is now generally accepted that synthesis of carotenoids de novo by arthropods (or, for that matter, by any
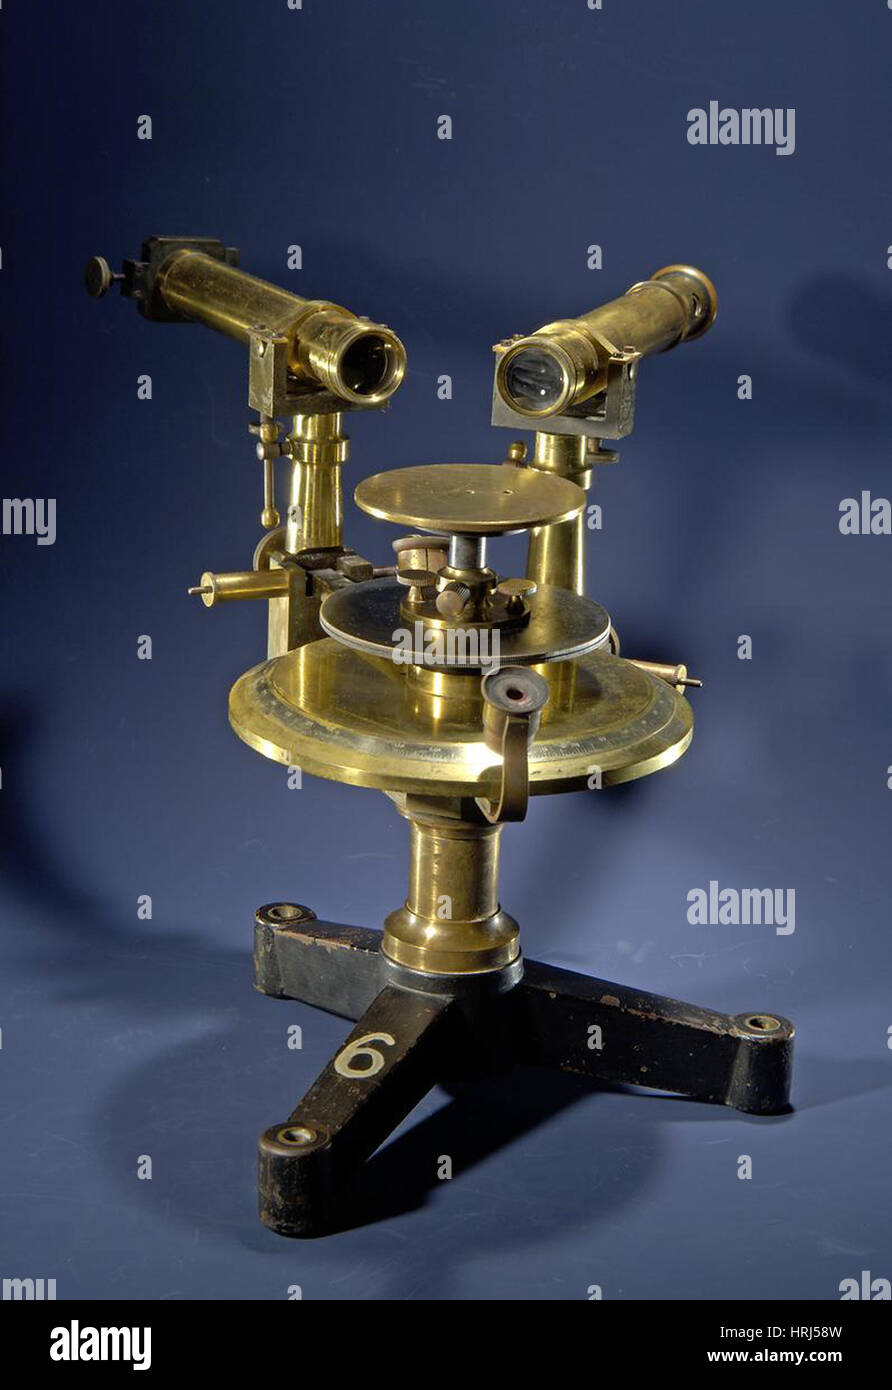
 Spectroscope, Circa 1920 Stock Photohttps://www.alamy.com/image-license-details/?v=1https://www.alamy.com/stock-photo-spectroscope-circa-1920-135008969.html
RMHRJ58W–Spectroscope, Circa 1920
 . Carnegie Institution of Washington publication. 76 INFRA-RED ABSORPTION SPECTRA. Still be present, a film was made by melting solid asphaltum on rock salt. The whole seemed of interest in connection with the absorption and anomalous dispersion of asphaltum investigated by Nichols^ in the optical region. The curves show several marked bands. As is to be expected, the bands are found in the petroleum distillates. Class II: Carbocycuc Compounds. In this class the carbon atoms are joined in a closed chain or ring. To it belong the methylene hydrocarbons of the petroleum distillates, already disc Stock Photohttps://www.alamy.com/image-license-details/?v=1https://www.alamy.com/carnegie-institution-of-washington-publication-76-infra-red-absorption-spectra-still-be-present-a-film-was-made-by-melting-solid-asphaltum-on-rock-salt-the-whole-seemed-of-interest-in-connection-with-the-absorption-and-anomalous-dispersion-of-asphaltum-investigated-by-nichols-in-the-optical-region-the-curves-show-several-marked-bands-as-is-to-be-expected-the-bands-are-found-in-the-petroleum-distillates-class-ii-carbocycuc-compounds-in-this-class-the-carbon-atoms-are-joined-in-a-closed-chain-or-ring-to-it-belong-the-methylene-hydrocarbons-of-the-petroleum-distillates-already-disc-image233512619.html
RMRFWBMB–. Carnegie Institution of Washington publication. 76 INFRA-RED ABSORPTION SPECTRA. Still be present, a film was made by melting solid asphaltum on rock salt. The whole seemed of interest in connection with the absorption and anomalous dispersion of asphaltum investigated by Nichols^ in the optical region. The curves show several marked bands. As is to be expected, the bands are found in the petroleum distillates. Class II: Carbocycuc Compounds. In this class the carbon atoms are joined in a closed chain or ring. To it belong the methylene hydrocarbons of the petroleum distillates, already disc
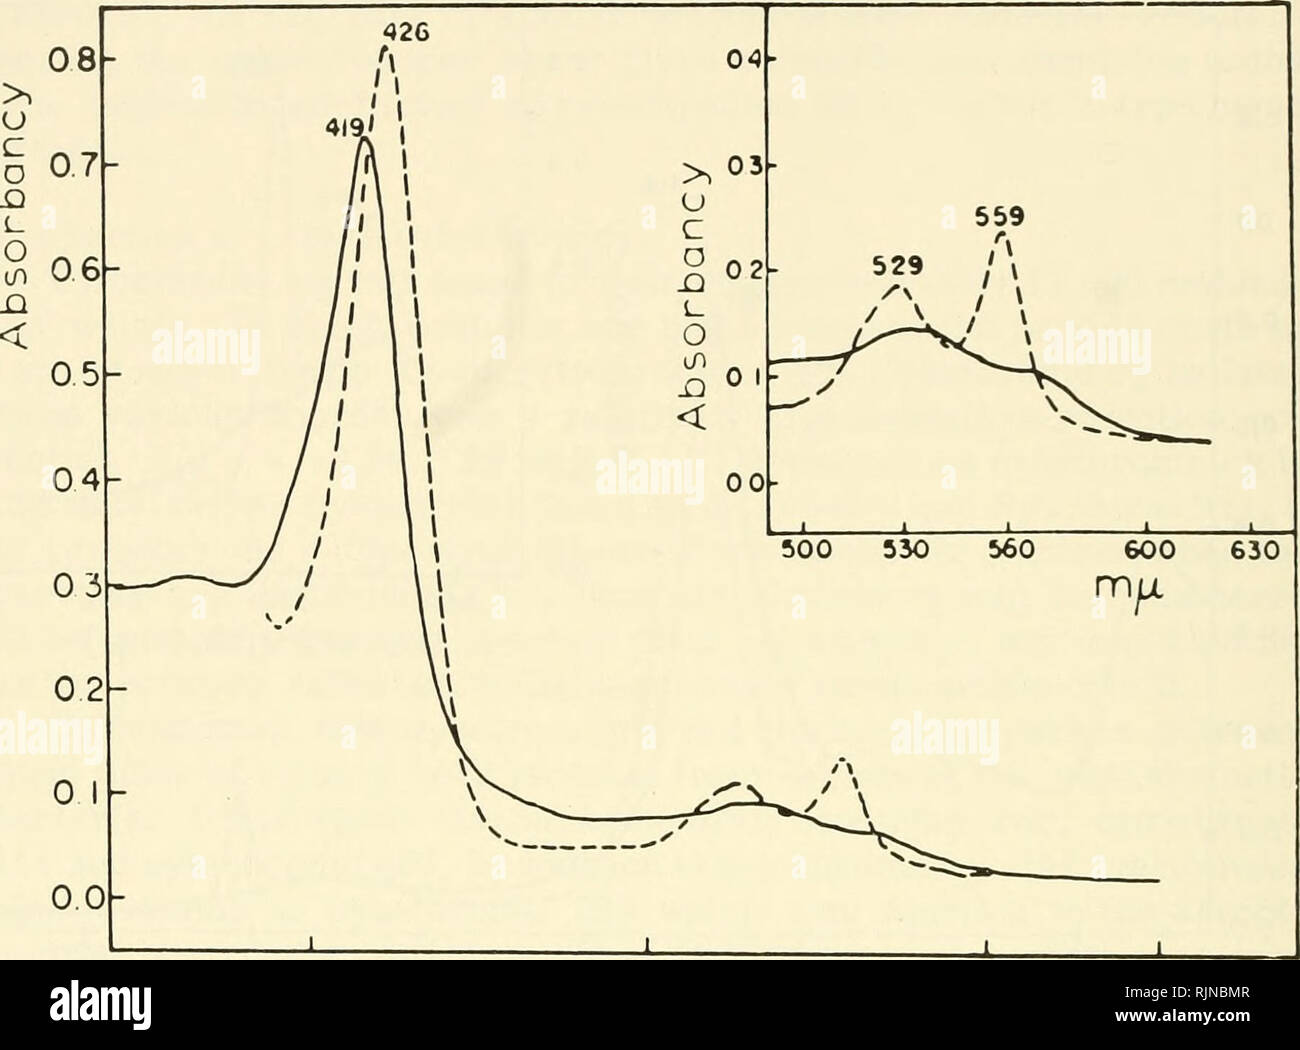
 . Bacterial photosynthesis. Bacteria -- Physiology; Photosynthesis. 492 APPENDIX. 400 500 600 650 Wavelength (mu Fig. 8. Rps. spheroides cytochrome b ferro- and ferri-, absolute spectra (concentration and pH of cytochrome not stated) (6). Re- produced by permission of Biochimica et Biophysica Acta. entity, best detectable from the action spectrum of the relief of carbon monoxide inhibition of oxygen uptake by intact bacterial cells (21). Taylor and Horio concluded from the close similarity between such an action spectrum determined with R. rubriim and the absorption spec- trum of R. rubrum CO- Stock Photohttps://www.alamy.com/image-license-details/?v=1https://www.alamy.com/bacterial-photosynthesis-bacteria-physiology-photosynthesis-492-appendix-400-500-600-650-wavelength-mu-fig-8-rps-spheroides-cytochrome-b-ferro-and-ferri-absolute-spectra-concentration-and-ph-of-cytochrome-not-stated-6-re-produced-by-permission-of-biochimica-et-biophysica-acta-entity-best-detectable-from-the-action-spectrum-of-the-relief-of-carbon-monoxide-inhibition-of-oxygen-uptake-by-intact-bacterial-cells-21-taylor-and-horio-concluded-from-the-close-similarity-between-such-an-action-spectrum-determined-with-r-rubriim-and-the-absorption-spec-trum-of-r-rubrum-co-image235268791.html
RMRJNBMR–. Bacterial photosynthesis. Bacteria -- Physiology; Photosynthesis. 492 APPENDIX. 400 500 600 650 Wavelength (mu Fig. 8. Rps. spheroides cytochrome b ferro- and ferri-, absolute spectra (concentration and pH of cytochrome not stated) (6). Re- produced by permission of Biochimica et Biophysica Acta. entity, best detectable from the action spectrum of the relief of carbon monoxide inhibition of oxygen uptake by intact bacterial cells (21). Taylor and Horio concluded from the close similarity between such an action spectrum determined with R. rubriim and the absorption spec- trum of R. rubrum CO-
 . Carnegie Institution of Washington publication. EMISSION SPECTRUM OF BURNING CARBON BISULPHIDE;. 119 coincidence of the emission and absorption bands led the writer to undertake the present work. A previous examination of the absorption spectra of gases showed very marked bands in SO, which were in quite close coincidence with the emission lines of the products of combustion of carbon disulphid, as given by Julius. The absorption spectrum1 of CS2 has a very large absorption band at 6.8^ (opacity from 6.6 to 7.0/11) and smaller bands 80 cm 70 60 <n c o °4j « * Q 30 20 10. 5 6 7 Q FIG. 91.— Stock Photohttps://www.alamy.com/image-license-details/?v=1https://www.alamy.com/carnegie-institution-of-washington-publication-emission-spectrum-of-burning-carbon-bisulphide-119-coincidence-of-the-emission-and-absorption-bands-led-the-writer-to-undertake-the-present-work-a-previous-examination-of-the-absorption-spectra-of-gases-showed-very-marked-bands-in-so-which-were-in-quite-close-coincidence-with-the-emission-lines-of-the-products-of-combustion-of-carbon-disulphid-as-given-by-julius-the-absorption-spectrum1-of-cs2-has-a-very-large-absorption-band-at-68-opacity-from-66-to-7011-and-smaller-bands-80-cm-70-60-ltn-c-o-4j-q-30-20-10-5-6-7-q-fig-91-image233461334.html
RMRFR28P–. Carnegie Institution of Washington publication. EMISSION SPECTRUM OF BURNING CARBON BISULPHIDE;. 119 coincidence of the emission and absorption bands led the writer to undertake the present work. A previous examination of the absorption spectra of gases showed very marked bands in SO, which were in quite close coincidence with the emission lines of the products of combustion of carbon disulphid, as given by Julius. The absorption spectrum1 of CS2 has a very large absorption band at 6.8^ (opacity from 6.6 to 7.0/11) and smaller bands 80 cm 70 60 <n c o °4j « * Q 30 20 10. 5 6 7 Q FIG. 91.—
 . The Biological bulletin. Biology; Zoology; Biology; Marine Biology. a Oxy â Deoxy ââ 1 ⢠1 â 1â 380 400 420 440 v /-. I â 1 ' 1 I 1 â I 1â 520 540 560 580 600 620 Wavelength (nm) Figure 1. In vivo absorption spectra for metacercaria hemoglobin in oxygenated and deoxygenated states. measured pH values due to rapid loss of carbon dioxide will be toward more basic pH's. High Performance Liquid Chromatography (HPLC) gel filtration using a LDC Milton Roy CCM HPLC Au- tomation system was performed on metacercaria hemo- globin, host HMW hemoglobin, and host coelomic cell hemoglobin samples to comp Stock Photohttps://www.alamy.com/image-license-details/?v=1https://www.alamy.com/the-biological-bulletin-biology-zoology-biology-marine-biology-a-oxy-deoxy-1-1-1-380-400-420-440-v-i-1-1-i-1-i-1-520-540-560-580-600-620-wavelength-nm-figure-1-in-vivo-absorption-spectra-for-metacercaria-hemoglobin-in-oxygenated-and-deoxygenated-states-measured-ph-values-due-to-rapid-loss-of-carbon-dioxide-will-be-toward-more-basic-phs-high-performance-liquid-chromatography-hplc-gel-filtration-using-a-ldc-milton-roy-ccm-hplc-au-tomation-system-was-performed-on-metacercaria-hemo-globin-host-hmw-hemoglobin-and-host-coelomic-cell-hemoglobin-samples-to-comp-image234646222.html
RMRHN1J6–. The Biological bulletin. Biology; Zoology; Biology; Marine Biology. a Oxy â Deoxy ââ 1 ⢠1 â 1â 380 400 420 440 v /-. I â 1 ' 1 I 1 â I 1â 520 540 560 580 600 620 Wavelength (nm) Figure 1. In vivo absorption spectra for metacercaria hemoglobin in oxygenated and deoxygenated states. measured pH values due to rapid loss of carbon dioxide will be toward more basic pH's. High Performance Liquid Chromatography (HPLC) gel filtration using a LDC Milton Roy CCM HPLC Au- tomation system was performed on metacercaria hemo- globin, host HMW hemoglobin, and host coelomic cell hemoglobin samples to comp