Quick filters:
Barred sand bass Stock Photos and Images
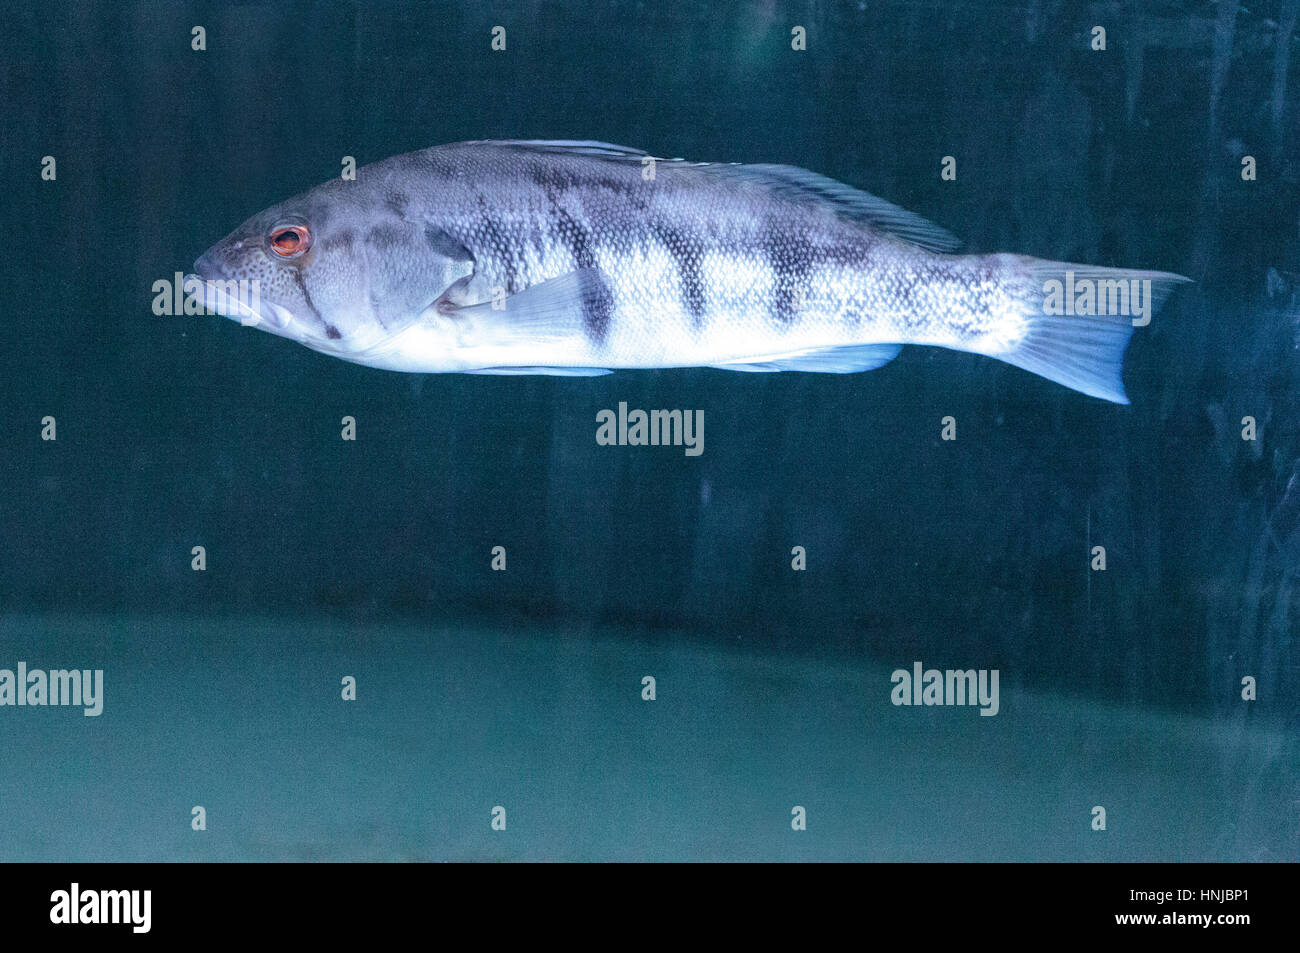 Barred sand bass Paralabrax nebulifer is found in the Pacific Ocean off the coast of California Stock Photohttps://www.alamy.com/image-license-details/?v=1https://www.alamy.com/stock-photo-barred-sand-bass-paralabrax-nebulifer-is-found-in-the-pacific-ocean-133784729.html
RFHNJBP1–Barred sand bass Paralabrax nebulifer is found in the Pacific Ocean off the coast of California
 Drawing sketch style illustration of a Barred sand bass fish native to Gulf of California side view black and white on isolated white background. Stock Photohttps://www.alamy.com/image-license-details/?v=1https://www.alamy.com/drawing-sketch-style-illustration-of-a-barred-sand-bass-fish-native-to-gulf-of-california-side-view-black-and-white-on-isolated-white-background-image561432983.html
RF2RHBDDY–Drawing sketch style illustration of a Barred sand bass fish native to Gulf of California side view black and white on isolated white background.
 Sea brass isolated common fish of family Serranidae. Vector barred sand bass, potato cod, redbanded perch hand drawn seafood, marine underwater aquati Stock Vectorhttps://www.alamy.com/image-license-details/?v=1https://www.alamy.com/sea-brass-isolated-common-fish-of-family-serranidae-vector-barred-sand-bass-potato-cod-redbanded-perch-hand-drawn-seafood-marine-underwater-aquati-image413086585.html
RF2F01M49–Sea brass isolated common fish of family Serranidae. Vector barred sand bass, potato cod, redbanded perch hand drawn seafood, marine underwater aquati
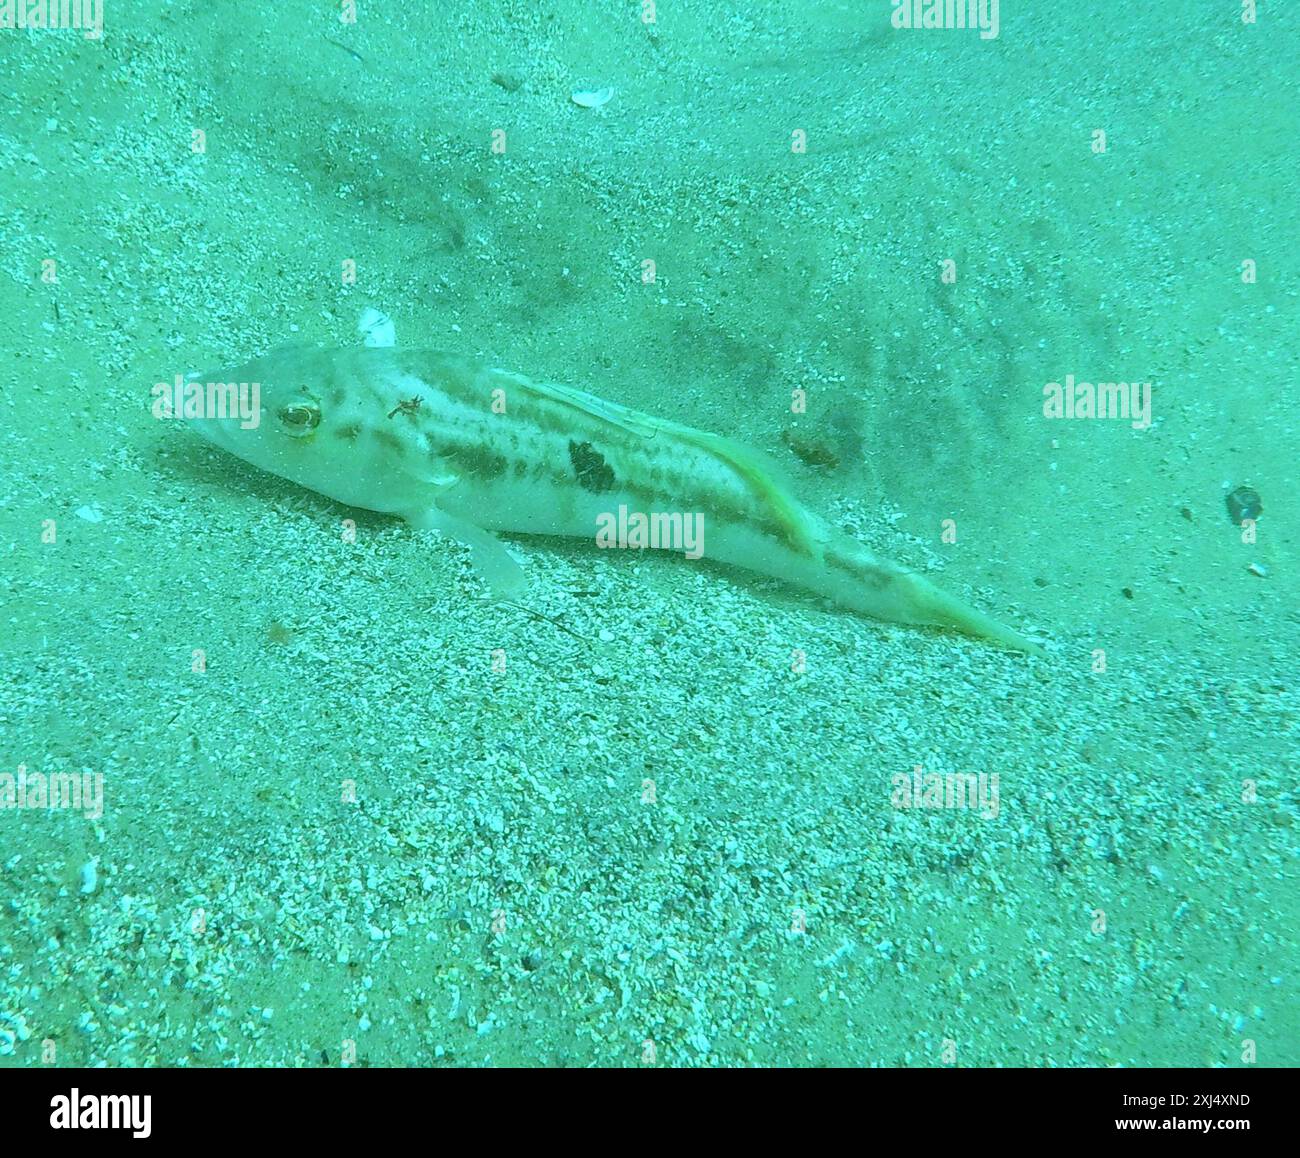 Barred Sand Bass (Paralabrax nebulifer) Actinopterygii Stock Photohttps://www.alamy.com/image-license-details/?v=1https://www.alamy.com/barred-sand-bass-paralabrax-nebulifer-actinopterygii-image613535481.html
RM2XJ4XND–Barred Sand Bass (Paralabrax nebulifer) Actinopterygii
 . Bulletin. Science. 104 SOUTHERN CALIFORNIA ACADEMY OF SCIENCES 31°47'—. 31°43' 116°48' I Fig. 1. Beam-trawl and otter trawl sampling sites for kelp bass and barred sand bass collections in the Punta Banda estuary (1992-93). can imply a possible competition for food (Turner et al. 1969). Therefore, resource partitioning is an important issue in understanding the structure and dynamics of species with similar habits and morphology (Hyslop 1980, Cabral 2000). This study describes and compares the feeding habits of kelp bass and barred sand bass in the Punta Banda estuary, and considers the seas Stock Photohttps://www.alamy.com/image-license-details/?v=1https://www.alamy.com/bulletin-science-104-southern-california-academy-of-sciences-3147-3143-11648-i-fig-1-beam-trawl-and-otter-trawl-sampling-sites-for-kelp-bass-and-barred-sand-bass-collections-in-the-punta-banda-estuary-1992-93-can-imply-a-possible-competition-for-food-turner-et-al-1969-therefore-resource-partitioning-is-an-important-issue-in-understanding-the-structure-and-dynamics-of-species-with-similar-habits-and-morphology-hyslop-1980-cabral-2000-this-study-describes-and-compares-the-feeding-habits-of-kelp-bass-and-barred-sand-bass-in-the-punta-banda-estuary-and-considers-the-seas-image234188420.html
RMRH05M4–. Bulletin. Science. 104 SOUTHERN CALIFORNIA ACADEMY OF SCIENCES 31°47'—. 31°43' 116°48' I Fig. 1. Beam-trawl and otter trawl sampling sites for kelp bass and barred sand bass collections in the Punta Banda estuary (1992-93). can imply a possible competition for food (Turner et al. 1969). Therefore, resource partitioning is an important issue in understanding the structure and dynamics of species with similar habits and morphology (Hyslop 1980, Cabral 2000). This study describes and compares the feeding habits of kelp bass and barred sand bass in the Punta Banda estuary, and considers the seas
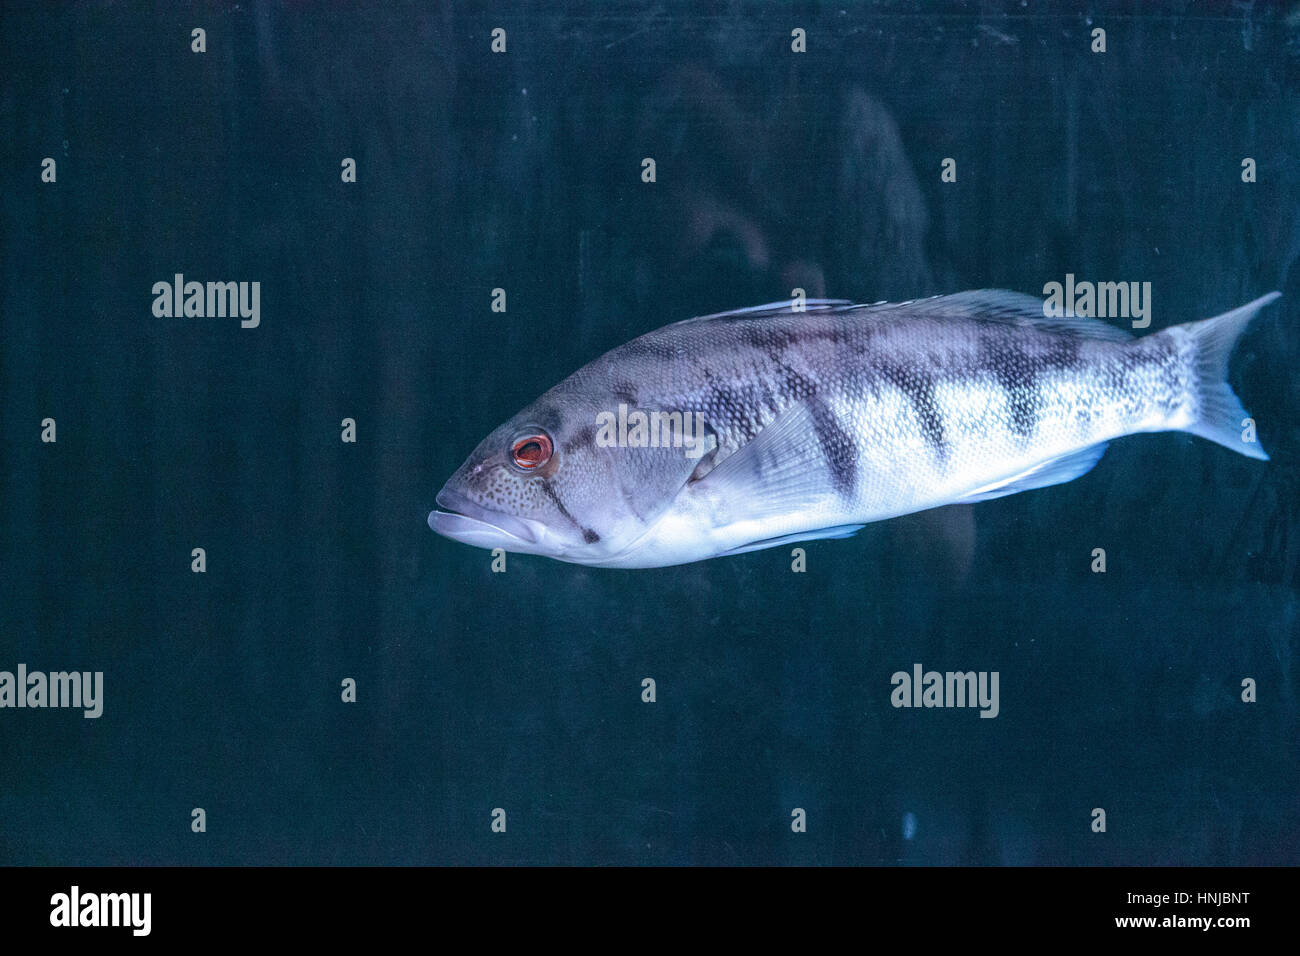 Barred sand bass Paralabrax nebulifer is found in the Pacific Ocean off the coast of California Stock Photohttps://www.alamy.com/image-license-details/?v=1https://www.alamy.com/stock-photo-barred-sand-bass-paralabrax-nebulifer-is-found-in-the-pacific-ocean-133784724.html
RFHNJBNT–Barred sand bass Paralabrax nebulifer is found in the Pacific Ocean off the coast of California
 Sea brass isolated common fish of family Serranidae. Vector barred sand bass, potato cod, redbanded perch hand drawn seafood, marine underwater aquati Stock Vectorhttps://www.alamy.com/image-license-details/?v=1https://www.alamy.com/sea-brass-isolated-common-fish-of-family-serranidae-vector-barred-sand-bass-potato-cod-redbanded-perch-hand-drawn-seafood-marine-underwater-aquati-image412930486.html
RF2EYPH1A–Sea brass isolated common fish of family Serranidae. Vector barred sand bass, potato cod, redbanded perch hand drawn seafood, marine underwater aquati
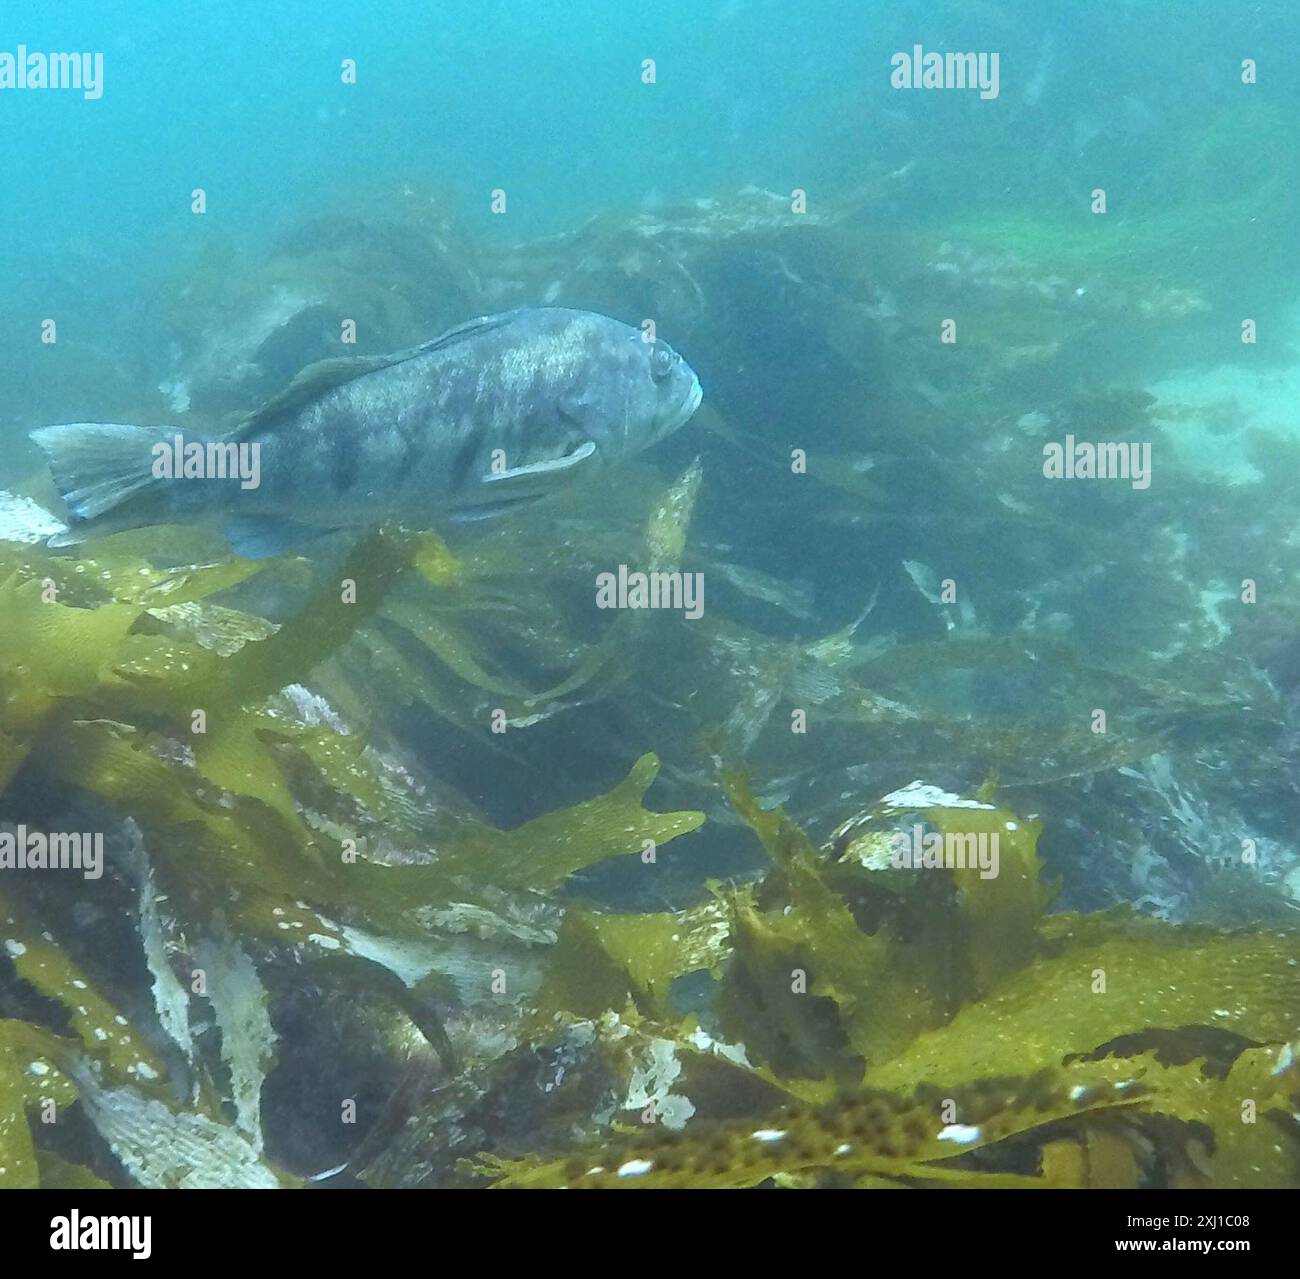 Barred Sand Bass (Paralabrax nebulifer) Actinopterygii Stock Photohttps://www.alamy.com/image-license-details/?v=1https://www.alamy.com/barred-sand-bass-paralabrax-nebulifer-actinopterygii-image613458056.html
RM2XJ1C08–Barred Sand Bass (Paralabrax nebulifer) Actinopterygii
 Barred sand bass isolated sea fish, potato cod sketch. Vector redbanded perch hand drawn seafood, marine underwater aquatic animal. Barred sand bass, potato cod Serranus cabrilla, Caprodon fish Stock Vectorhttps://www.alamy.com/image-license-details/?v=1https://www.alamy.com/barred-sand-bass-isolated-sea-fish-potato-cod-sketch-vector-redbanded-perch-hand-drawn-seafood-marine-underwater-aquatic-animal-barred-sand-bass-potato-cod-serranus-cabrilla-caprodon-fish-image478535296.html
RF2JPF4J8–Barred sand bass isolated sea fish, potato cod sketch. Vector redbanded perch hand drawn seafood, marine underwater aquatic animal. Barred sand bass, potato cod Serranus cabrilla, Caprodon fish
 . Bulletin. Science. 106 SOUTHERN CALIFORNIA ACADEMY OF SCIENCES. 0 40 60 80 100 120 140 160 180 210 230 250 Standard length (mm) Fig. 2. Length-frequency distribution of kelp bass â¡ and barred sand bass â during summer and winter from Punta Banda estuary. Diet overlap was calculated using the simplified Morisita's index (Krebs 1989, Hall et al. 1990): Câ 2 2 P,. Please note that these images are extracted from scanned page images that may have been digitally enhanced for readability - coloration and appearance of these illustrations may not perfectly resemble the original work.. Southern Cal Stock Photohttps://www.alamy.com/image-license-details/?v=1https://www.alamy.com/bulletin-science-106-southern-california-academy-of-sciences-0-40-60-80-100-120-140-160-180-210-230-250-standard-length-mm-fig-2-length-frequency-distribution-of-kelp-bass-and-barred-sand-bass-during-summer-and-winter-from-punta-banda-estuary-diet-overlap-was-calculated-using-the-simplified-morisitas-index-krebs-1989-hall-et-al-1990-c-2-2-p-please-note-that-these-images-are-extracted-from-scanned-page-images-that-may-have-been-digitally-enhanced-for-readability-coloration-and-appearance-of-these-illustrations-may-not-perfectly-resemble-the-original-work-southern-cal-image234188406.html
RMRH05KJ–. Bulletin. Science. 106 SOUTHERN CALIFORNIA ACADEMY OF SCIENCES. 0 40 60 80 100 120 140 160 180 210 230 250 Standard length (mm) Fig. 2. Length-frequency distribution of kelp bass â¡ and barred sand bass â during summer and winter from Punta Banda estuary. Diet overlap was calculated using the simplified Morisita's index (Krebs 1989, Hall et al. 1990): Câ 2 2 P,. Please note that these images are extracted from scanned page images that may have been digitally enhanced for readability - coloration and appearance of these illustrations may not perfectly resemble the original work.. Southern Cal
 Barred sand bass Paralabrax nebulifer is found in the Pacific Ocean off the coast of California Stock Photohttps://www.alamy.com/image-license-details/?v=1https://www.alamy.com/stock-photo-barred-sand-bass-paralabrax-nebulifer-is-found-in-the-pacific-ocean-133784733.html
RFHNJBP5–Barred sand bass Paralabrax nebulifer is found in the Pacific Ocean off the coast of California
 Barred sand bass isolated sea fish, potato cod sketch. Vector redbanded perch hand drawn seafood, marine underwater aquatic animal. Barred sand bass, Stock Vectorhttps://www.alamy.com/image-license-details/?v=1https://www.alamy.com/barred-sand-bass-isolated-sea-fish-potato-cod-sketch-vector-redbanded-perch-hand-drawn-seafood-marine-underwater-aquatic-animal-barred-sand-bass-image478509849.html
RF2JPE05D–Barred sand bass isolated sea fish, potato cod sketch. Vector redbanded perch hand drawn seafood, marine underwater aquatic animal. Barred sand bass,
 . Bulletin. Science. 112 SOUTHERN CALIFORNIA ACADEMY OF SCIENCES. SUMMER WINTER SUMMER WINTER Paralabrax clathratus Paralabrax nebulifer Fig. 4. Seasonal changes in feeding intensity index by kelp bass and barred sand bass from Punta Banda estuary (error bars are standard deviation). Diet Breath and Overlap In both kelp bass and barred sand bass, the numeric diet breadth was highest during summer (0.038 and 0.12) and diminished in winter (0.031 and 0.013; Figure 6). Homogeneity of variances between summer and winter groups of kelp bass was accepted (F = 0.7, P < 0.05), and ANOVA showed that Stock Photohttps://www.alamy.com/image-license-details/?v=1https://www.alamy.com/bulletin-science-112-southern-california-academy-of-sciences-summer-winter-summer-winter-paralabrax-clathratus-paralabrax-nebulifer-fig-4-seasonal-changes-in-feeding-intensity-index-by-kelp-bass-and-barred-sand-bass-from-punta-banda-estuary-error-bars-are-standard-deviation-diet-breath-and-overlap-in-both-kelp-bass-and-barred-sand-bass-the-numeric-diet-breadth-was-highest-during-summer-0038-and-012-and-diminished-in-winter-0031-and-0013-figure-6-homogeneity-of-variances-between-summer-and-winter-groups-of-kelp-bass-was-accepted-f-=-07-p-lt-005-and-anova-showed-that-image234188318.html
RMRH05GE–. Bulletin. Science. 112 SOUTHERN CALIFORNIA ACADEMY OF SCIENCES. SUMMER WINTER SUMMER WINTER Paralabrax clathratus Paralabrax nebulifer Fig. 4. Seasonal changes in feeding intensity index by kelp bass and barred sand bass from Punta Banda estuary (error bars are standard deviation). Diet Breath and Overlap In both kelp bass and barred sand bass, the numeric diet breadth was highest during summer (0.038 and 0.12) and diminished in winter (0.031 and 0.013; Figure 6). Homogeneity of variances between summer and winter groups of kelp bass was accepted (F = 0.7, P < 0.05), and ANOVA showed that
RF2JTWKF6–Sea brass isolated fish monochrome icon. Vector serranus cabrilla marine underwater aquatic underwater animal. Fish of family Serranida, barred sand bass, potato cod, redbanded perch marine seafood
 . Bulletin. Science. 0 40 60 80 100 120 140 160 180 210 230 250 Standard length (mm) Fig. 2. Length-frequency distribution of kelp bass â¡ and barred sand bass â during summer and winter from Punta Banda estuary. Diet overlap was calculated using the simplified Morisita's index (Krebs 1989, Hall et al. 1990): Câ 2 2 P,. 2 p2, + p Where Cik = the simplified Morisita's index for predators i and k ptj and pkj = proportions of each food item inside predator's stomachs. Diet overlap increases as the Morisita's index increase from 0 to 1. Overlap is generally considered to be biologically signific Stock Photohttps://www.alamy.com/image-license-details/?v=1https://www.alamy.com/bulletin-science-0-40-60-80-100-120-140-160-180-210-230-250-standard-length-mm-fig-2-length-frequency-distribution-of-kelp-bass-and-barred-sand-bass-during-summer-and-winter-from-punta-banda-estuary-diet-overlap-was-calculated-using-the-simplified-morisitas-index-krebs-1989-hall-et-al-1990-c-2-2-p-2-p2-p-where-cik-=-the-simplified-morisitas-index-for-predators-i-and-k-ptj-and-pkj-=-proportions-of-each-food-item-inside-predators-stomachs-diet-overlap-increases-as-the-morisitas-index-increase-from-0-to-1-overlap-is-generally-considered-to-be-biologically-signific-image234188391.html
RMRH05K3–. Bulletin. Science. 0 40 60 80 100 120 140 160 180 210 230 250 Standard length (mm) Fig. 2. Length-frequency distribution of kelp bass â¡ and barred sand bass â during summer and winter from Punta Banda estuary. Diet overlap was calculated using the simplified Morisita's index (Krebs 1989, Hall et al. 1990): Câ 2 2 P,. 2 p2, + p Where Cik = the simplified Morisita's index for predators i and k ptj and pkj = proportions of each food item inside predator's stomachs. Diet overlap increases as the Morisita's index increase from 0 to 1. Overlap is generally considered to be biologically signific
RF2JTT3T9–Sea brass isolated fish monochrome icon. Vector serranus cabrilla marine underwater aquatic underwater animal. Fish of family Serranida, barred sand b
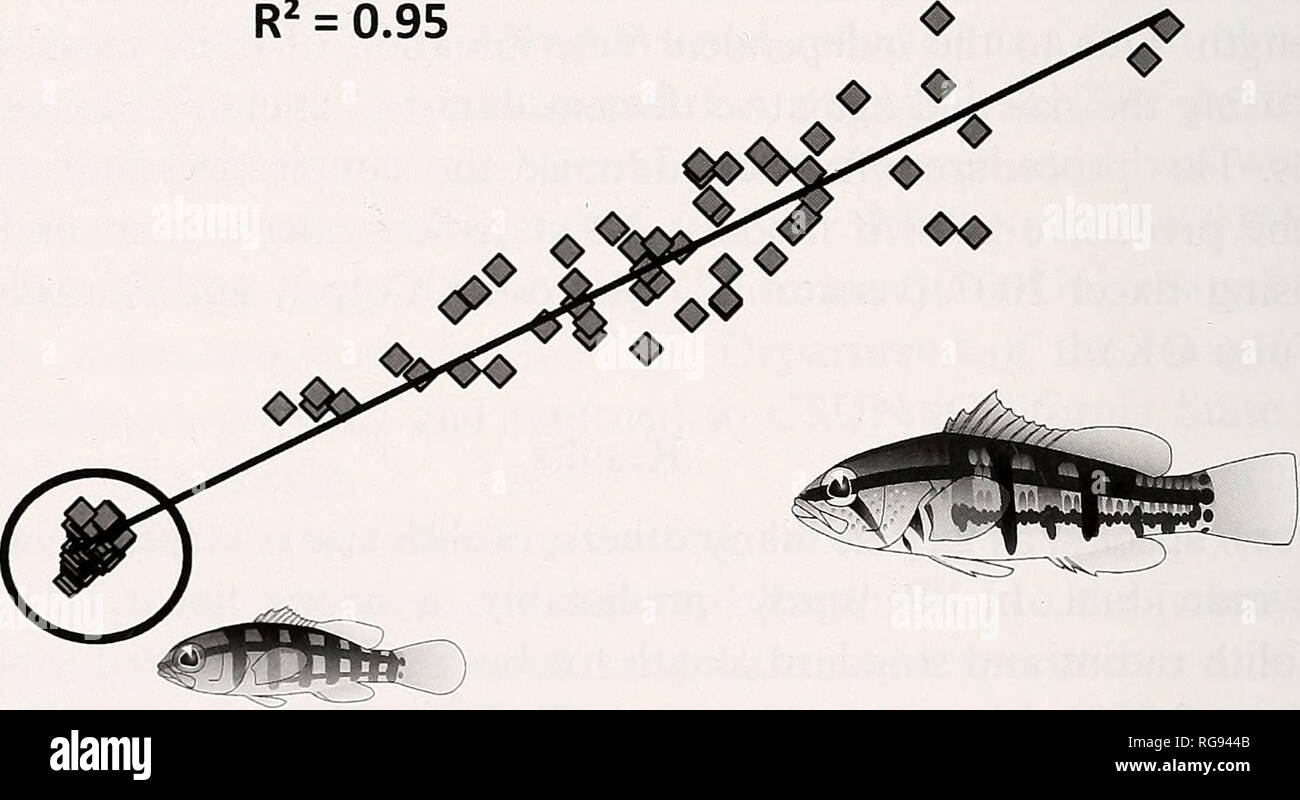 . Bulletin - Southern California Academy of Sciences. Science. 20 40 60 80 Standard Length (mm) YOY Paralabrax nebulifer 0.74X + 19.66 R2 = 0.95 100 —I 120. —I— 20 40 60 80 Standard length (mm) 100 —I 120 Fig. 1. Relationship of age (days) to standard length (mmSL) in YOY Paralabrax maculatofasciatus (A) and P. nebulifer (B) including age and independently derived (back calculated) size at settlement estimates (mdicated by black circles) from otolith radius measurements. indicated by the slopes of the lines, were 1.13 mm/day for spotted sand bass and 1.28 mm/day for barred sand bass. Discussio Stock Photohttps://www.alamy.com/image-license-details/?v=1https://www.alamy.com/bulletin-southern-california-academy-of-sciences-science-20-40-60-80-standard-length-mm-yoy-paralabrax-nebulifer-074x-1966-r2-=-095-100-i-120-i-20-40-60-80-standard-length-mm-100-i-120-fig-1-relationship-of-age-days-to-standard-length-mmsl-in-yoy-paralabrax-maculatofasciatus-a-and-p-nebulifer-b-including-age-and-independently-derived-back-calculated-size-at-settlement-estimates-mdicated-by-black-circles-from-otolith-radius-measurements-indicated-by-the-slopes-of-the-lines-were-113-mmday-for-spotted-sand-bass-and-128-mmday-for-barred-sand-bass-discussio-image233770107.html
RMRG944B–. Bulletin - Southern California Academy of Sciences. Science. 20 40 60 80 Standard Length (mm) YOY Paralabrax nebulifer 0.74X + 19.66 R2 = 0.95 100 —I 120. —I— 20 40 60 80 Standard length (mm) 100 —I 120 Fig. 1. Relationship of age (days) to standard length (mmSL) in YOY Paralabrax maculatofasciatus (A) and P. nebulifer (B) including age and independently derived (back calculated) size at settlement estimates (mdicated by black circles) from otolith radius measurements. indicated by the slopes of the lines, were 1.13 mm/day for spotted sand bass and 1.28 mm/day for barred sand bass. Discussio
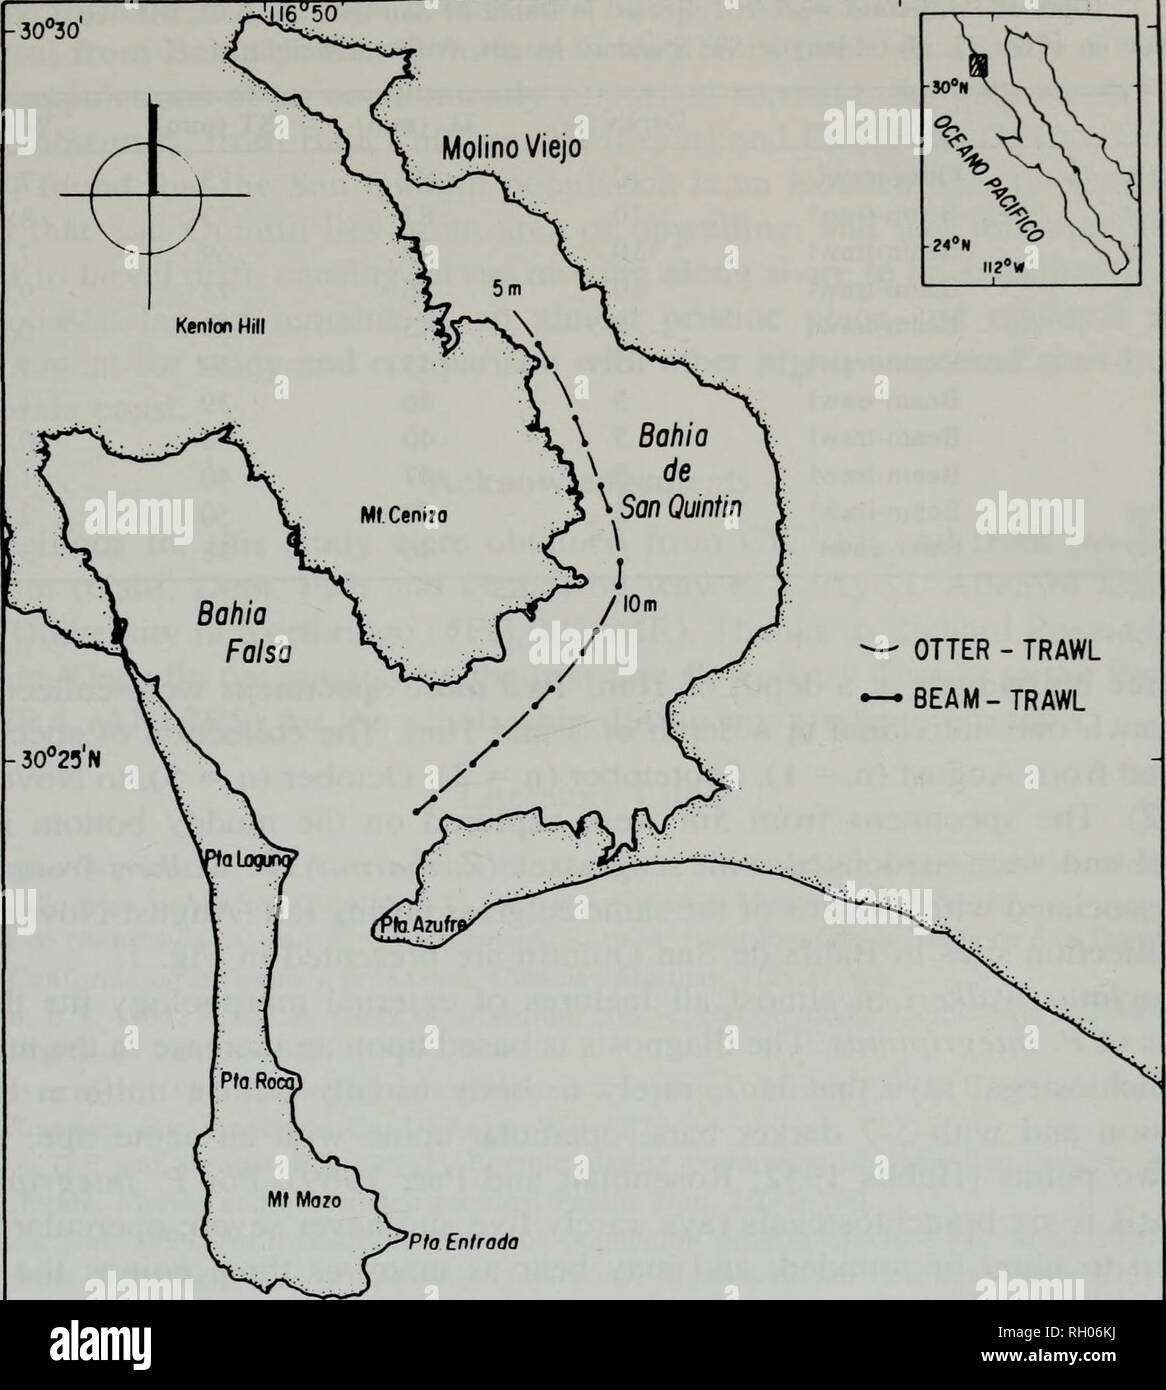 . Bulletin. Science. OTTER - TRAWL BEAM-TRAWL 0 500 1000 2000 (dfTROS II6°50'W II6°55 Figure 1. Location of the sampling sites in Bahia de San Quintin, B.C. Mexico. California (Miller and Lea 1972). A comparison of the collected fishes with a beam-trawl gear from the Estero de Punta Banda and Bahia de San Quintin is presented in Rosales-Casian (1997a). In this last study, the most important fish species in Punta Banda (5m-depth) were the California halibut (Paralichthys cal- ifornicus), the kelp bass (Paralabrax clathratus), and the barred sand bass {P. nebulifer); in San Quintin the catches w Stock Photohttps://www.alamy.com/image-license-details/?v=1https://www.alamy.com/bulletin-science-otter-trawl-beam-trawl-0-500-1000-2000-dftros-ii650w-ii655-figure-1-location-of-the-sampling-sites-in-bahia-de-san-quintin-bc-mexico-california-miller-and-lea-1972-a-comparison-of-the-collected-fishes-with-a-beam-trawl-gear-from-the-estero-de-punta-banda-and-bahia-de-san-quintin-is-presented-in-rosales-casian-1997a-in-this-last-study-the-most-important-fish-species-in-punta-banda-5m-depth-were-the-california-halibut-paralichthys-cal-ifornicus-the-kelp-bass-paralabrax-clathratus-and-the-barred-sand-bass-p-nebulifer-in-san-quintin-the-catches-w-image234189190.html
RMRH06KJ–. Bulletin. Science. OTTER - TRAWL BEAM-TRAWL 0 500 1000 2000 (dfTROS II6°50'W II6°55 Figure 1. Location of the sampling sites in Bahia de San Quintin, B.C. Mexico. California (Miller and Lea 1972). A comparison of the collected fishes with a beam-trawl gear from the Estero de Punta Banda and Bahia de San Quintin is presented in Rosales-Casian (1997a). In this last study, the most important fish species in Punta Banda (5m-depth) were the California halibut (Paralichthys cal- ifornicus), the kelp bass (Paralabrax clathratus), and the barred sand bass {P. nebulifer); in San Quintin the catches w
 . Bulletin - Southern California Academy of Sciences. Science. 134 SOUTHERN CALIFORNIA ACADEMY OF SCIENCES 40 30 ^m 1960s â iroi 1990s (j>. 0 1-5 6-10 11-15 16-20 21-25 26-30 31-35 Recapture distance (km) Fig. 4. Recapture distances for barred sand bass tagged during peak spawning season (Jun-Aug) and recaptured during non-spawning season (Nov-Mar), historical California Department of Fish and Game tagging project (1960s and 1990s). 1960s = dark bars, 1990s = gray bars. transient spawning behavior, also showed variability in spawning migration distance (e.g., 1.8-32.3 km; Nemeth et al. 2007 Stock Photohttps://www.alamy.com/image-license-details/?v=1https://www.alamy.com/bulletin-southern-california-academy-of-sciences-science-134-southern-california-academy-of-sciences-40-30-m-1960s-iroi-1990s-jgt-0-1-5-6-10-11-15-16-20-21-25-26-30-31-35-recapture-distance-km-fig-4-recapture-distances-for-barred-sand-bass-tagged-during-peak-spawning-season-jun-aug-and-recaptured-during-non-spawning-season-nov-mar-historical-california-department-of-fish-and-game-tagging-project-1960s-and-1990s-1960s-=-dark-bars-1990s-=-gray-bars-transient-spawning-behavior-also-showed-variability-in-spawning-migration-distance-eg-18-323-km-nemeth-et-al-2007-image233771004.html
RMRG958C–. Bulletin - Southern California Academy of Sciences. Science. 134 SOUTHERN CALIFORNIA ACADEMY OF SCIENCES 40 30 ^m 1960s â iroi 1990s (j>. 0 1-5 6-10 11-15 16-20 21-25 26-30 31-35 Recapture distance (km) Fig. 4. Recapture distances for barred sand bass tagged during peak spawning season (Jun-Aug) and recaptured during non-spawning season (Nov-Mar), historical California Department of Fish and Game tagging project (1960s and 1990s). 1960s = dark bars, 1990s = gray bars. transient spawning behavior, also showed variability in spawning migration distance (e.g., 1.8-32.3 km; Nemeth et al. 2007
 . Bulletin. Science. SUMMER WINTER Paralabrax clathratus SUMMER WINTER Paralabrax nebulifer Fig. 6. Seasonal changes in numeric â and weight â¡ diet breath for kelp bass and barred sand bass from Punta Banda estuary (error bars are 95% bootstrap confidence intervals). Dietary overlap between kelp bass and barred sand bass were relatively low ( 0.05) and weight overlap index (F = 3.84, P > 0.05). Significant differences between sea- sons were observed in the numeric (F = 457.7, P < 0.01), and weight overlap (F = 193.7, P < 0.01). All overlaps values (by number and weight) in the two se Stock Photohttps://www.alamy.com/image-license-details/?v=1https://www.alamy.com/bulletin-science-summer-winter-paralabrax-clathratus-summer-winter-paralabrax-nebulifer-fig-6-seasonal-changes-in-numeric-and-weight-diet-breath-for-kelp-bass-and-barred-sand-bass-from-punta-banda-estuary-error-bars-are-95-bootstrap-confidence-intervals-dietary-overlap-between-kelp-bass-and-barred-sand-bass-were-relatively-low-005-and-weight-overlap-index-f-=-384-p-gt-005-significant-differences-between-sea-sons-were-observed-in-the-numeric-f-=-4577-p-lt-001-and-weight-overlap-f-=-1937-p-lt-001-all-overlaps-values-by-number-and-weight-in-the-two-se-image234188293.html
RMRH05FH–. Bulletin. Science. SUMMER WINTER Paralabrax clathratus SUMMER WINTER Paralabrax nebulifer Fig. 6. Seasonal changes in numeric â and weight â¡ diet breath for kelp bass and barred sand bass from Punta Banda estuary (error bars are 95% bootstrap confidence intervals). Dietary overlap between kelp bass and barred sand bass were relatively low ( 0.05) and weight overlap index (F = 3.84, P > 0.05). Significant differences between sea- sons were observed in the numeric (F = 457.7, P < 0.01), and weight overlap (F = 193.7, P < 0.01). All overlaps values (by number and weight) in the two se
 . Bulletin. Science. Wi WINTER Gammarids Fishes Isopods Decapods ., Y////////A Echinoderms. Fig. 3. Relative importance by percent number (N), percent weight (W) and percent frequency occurrence (F) of principal prey of kelp bass during summer (a), and winter (b) and barred sand bass during summer (c) and winter (d) from Punta Banda estuary. Below bars: IRI percentage and IRI values (parenthesis). 4). Significant differences in feeding intensity between seasons (H = 145.7, P < 0.01) were found. In barred sand bass, a decrease of feeding intensity from 1.0 (±1.6 SD) in summer to 0.6 (±0.4 Stock Photohttps://www.alamy.com/image-license-details/?v=1https://www.alamy.com/bulletin-science-wi-winter-gammarids-fishes-isopods-decapods-ya-echinoderms-fig-3-relative-importance-by-percent-number-n-percent-weight-w-and-percent-frequency-occurrence-f-of-principal-prey-of-kelp-bass-during-summer-a-and-winter-b-and-barred-sand-bass-during-summer-c-and-winter-d-from-punta-banda-estuary-below-bars-iri-percentage-and-iri-values-parenthesis-4-significant-differences-in-feeding-intensity-between-seasons-h-=-1457-p-lt-001-were-found-in-barred-sand-bass-a-decrease-of-feeding-intensity-from-10-16-sd-in-summer-to-06-04-image234188334.html
RMRH05H2–. Bulletin. Science. Wi WINTER Gammarids Fishes Isopods Decapods ., Y////////A Echinoderms. Fig. 3. Relative importance by percent number (N), percent weight (W) and percent frequency occurrence (F) of principal prey of kelp bass during summer (a), and winter (b) and barred sand bass during summer (c) and winter (d) from Punta Banda estuary. Below bars: IRI percentage and IRI values (parenthesis). 4). Significant differences in feeding intensity between seasons (H = 145.7, P < 0.01) were found. In barred sand bass, a decrease of feeding intensity from 1.0 (±1.6 SD) in summer to 0.6 (±0.4
 . Bulletin. Science. FEEDING ECOLOGY OF BASS IN PUNTA BANDA, BAJA CALIFORNIA 113 0.5. SUMMER WINTER Paralabrax clathratus SUMMER WINTER Paralabrax nebulifer Fig. 6. Seasonal changes in numeric â and weight â¡ diet breath for kelp bass and barred sand bass from Punta Banda estuary (error bars are 95% bootstrap confidence intervals). Dietary overlap between kelp bass and barred sand bass were relatively low ( 0.05) and weight overlap index (F = 3.84, P > 0.05). Significant differences between sea- sons were observed in the numeric (F = 457.7, P < 0.01), and weight overlap (F = 193.7, P < Stock Photohttps://www.alamy.com/image-license-details/?v=1https://www.alamy.com/bulletin-science-feeding-ecology-of-bass-in-punta-banda-baja-california-113-05-summer-winter-paralabrax-clathratus-summer-winter-paralabrax-nebulifer-fig-6-seasonal-changes-in-numeric-and-weight-diet-breath-for-kelp-bass-and-barred-sand-bass-from-punta-banda-estuary-error-bars-are-95-bootstrap-confidence-intervals-dietary-overlap-between-kelp-bass-and-barred-sand-bass-were-relatively-low-005-and-weight-overlap-index-f-=-384-p-gt-005-significant-differences-between-sea-sons-were-observed-in-the-numeric-f-=-4577-p-lt-001-and-weight-overlap-f-=-1937-p-lt-image234188307.html
RMRH05G3–. Bulletin. Science. FEEDING ECOLOGY OF BASS IN PUNTA BANDA, BAJA CALIFORNIA 113 0.5. SUMMER WINTER Paralabrax clathratus SUMMER WINTER Paralabrax nebulifer Fig. 6. Seasonal changes in numeric â and weight â¡ diet breath for kelp bass and barred sand bass from Punta Banda estuary (error bars are 95% bootstrap confidence intervals). Dietary overlap between kelp bass and barred sand bass were relatively low ( 0.05) and weight overlap index (F = 3.84, P > 0.05). Significant differences between sea- sons were observed in the numeric (F = 457.7, P < 0.01), and weight overlap (F = 193.7, P <
 . Bulletin - Southern California Academy of Sciences. Science. BARRED SAND BASS SPAWNING MOVEMENTS 133. I â ' [ 1 1 ⢠' I ' ⢠¥' â Â¥' ' 1 â â Â¥' â t â â I â V â t â â t â Â¥ 1 ' 'I 7 14 21 28 35 42 49 56 63 70 77 84 91 98 105 112 119 Days at liberty (7 d bins) Fig. 3. Frequency of tag returns over time by peak spawning season tag month (lines with symbols) and all fish combined (gray bars) for fish that were tagged at Huntington Flats, CA and recaptured back at that location within the same year, historical California Department of Fish and Game tagging project (1960s and 1990s). grounds Stock Photohttps://www.alamy.com/image-license-details/?v=1https://www.alamy.com/bulletin-southern-california-academy-of-sciences-science-barred-sand-bass-spawning-movements-133-i-1-1-i-1-t-i-v-t-t-1-i-7-14-21-28-35-42-49-56-63-70-77-84-91-98-105-112-119-days-at-liberty-7-d-bins-fig-3-frequency-of-tag-returns-over-time-by-peak-spawning-season-tag-month-lines-with-symbols-and-all-fish-combined-gray-bars-for-fish-that-were-tagged-at-huntington-flats-ca-and-recaptured-back-at-that-location-within-the-same-year-historical-california-department-of-fish-and-game-tagging-project-1960s-and-1990s-grounds-image233771054.html
RMRG95A6–. Bulletin - Southern California Academy of Sciences. Science. BARRED SAND BASS SPAWNING MOVEMENTS 133. I â ' [ 1 1 ⢠' I ' ⢠¥' â Â¥' ' 1 â â Â¥' â t â â I â V â t â â t â Â¥ 1 ' 'I 7 14 21 28 35 42 49 56 63 70 77 84 91 98 105 112 119 Days at liberty (7 d bins) Fig. 3. Frequency of tag returns over time by peak spawning season tag month (lines with symbols) and all fish combined (gray bars) for fish that were tagged at Huntington Flats, CA and recaptured back at that location within the same year, historical California Department of Fish and Game tagging project (1960s and 1990s). grounds