Quick filters:
Chromaticity diagram Stock Photos and Images
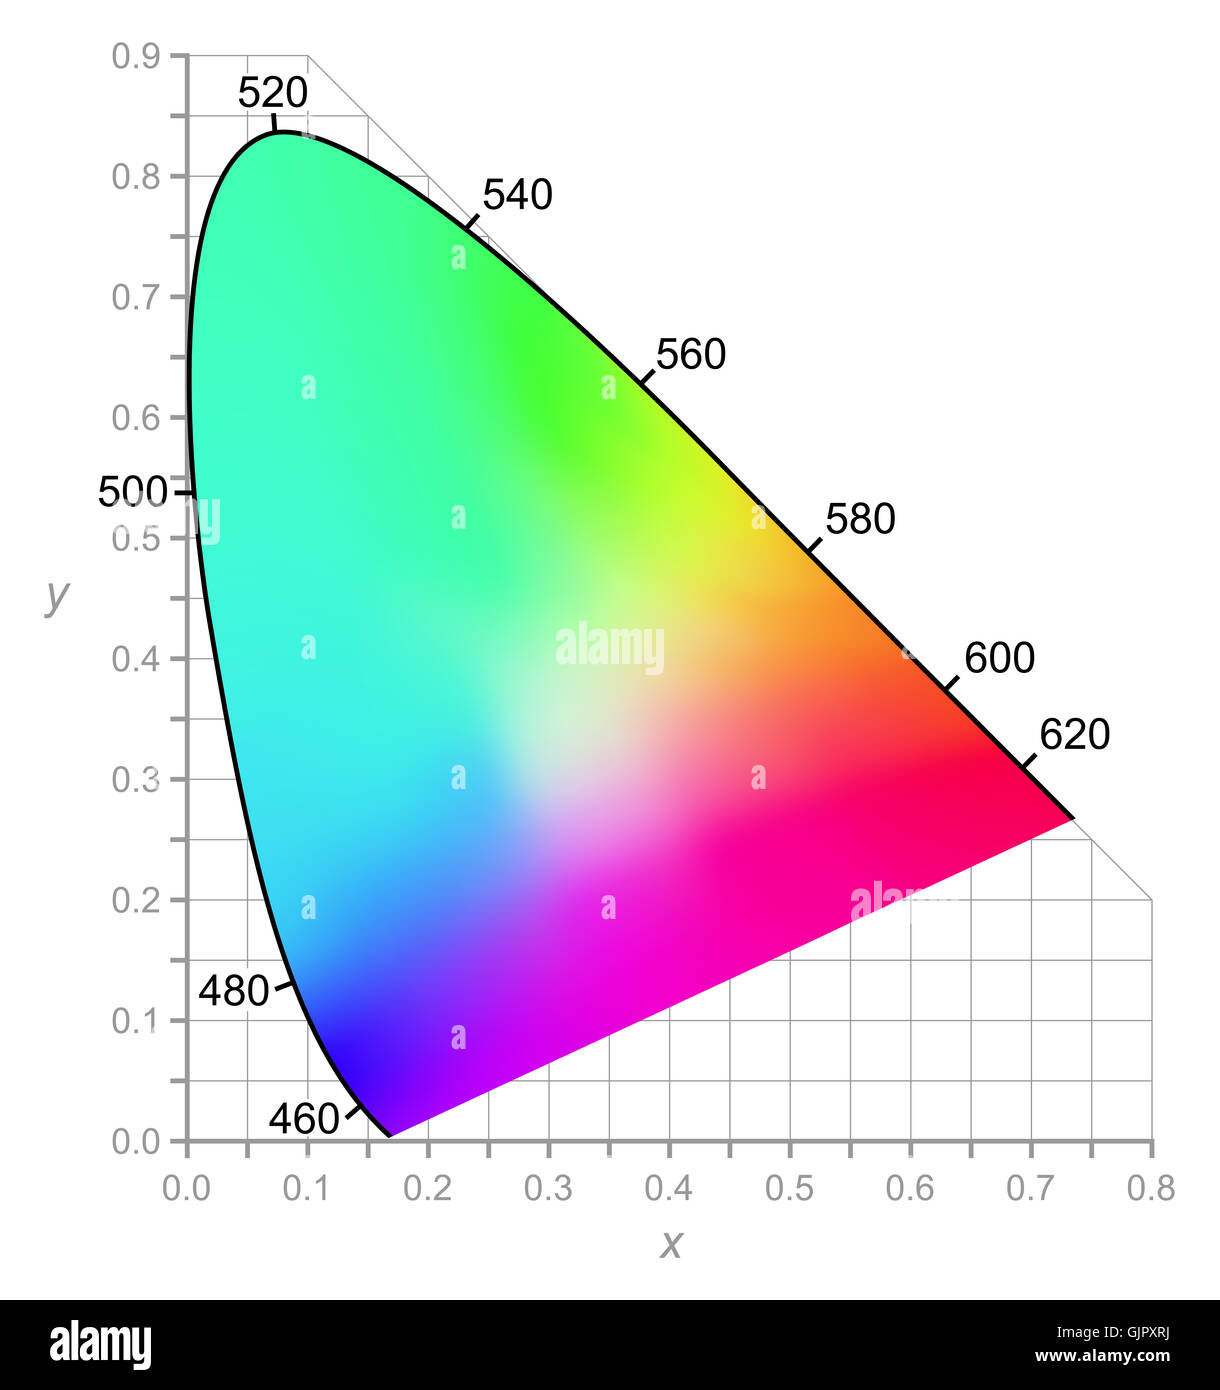 CIE Chromaticity Diagram describes color as seen by the human eye in full daylight. Two-dimensional diagram of colors. Stock Photohttps://www.alamy.com/image-license-details/?v=1https://www.alamy.com/stock-photo-cie-chromaticity-diagram-describes-color-as-seen-by-the-human-eye-114830006.html
RFGJPXRJ–CIE Chromaticity Diagram describes color as seen by the human eye in full daylight. Two-dimensional diagram of colors.
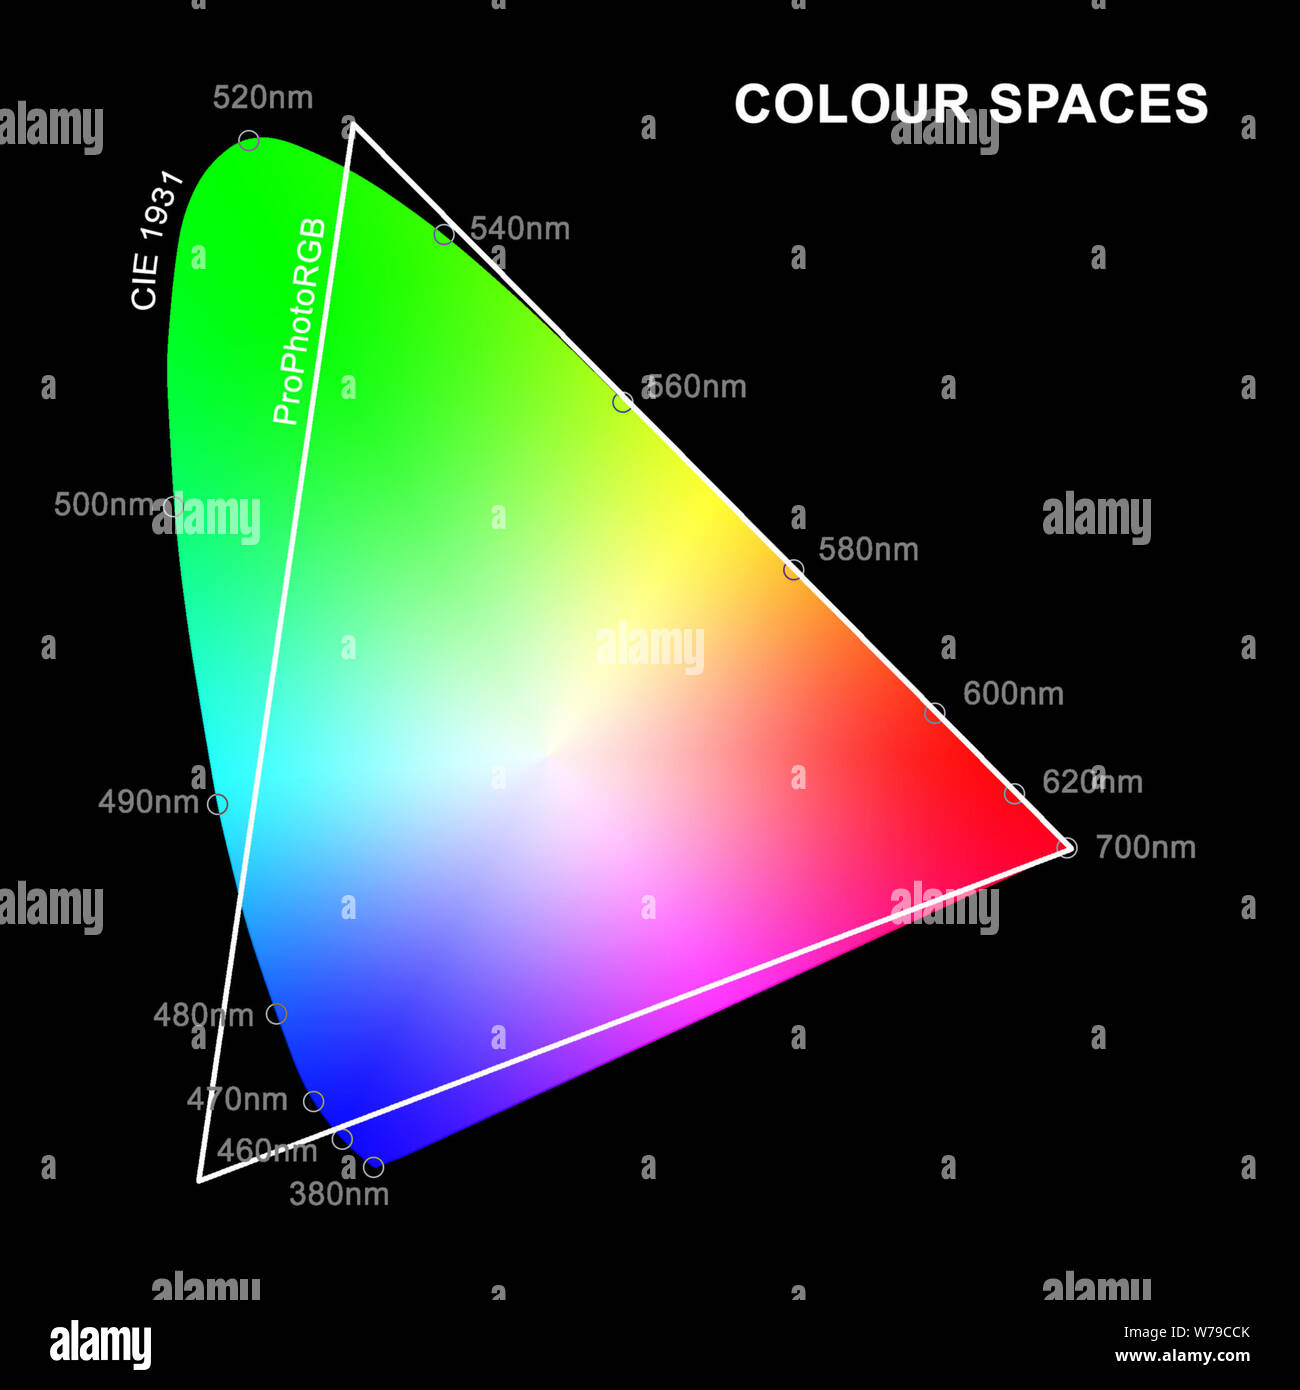 An illustration of ProPhotoRGB colour space overlaid on CIE 1931 Chromaticity Diagram of human colour perception with wavelengths in nm. Stock Photohttps://www.alamy.com/image-license-details/?v=1https://www.alamy.com/an-illustration-of-prophotorgb-colour-space-overlaid-on-cie-1931-chromaticity-diagram-of-human-colour-perception-with-wavelengths-in-nm-image262665443.html
RMW79CCK–An illustration of ProPhotoRGB colour space overlaid on CIE 1931 Chromaticity Diagram of human colour perception with wavelengths in nm.
RM2F77E6T–Skiopticon image from the Department of Photography at the Royal Institute of Technology. Use by Professor Helmer Bäckström as lecture material. Bäckström was Sweden's first professor in photography at the Royal Institute of Technology 1948-58. Motive depicting 'Color triangle (first used by Maxwell). In America, the naming chromaticity diagram was often used.' (For more text see the picture). For more info see: Bäckström, Helmer. Photographic manual. Other revised edition. Nature and Culture. Stockholm 1958-59. See chap.128.Trikolorimetri paragraph 3. Mixture of colors p. 961 and following.
 color Stock Photohttps://www.alamy.com/image-license-details/?v=1https://www.alamy.com/color-image225383333.html
RFR2K2MN–color
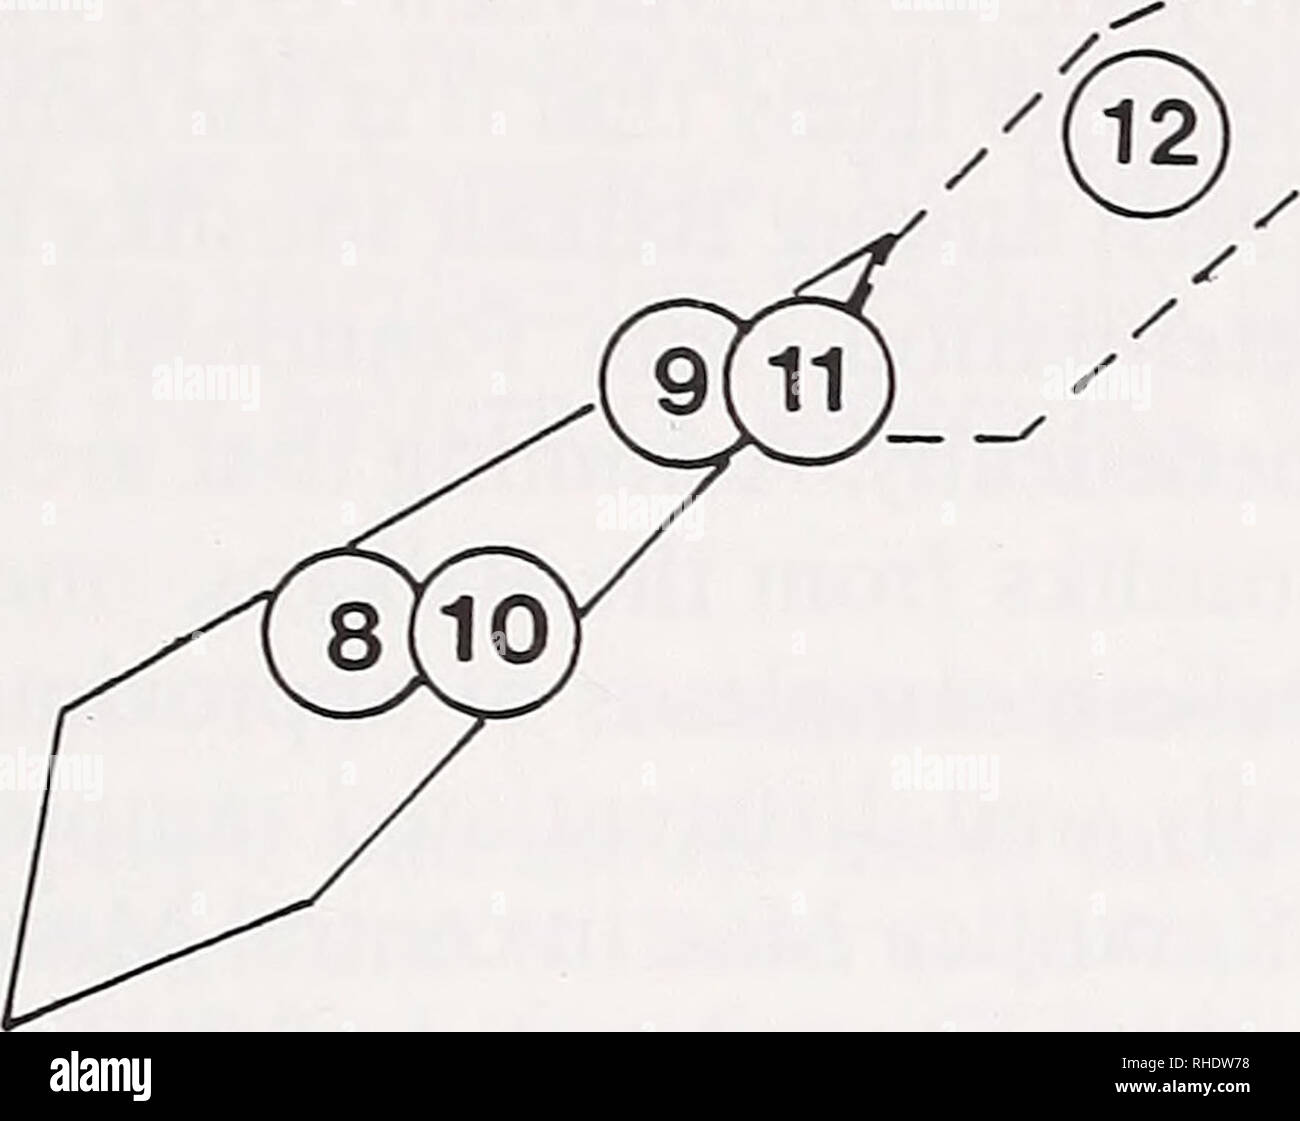 . Bonner zoologische Beiträge : Herausgeber: Zoologisches Forschungsinstitut und Museum Alexander Koenig, Bonn. Biology; Zoology. Variation in sousliks 105 y .39- .38- .36- .37-. .35- .34 .36 .38 .40 X Fig. 6: Projection of five Spermophilus citellus group centroids onto the CIE x, y (1931) chromaticity diagram (insert). Individuals of the most distinct samples (8 and 12) are enclosed by polygons. For sample designation see Fig. 2. Cranial size in the European souslik is significantly correlated with climatic variables, what suggests that it is of adaptive significance. Smith & Patton (198 Stock Photohttps://www.alamy.com/image-license-details/?v=1https://www.alamy.com/bonner-zoologische-beitrge-herausgeber-zoologisches-forschungsinstitut-und-museum-alexander-koenig-bonn-biology-zoology-variation-in-sousliks-105-y-39-38-36-37-35-34-36-38-40-x-fig-6-projection-of-five-spermophilus-citellus-group-centroids-onto-the-cie-x-y-1931-chromaticity-diagram-insert-individuals-of-the-most-distinct-samples-8-and-12-are-enclosed-by-polygons-for-sample-designation-see-fig-2-cranial-size-in-the-european-souslik-is-significantly-correlated-with-climatic-variables-what-suggests-that-it-is-of-adaptive-significance-smith-amp-patton-198-image234489116.html
RMRHDW78–. Bonner zoologische Beiträge : Herausgeber: Zoologisches Forschungsinstitut und Museum Alexander Koenig, Bonn. Biology; Zoology. Variation in sousliks 105 y .39- .38- .36- .37-. .35- .34 .36 .38 .40 X Fig. 6: Projection of five Spermophilus citellus group centroids onto the CIE x, y (1931) chromaticity diagram (insert). Individuals of the most distinct samples (8 and 12) are enclosed by polygons. For sample designation see Fig. 2. Cranial size in the European souslik is significantly correlated with climatic variables, what suggests that it is of adaptive significance. Smith & Patton (198
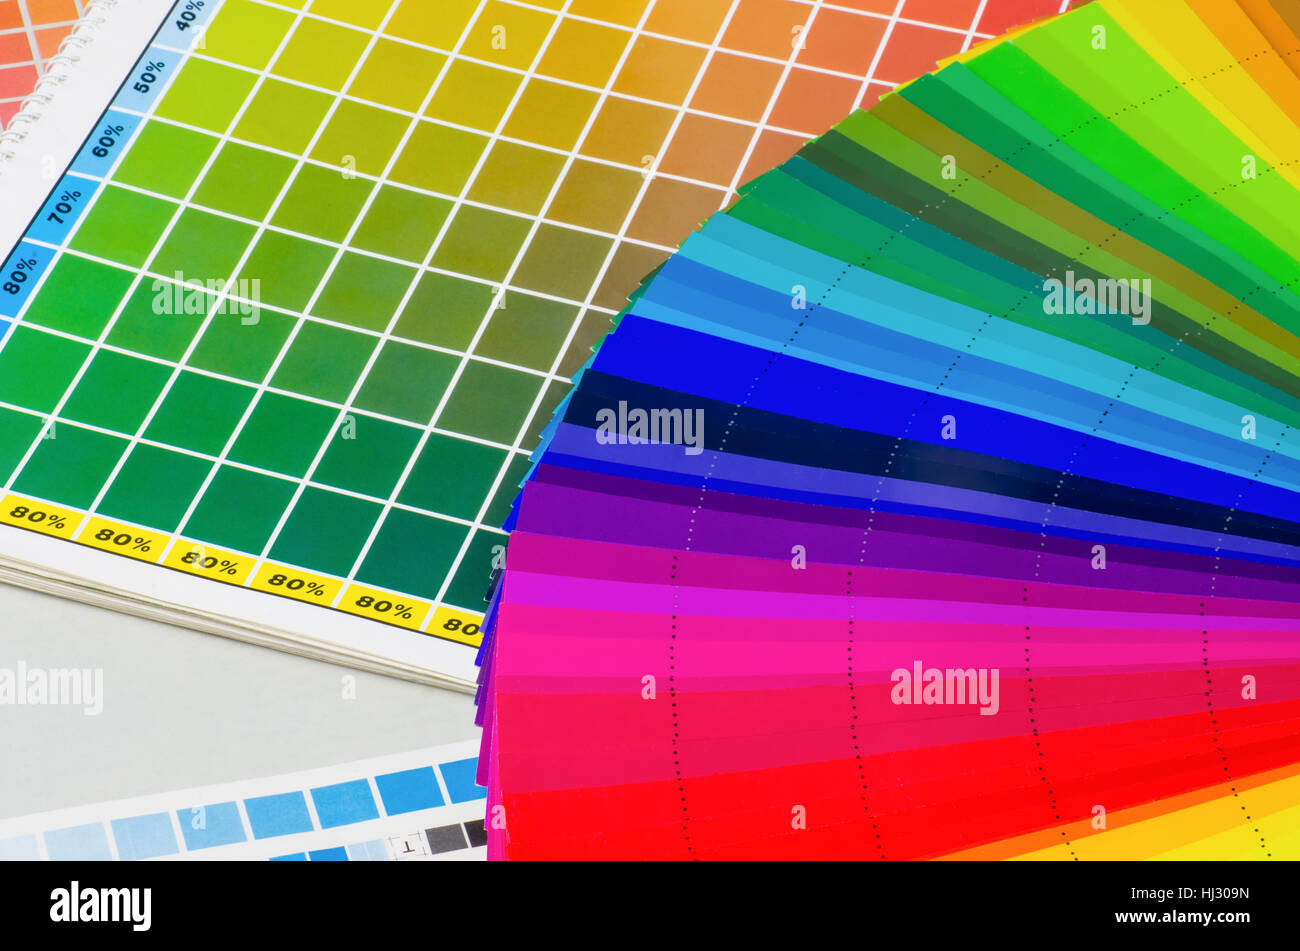 colour, model, design, project, concept, plan, draft, graphic, coloured, Stock Photohttps://www.alamy.com/image-license-details/?v=1https://www.alamy.com/stock-photo-colour-model-design-project-concept-plan-draft-graphic-coloured-131602513.html
RFHJ309N–colour, model, design, project, concept, plan, draft, graphic, coloured,
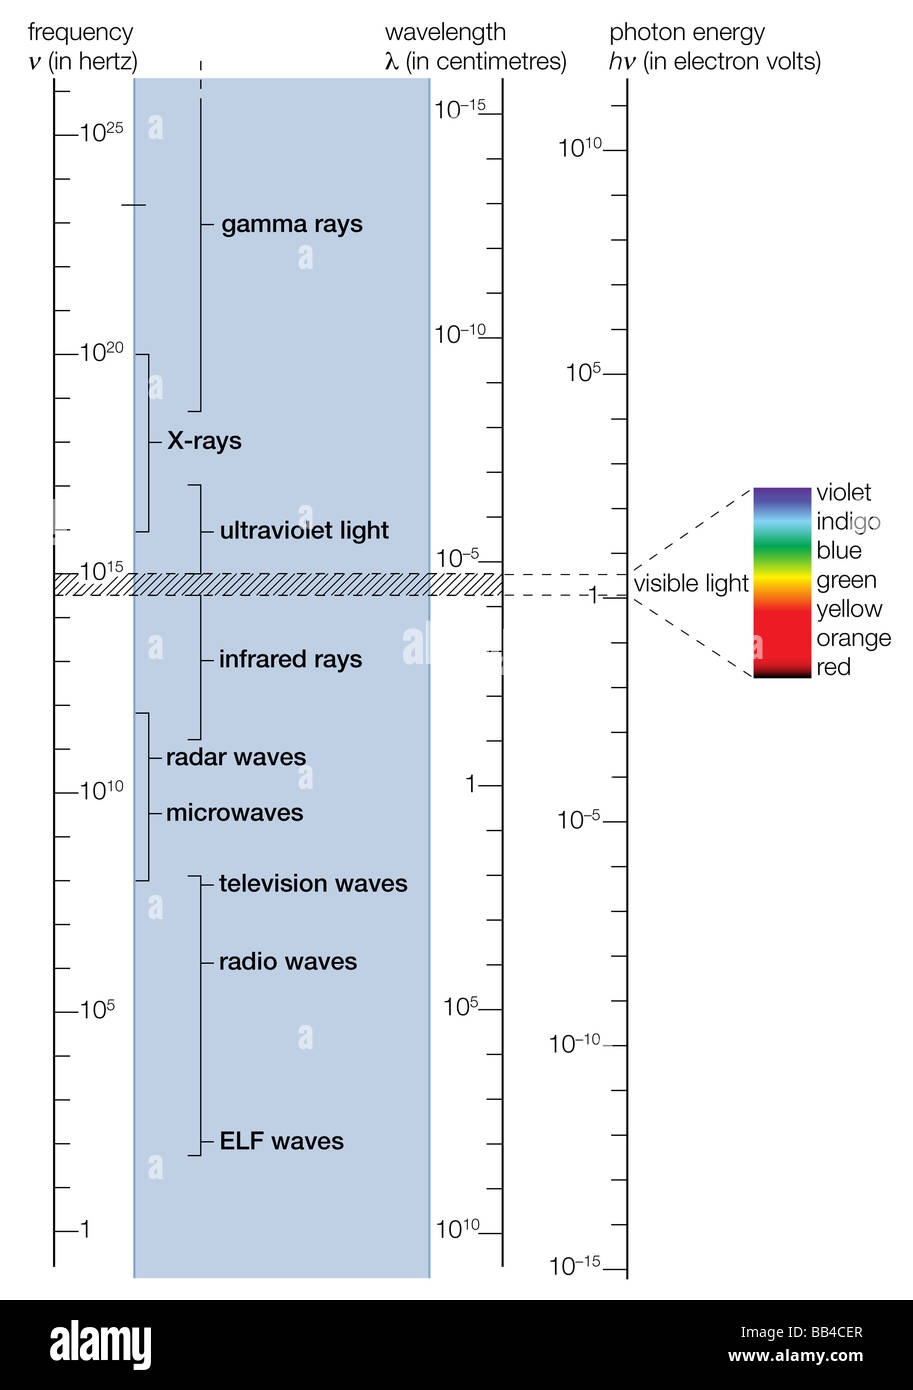 Electromagnetic spectrum. The visible range (shaded portion) is shown enlarged on the right. Stock Photohttps://www.alamy.com/image-license-details/?v=1https://www.alamy.com/stock-photo-electromagnetic-spectrum-the-visible-range-shaded-portion-is-shown-24069215.html
RMBB4CER–Electromagnetic spectrum. The visible range (shaded portion) is shown enlarged on the right.
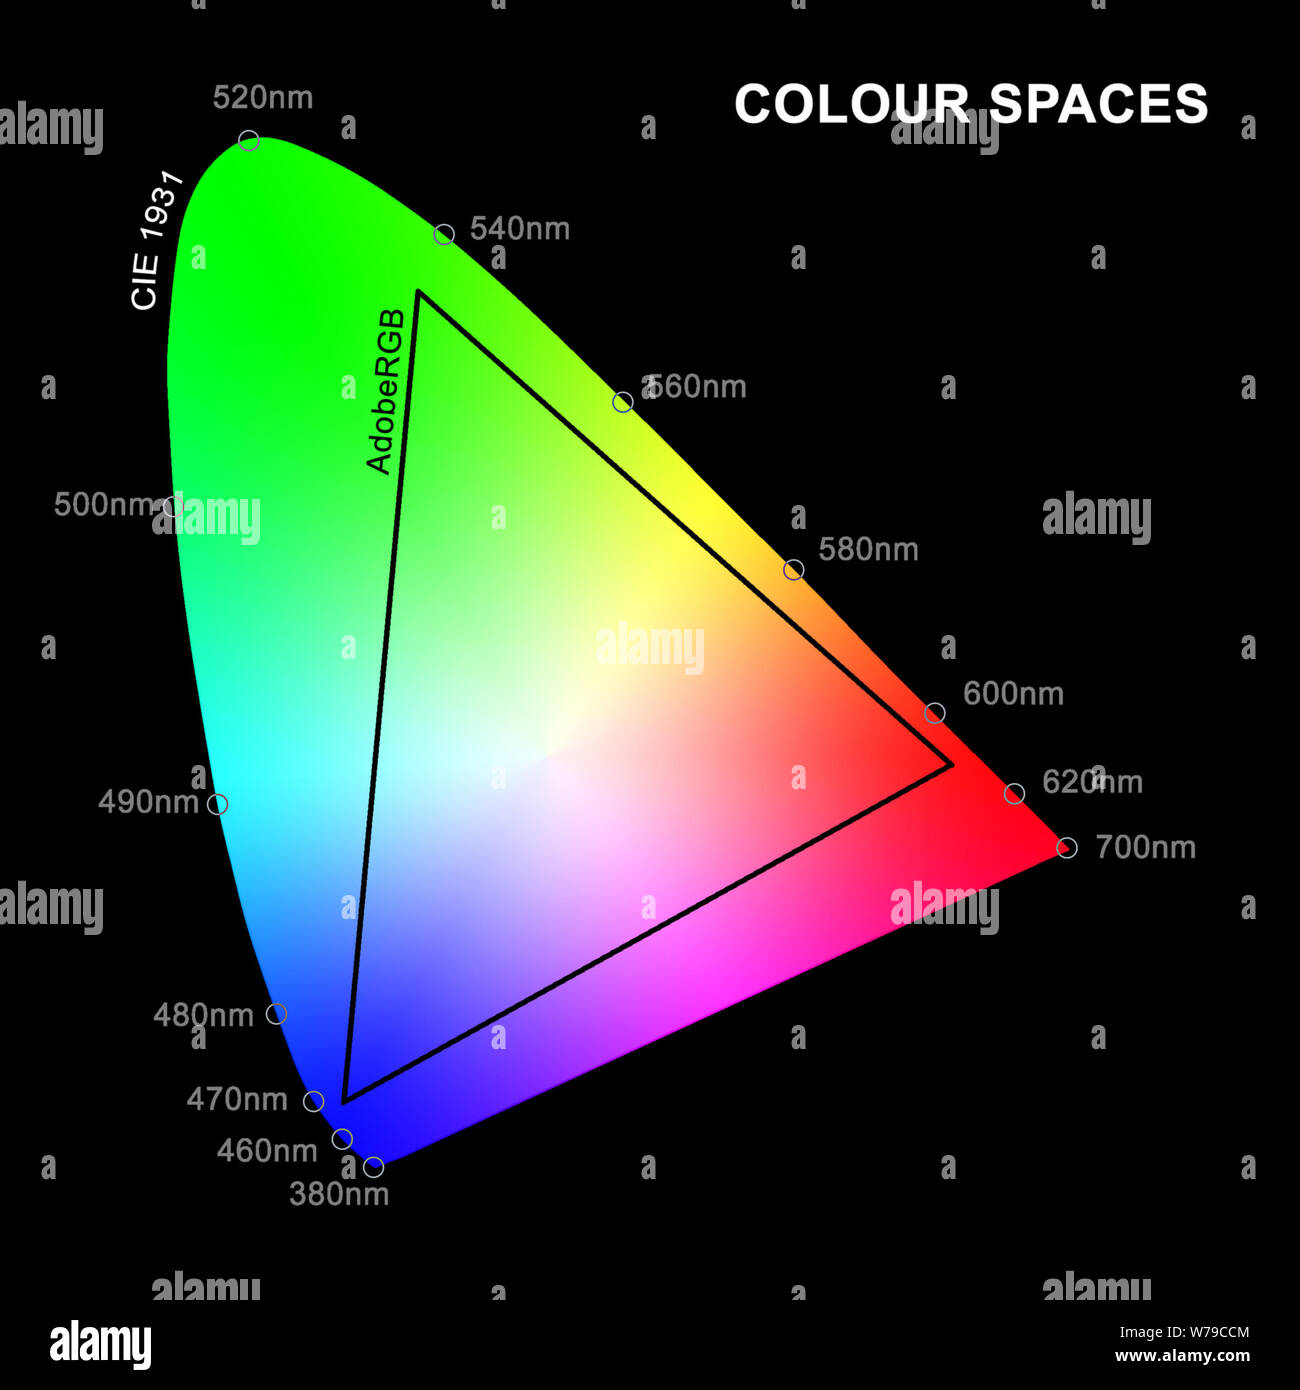 An illustration of AdobeRGB colour space overlaid on CIE 1931 Chromaticity Diagram of human colour perception with wavelengths in nm. Stock Photohttps://www.alamy.com/image-license-details/?v=1https://www.alamy.com/an-illustration-of-adobergb-colour-space-overlaid-on-cie-1931-chromaticity-diagram-of-human-colour-perception-with-wavelengths-in-nm-image262665444.html
RMW79CCM–An illustration of AdobeRGB colour space overlaid on CIE 1931 Chromaticity Diagram of human colour perception with wavelengths in nm.
![. Collected reprints / Atlantic Oceanographic and Meteorological Laboratories [and] Pacific Oceanographic Laboratories. Oceanography Periodicals.. Ocean Color Detection 22-41 (T) CLEAR (T) REDDISH 520 (?) BEACH •°^ -o530 G,% (T) MEADOW o540 (T) TURBID ^O550 (T) CLEAR z LU o z LU U U- LL LU O (J y < O Q£ I u. ©©©@© © .2 .4 .6 TRICHROMATIC COEFFICIENT (RED) Figure 22.39 Chromaticity Diagram (after Ewing, 1969). Solar radiation that penetrates the sea makes possible photosynthesis in green plants which are primarily phytoplankton. Because the production of all marine creatures depends on m Stock Photo . Collected reprints / Atlantic Oceanographic and Meteorological Laboratories [and] Pacific Oceanographic Laboratories. Oceanography Periodicals.. Ocean Color Detection 22-41 (T) CLEAR (T) REDDISH 520 (?) BEACH •°^ -o530 G,% (T) MEADOW o540 (T) TURBID ^O550 (T) CLEAR z LU o z LU U U- LL LU O (J y < O Q£ I u. ©©©@© © .2 .4 .6 TRICHROMATIC COEFFICIENT (RED) Figure 22.39 Chromaticity Diagram (after Ewing, 1969). Solar radiation that penetrates the sea makes possible photosynthesis in green plants which are primarily phytoplankton. Because the production of all marine creatures depends on m Stock Photo](https://c8.alamy.com/comp/REH1X6/collected-reprints-atlantic-oceanographic-and-meteorological-laboratories-and-pacific-oceanographic-laboratories-oceanography-periodicals-ocean-color-detection-22-41-t-clear-t-reddish-520-beach-o530-g-t-meadow-o540-t-turbid-o550-t-clear-z-lu-o-z-lu-u-u-ll-lu-o-j-y-lt-o-q-i-u-@-2-4-6-trichromatic-coefficient-red-figure-2239-chromaticity-diagram-after-ewing-1969-solar-radiation-that-penetrates-the-sea-makes-possible-photosynthesis-in-green-plants-which-are-primarily-phytoplankton-because-the-production-of-all-marine-creatures-depends-on-m-REH1X6.jpg) . Collected reprints / Atlantic Oceanographic and Meteorological Laboratories [and] Pacific Oceanographic Laboratories. Oceanography Periodicals.. Ocean Color Detection 22-41 (T) CLEAR (T) REDDISH 520 (?) BEACH •°^ -o530 G,% (T) MEADOW o540 (T) TURBID ^O550 (T) CLEAR z LU o z LU U U- LL LU O (J y < O Q£ I u. ©©©@© © .2 .4 .6 TRICHROMATIC COEFFICIENT (RED) Figure 22.39 Chromaticity Diagram (after Ewing, 1969). Solar radiation that penetrates the sea makes possible photosynthesis in green plants which are primarily phytoplankton. Because the production of all marine creatures depends on m Stock Photohttps://www.alamy.com/image-license-details/?v=1https://www.alamy.com/collected-reprints-atlantic-oceanographic-and-meteorological-laboratories-and-pacific-oceanographic-laboratories-oceanography-periodicals-ocean-color-detection-22-41-t-clear-t-reddish-520-beach-o530-g-t-meadow-o540-t-turbid-o550-t-clear-z-lu-o-z-lu-u-u-ll-lu-o-j-y-lt-o-q-i-u-@-2-4-6-trichromatic-coefficient-red-figure-2239-chromaticity-diagram-after-ewing-1969-solar-radiation-that-penetrates-the-sea-makes-possible-photosynthesis-in-green-plants-which-are-primarily-phytoplankton-because-the-production-of-all-marine-creatures-depends-on-m-image232714670.html
. Collected reprints / Atlantic Oceanographic and Meteorological Laboratories [and] Pacific Oceanographic Laboratories. Oceanography Periodicals.. Ocean Color Detection 22-41 (T) CLEAR (T) REDDISH 520 (?) BEACH •°^ -o530 G,% (T) MEADOW o540 (T) TURBID ^O550 (T) CLEAR z LU o z LU U U- LL LU O (J y < O Q£ I u. ©©©@© © .2 .4 .6 TRICHROMATIC COEFFICIENT (RED) Figure 22.39 Chromaticity Diagram (after Ewing, 1969). Solar radiation that penetrates the sea makes possible photosynthesis in green plants which are primarily phytoplankton. Because the production of all marine creatures depends on m Stock Photohttps://www.alamy.com/image-license-details/?v=1https://www.alamy.com/collected-reprints-atlantic-oceanographic-and-meteorological-laboratories-and-pacific-oceanographic-laboratories-oceanography-periodicals-ocean-color-detection-22-41-t-clear-t-reddish-520-beach-o530-g-t-meadow-o540-t-turbid-o550-t-clear-z-lu-o-z-lu-u-u-ll-lu-o-j-y-lt-o-q-i-u-@-2-4-6-trichromatic-coefficient-red-figure-2239-chromaticity-diagram-after-ewing-1969-solar-radiation-that-penetrates-the-sea-makes-possible-photosynthesis-in-green-plants-which-are-primarily-phytoplankton-because-the-production-of-all-marine-creatures-depends-on-m-image232714670.htmlRMREH1X6–. Collected reprints / Atlantic Oceanographic and Meteorological Laboratories [and] Pacific Oceanographic Laboratories. Oceanography Periodicals.. Ocean Color Detection 22-41 (T) CLEAR (T) REDDISH 520 (?) BEACH •°^ -o530 G,% (T) MEADOW o540 (T) TURBID ^O550 (T) CLEAR z LU o z LU U U- LL LU O (J y < O Q£ I u. ©©©@© © .2 .4 .6 TRICHROMATIC COEFFICIENT (RED) Figure 22.39 Chromaticity Diagram (after Ewing, 1969). Solar radiation that penetrates the sea makes possible photosynthesis in green plants which are primarily phytoplankton. Because the production of all marine creatures depends on m
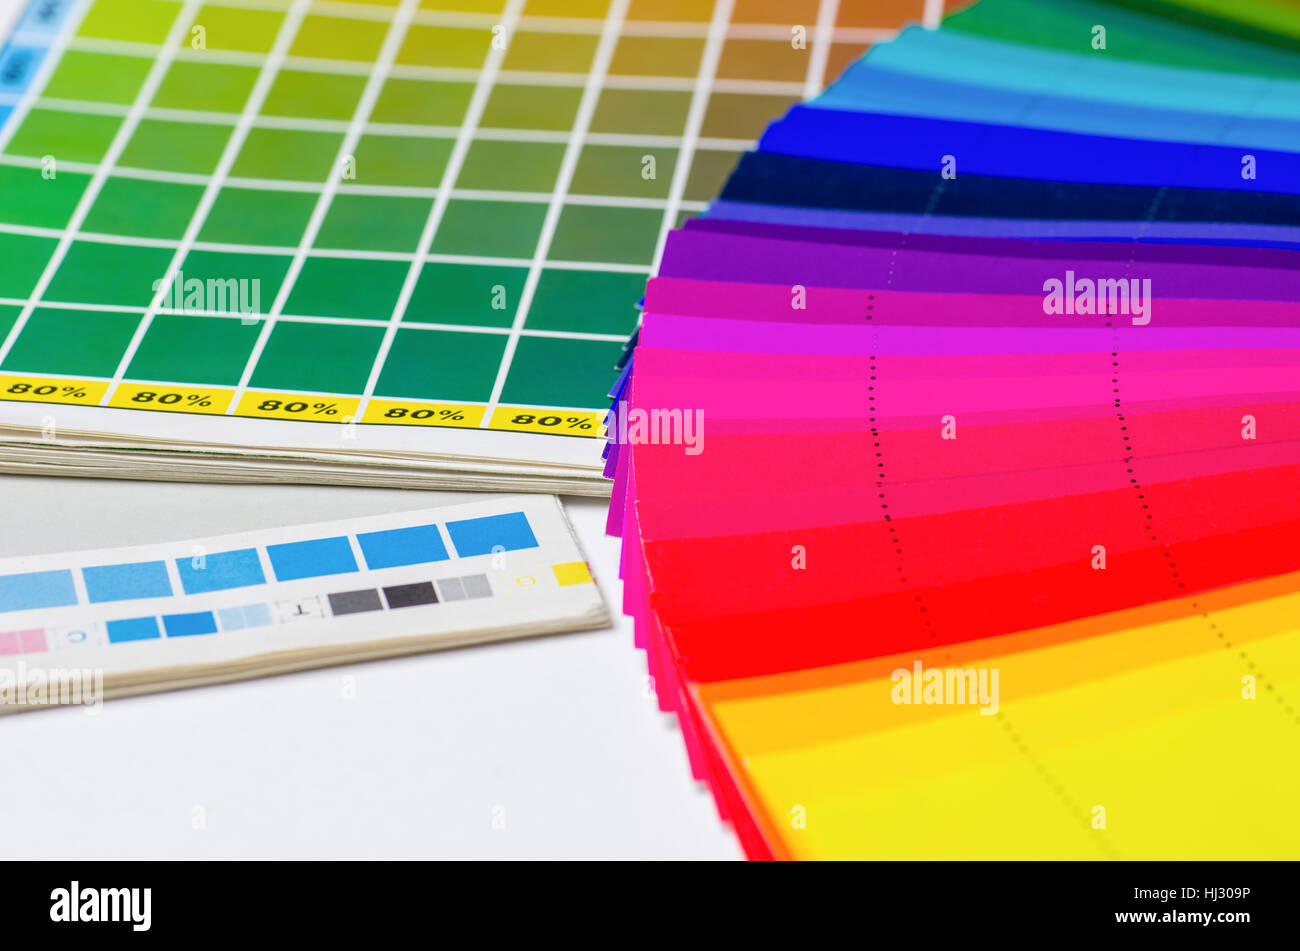 colour value book and color fan Stock Photohttps://www.alamy.com/image-license-details/?v=1https://www.alamy.com/stock-photo-colour-value-book-and-color-fan-131602514.html
RFHJ309P–colour value book and color fan
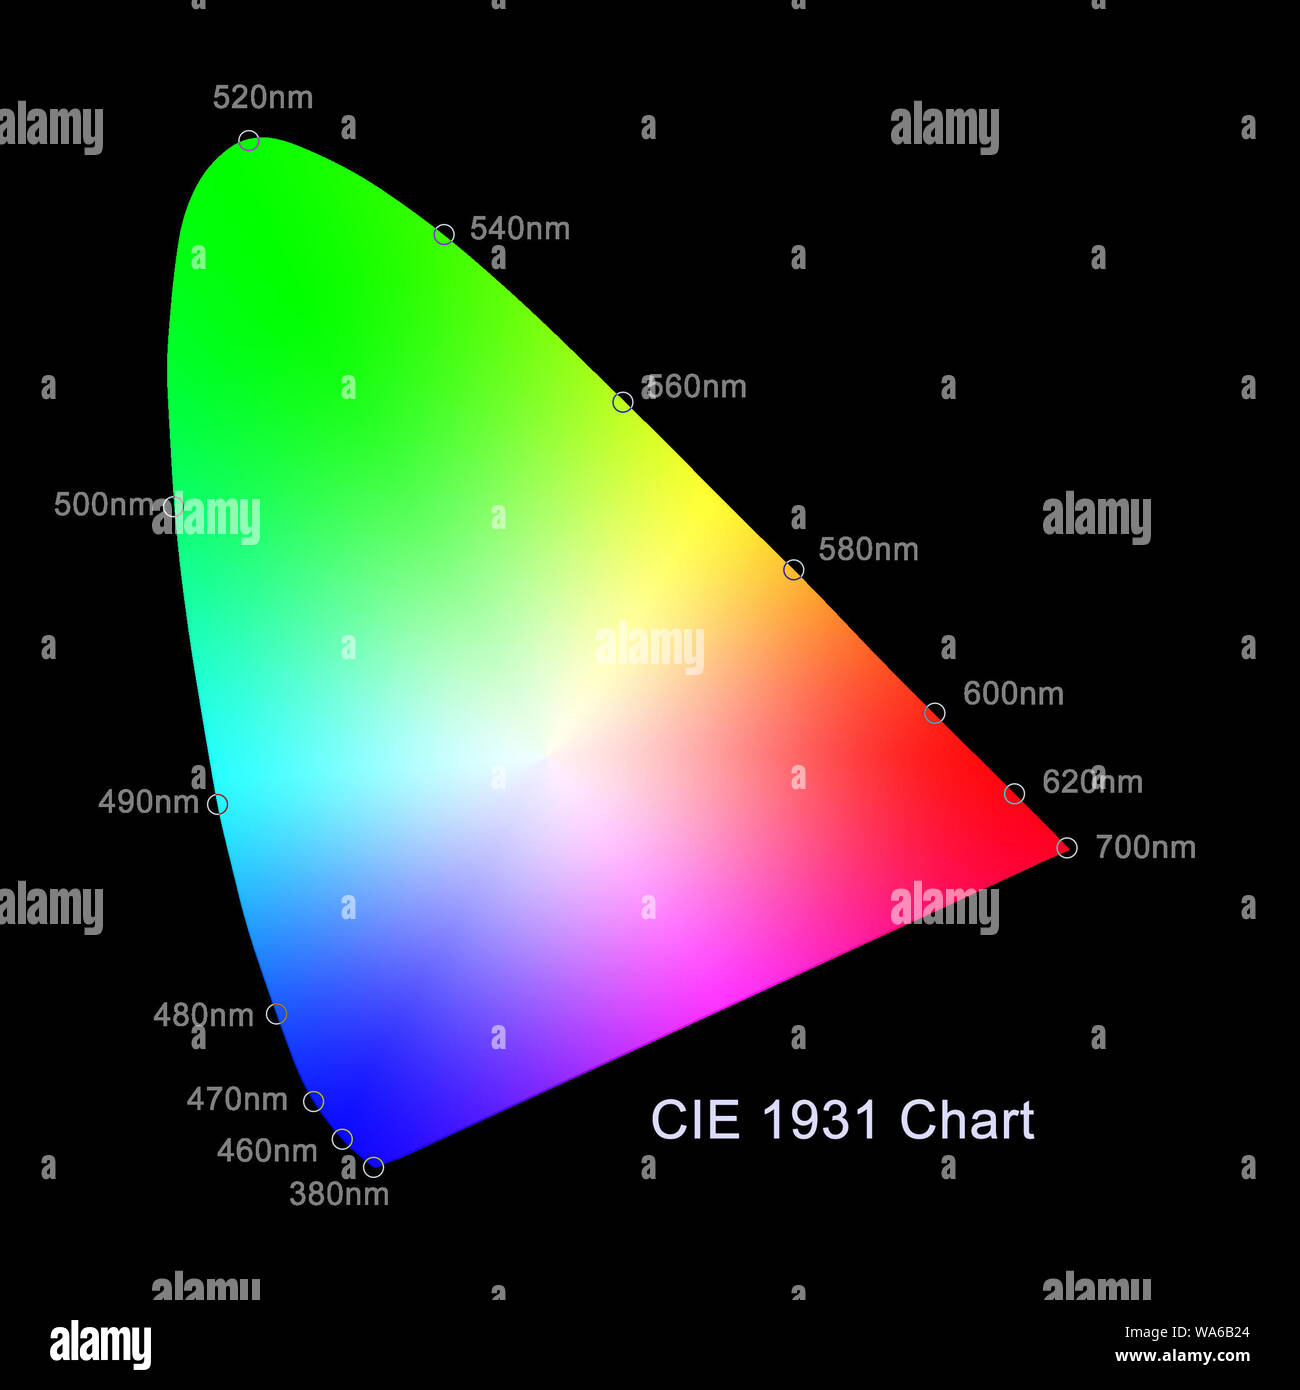 An illustration of CIE 1931 Chromaticity Diagram showing the range of human colour perception with wavelengths in nm. Stock Photohttps://www.alamy.com/image-license-details/?v=1https://www.alamy.com/an-illustration-of-cie-1931-chromaticity-diagram-showing-the-range-of-human-colour-perception-with-wavelengths-in-nm-image264442476.html
RMWA6B24–An illustration of CIE 1931 Chromaticity Diagram showing the range of human colour perception with wavelengths in nm.
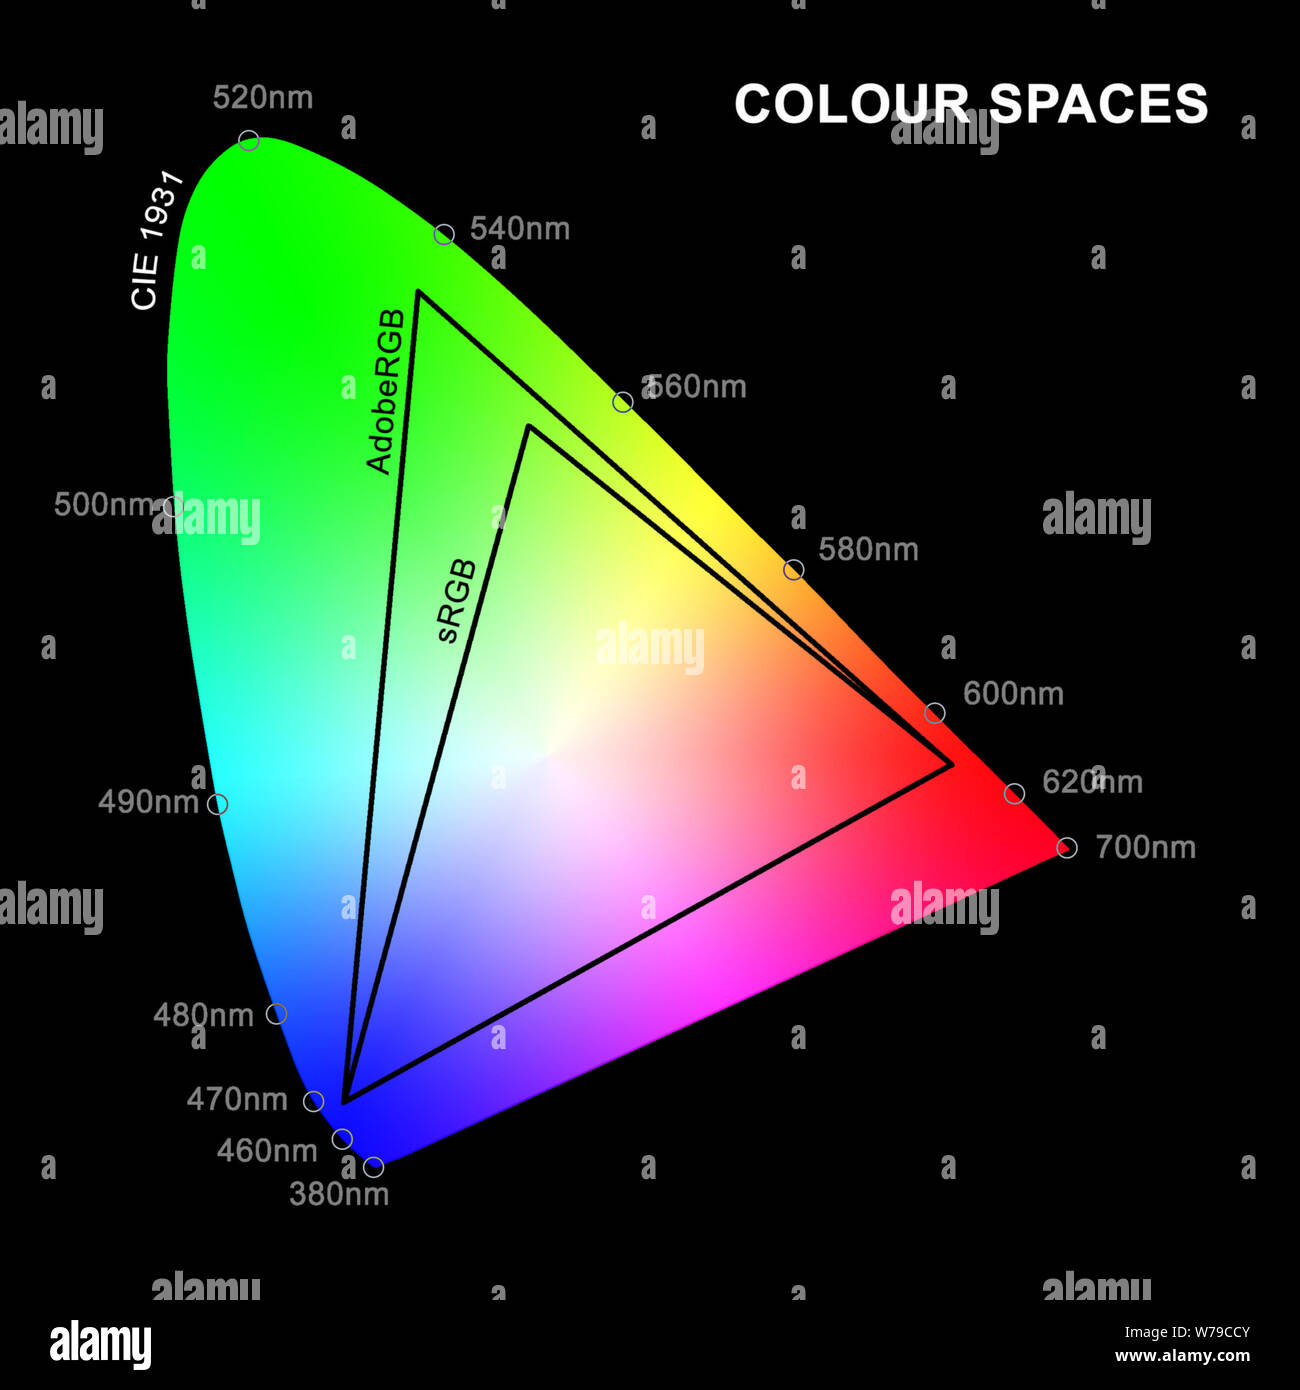 An illustration of sRGB and AdobeRGB colour spaces overlaid on CIE 1931 Chromaticity Diagram of human colour perception Stock Photohttps://www.alamy.com/image-license-details/?v=1https://www.alamy.com/an-illustration-of-srgb-and-adobergb-colour-spaces-overlaid-on-cie-1931-chromaticity-diagram-of-human-colour-perception-image262665451.html
RMW79CCY–An illustration of sRGB and AdobeRGB colour spaces overlaid on CIE 1931 Chromaticity Diagram of human colour perception
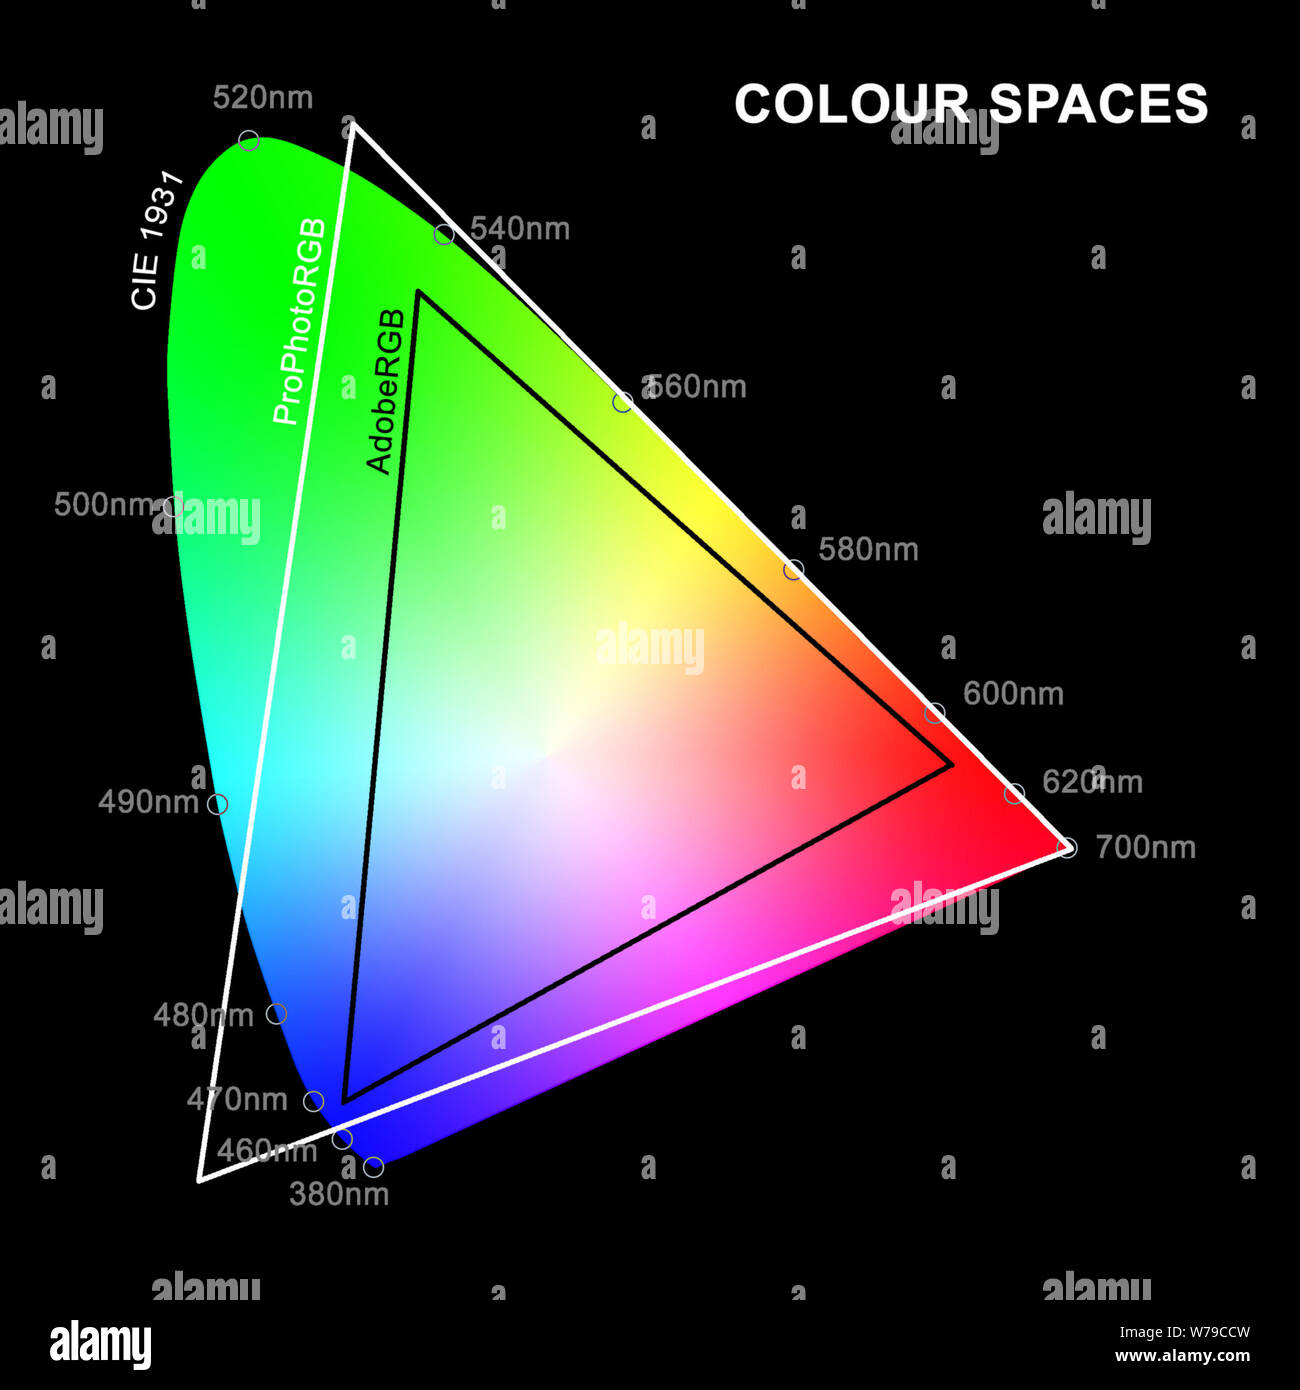 An illustration of AdobeRGB and ProPhotoRGB colour spaces overlaid on CIE 1931 Chromaticity Diagram of human colour perception Stock Photohttps://www.alamy.com/image-license-details/?v=1https://www.alamy.com/an-illustration-of-adobergb-and-prophotorgb-colour-spaces-overlaid-on-cie-1931-chromaticity-diagram-of-human-colour-perception-image262665449.html
RMW79CCW–An illustration of AdobeRGB and ProPhotoRGB colour spaces overlaid on CIE 1931 Chromaticity Diagram of human colour perception
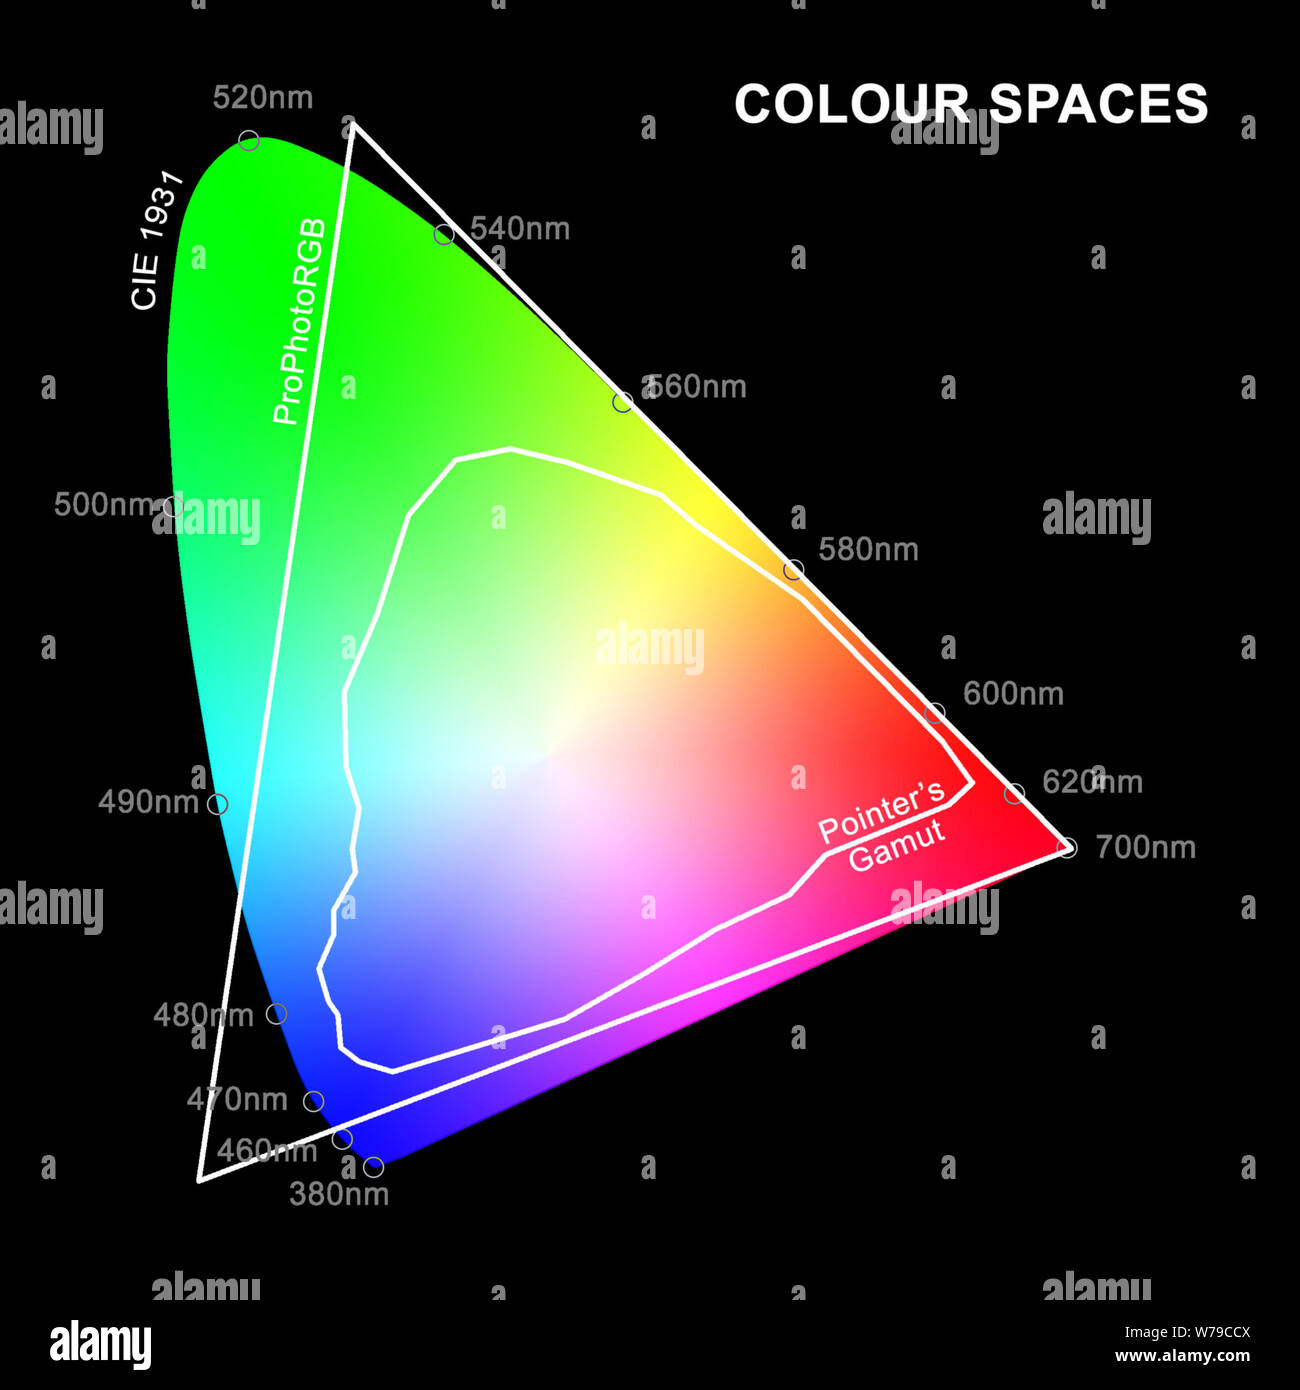 An illustration of ProPhotoRGB and Pointer's Gamut colour spaces overlaid on CIE 1931 Chromaticity Diagram of human colour perception. Stock Photohttps://www.alamy.com/image-license-details/?v=1https://www.alamy.com/an-illustration-of-prophotorgb-and-pointers-gamut-colour-spaces-overlaid-on-cie-1931-chromaticity-diagram-of-human-colour-perception-image262665450.html
RMW79CCX–An illustration of ProPhotoRGB and Pointer's Gamut colour spaces overlaid on CIE 1931 Chromaticity Diagram of human colour perception.
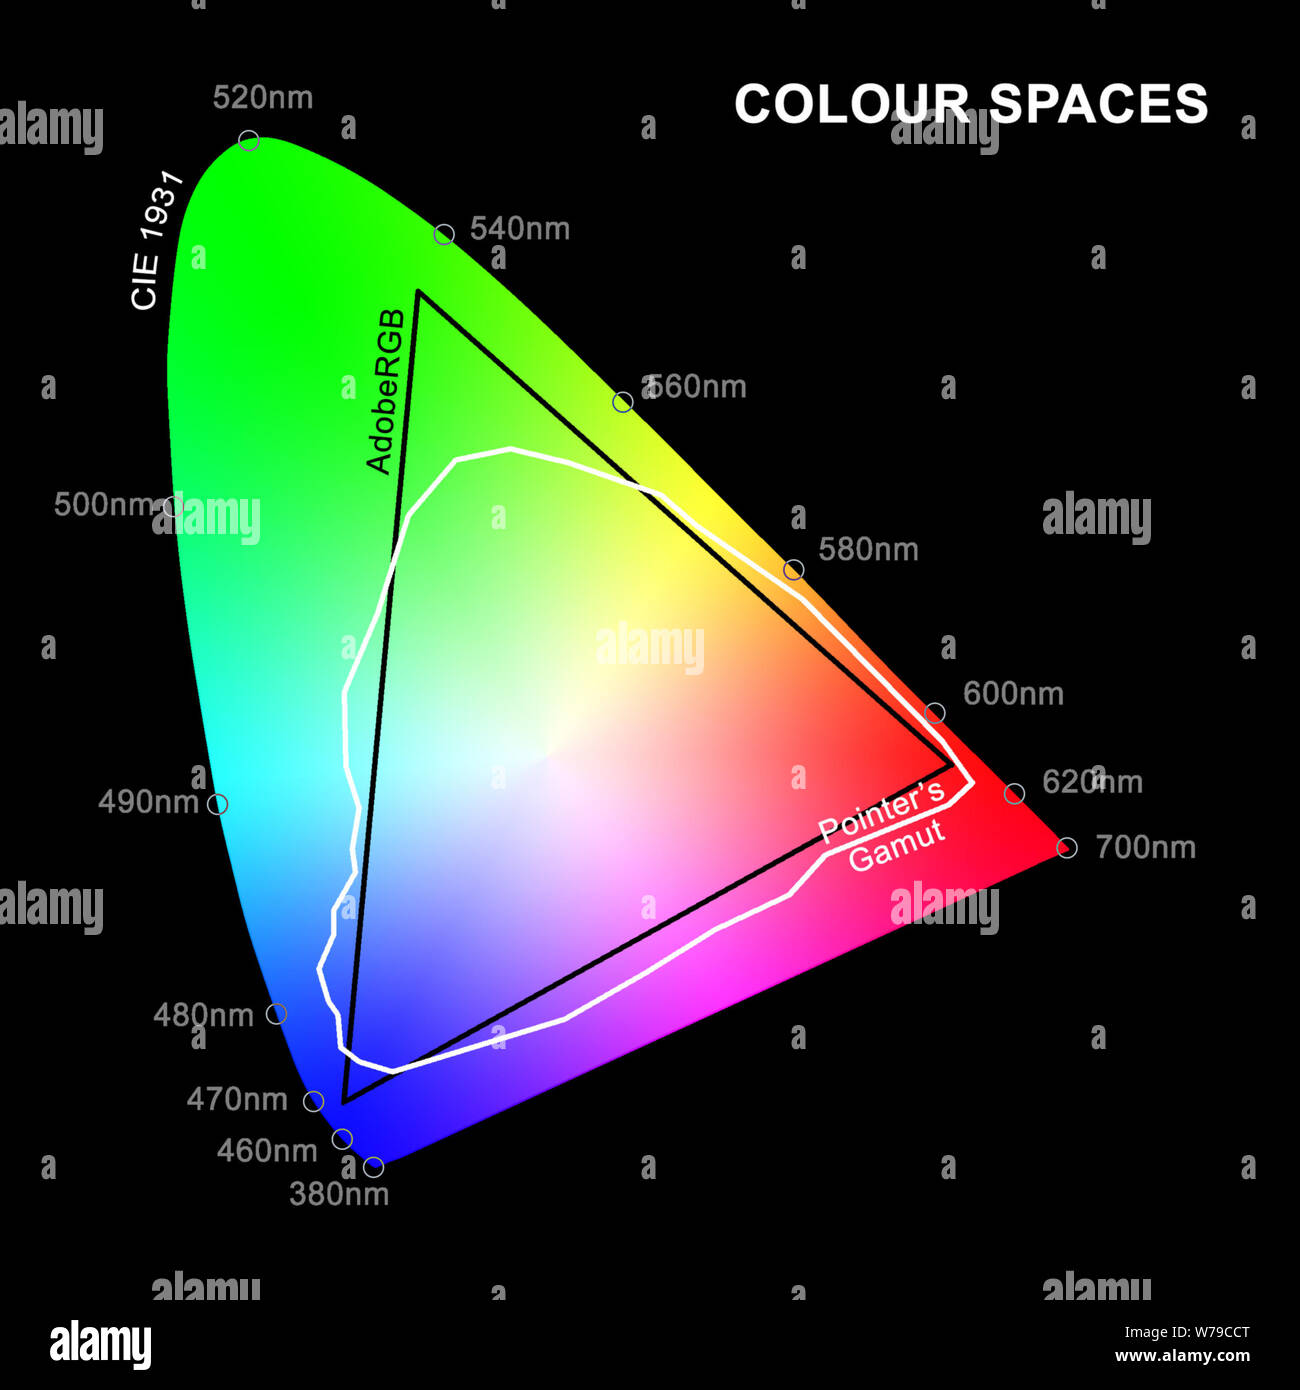 An illustration of AdobeRGB and Pointer's Gamut colour spaces overlaid on CIE 1931 Chromaticity Diagram of human colour perception. Stock Photohttps://www.alamy.com/image-license-details/?v=1https://www.alamy.com/an-illustration-of-adobergb-and-pointers-gamut-colour-spaces-overlaid-on-cie-1931-chromaticity-diagram-of-human-colour-perception-image262665448.html
RMW79CCT–An illustration of AdobeRGB and Pointer's Gamut colour spaces overlaid on CIE 1931 Chromaticity Diagram of human colour perception.
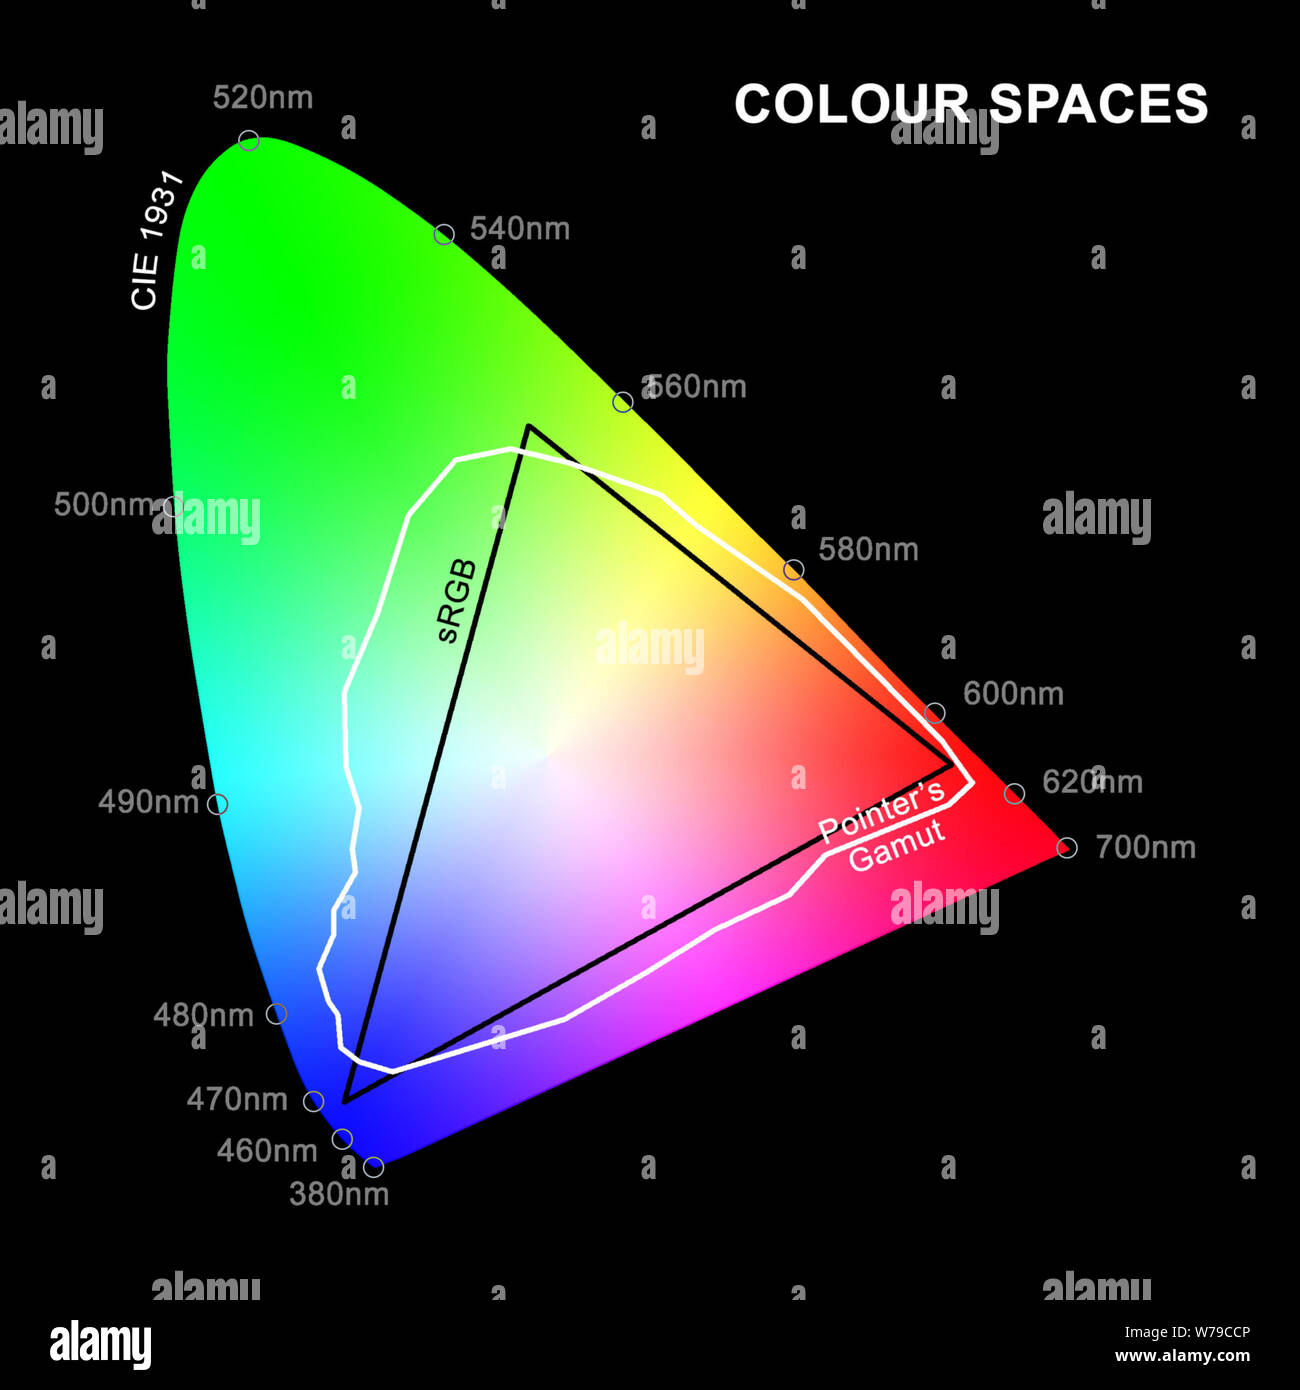 An illustration of sRGB and Pointer's Gamut colour spaces overlaid on CIE 1931 Chromaticity Diagram of human colour perception Stock Photohttps://www.alamy.com/image-license-details/?v=1https://www.alamy.com/an-illustration-of-srgb-and-pointers-gamut-colour-spaces-overlaid-on-cie-1931-chromaticity-diagram-of-human-colour-perception-image262665446.html
RMW79CCP–An illustration of sRGB and Pointer's Gamut colour spaces overlaid on CIE 1931 Chromaticity Diagram of human colour perception
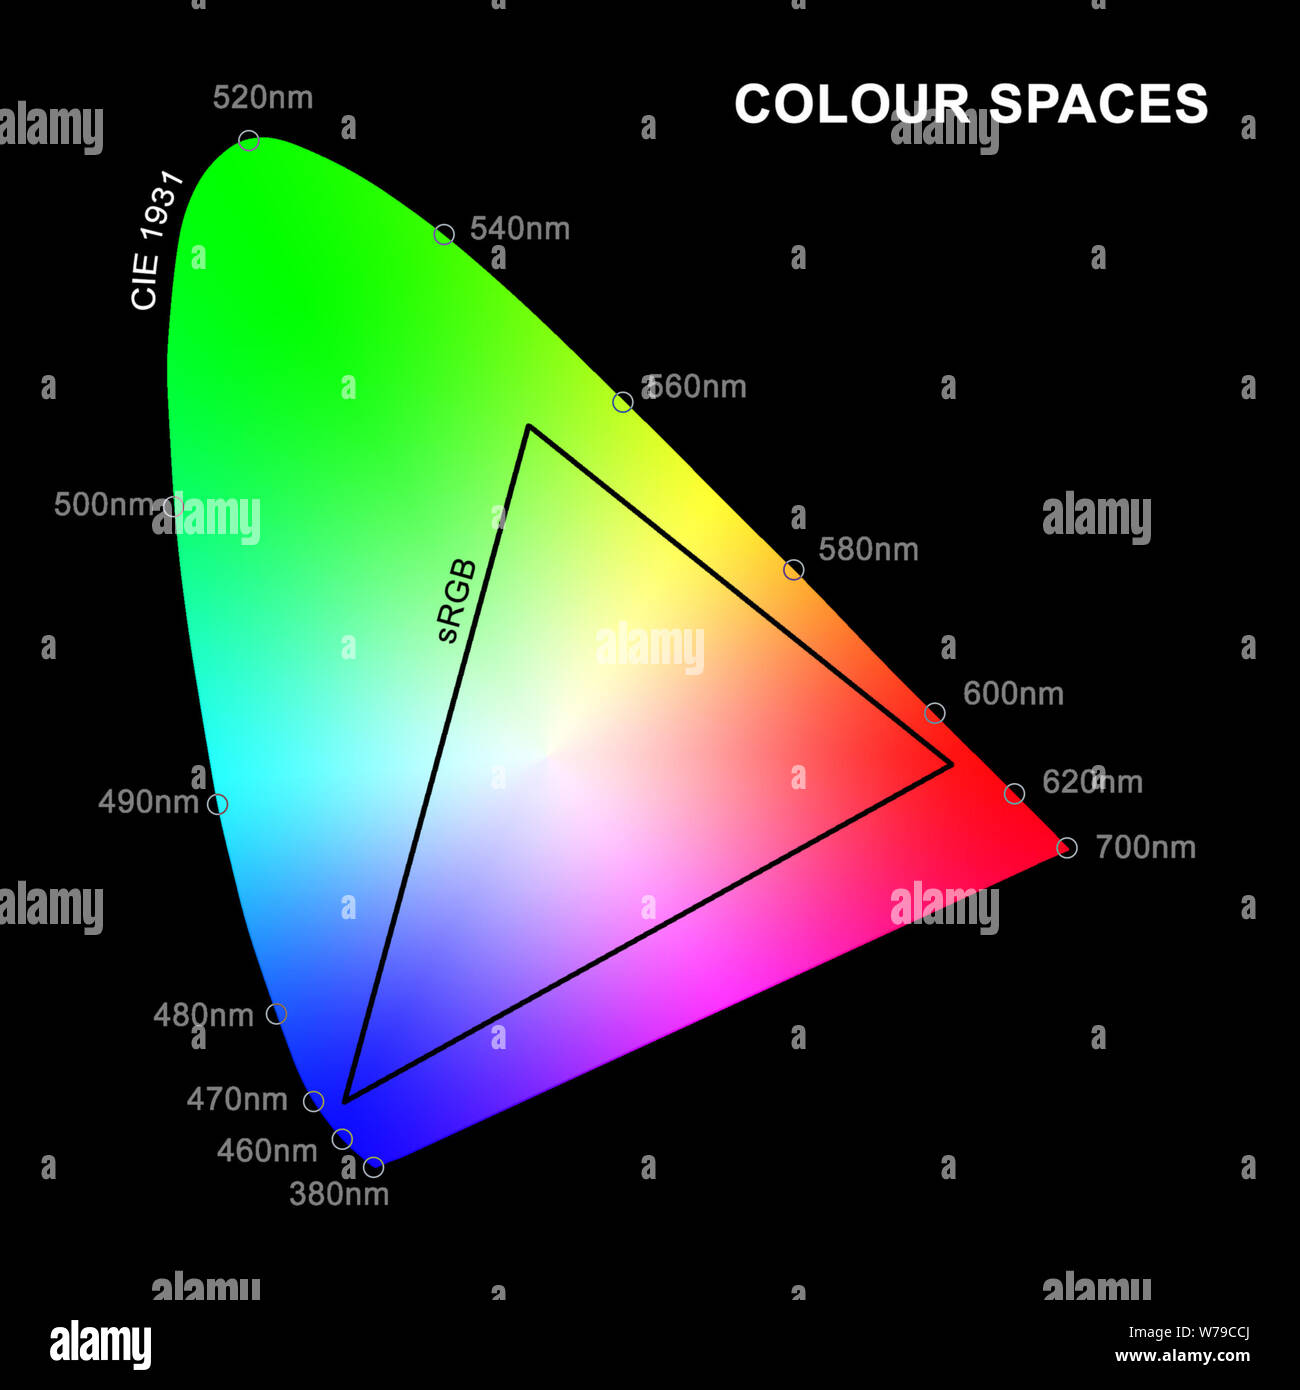 An illustration of sRGB colour space overlaid on CIE 1931 Chromaticity Diagram of human colour perception with wavelengths in nm. Stock Photohttps://www.alamy.com/image-license-details/?v=1https://www.alamy.com/an-illustration-of-srgb-colour-space-overlaid-on-cie-1931-chromaticity-diagram-of-human-colour-perception-with-wavelengths-in-nm-image262665442.html
RMW79CCJ–An illustration of sRGB colour space overlaid on CIE 1931 Chromaticity Diagram of human colour perception with wavelengths in nm.
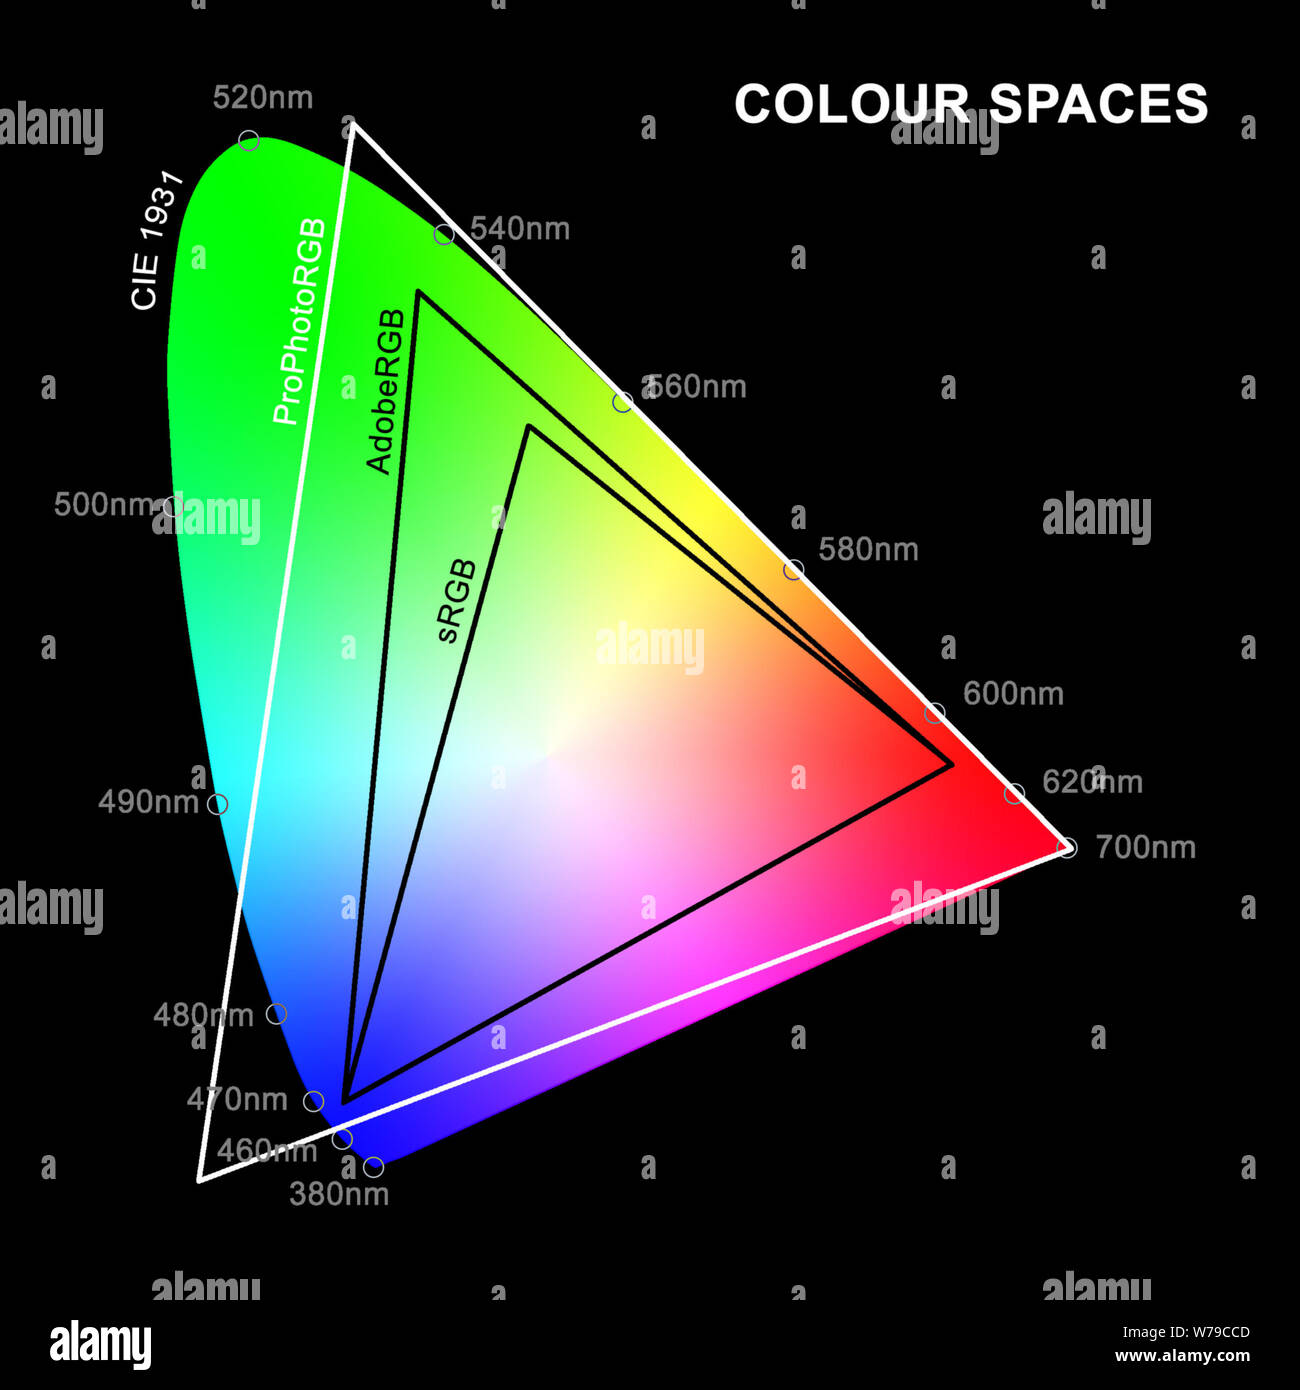 An illustration of sRGB, AdobeRGB and ProPhotoRGB colour spaces overlaid on CIE 1931 Chromaticity Diagram of human colour perception with wavelengths. Stock Photohttps://www.alamy.com/image-license-details/?v=1https://www.alamy.com/an-illustration-of-srgb-adobergb-and-prophotorgb-colour-spaces-overlaid-on-cie-1931-chromaticity-diagram-of-human-colour-perception-with-wavelengths-image262665437.html
RMW79CCD–An illustration of sRGB, AdobeRGB and ProPhotoRGB colour spaces overlaid on CIE 1931 Chromaticity Diagram of human colour perception with wavelengths.
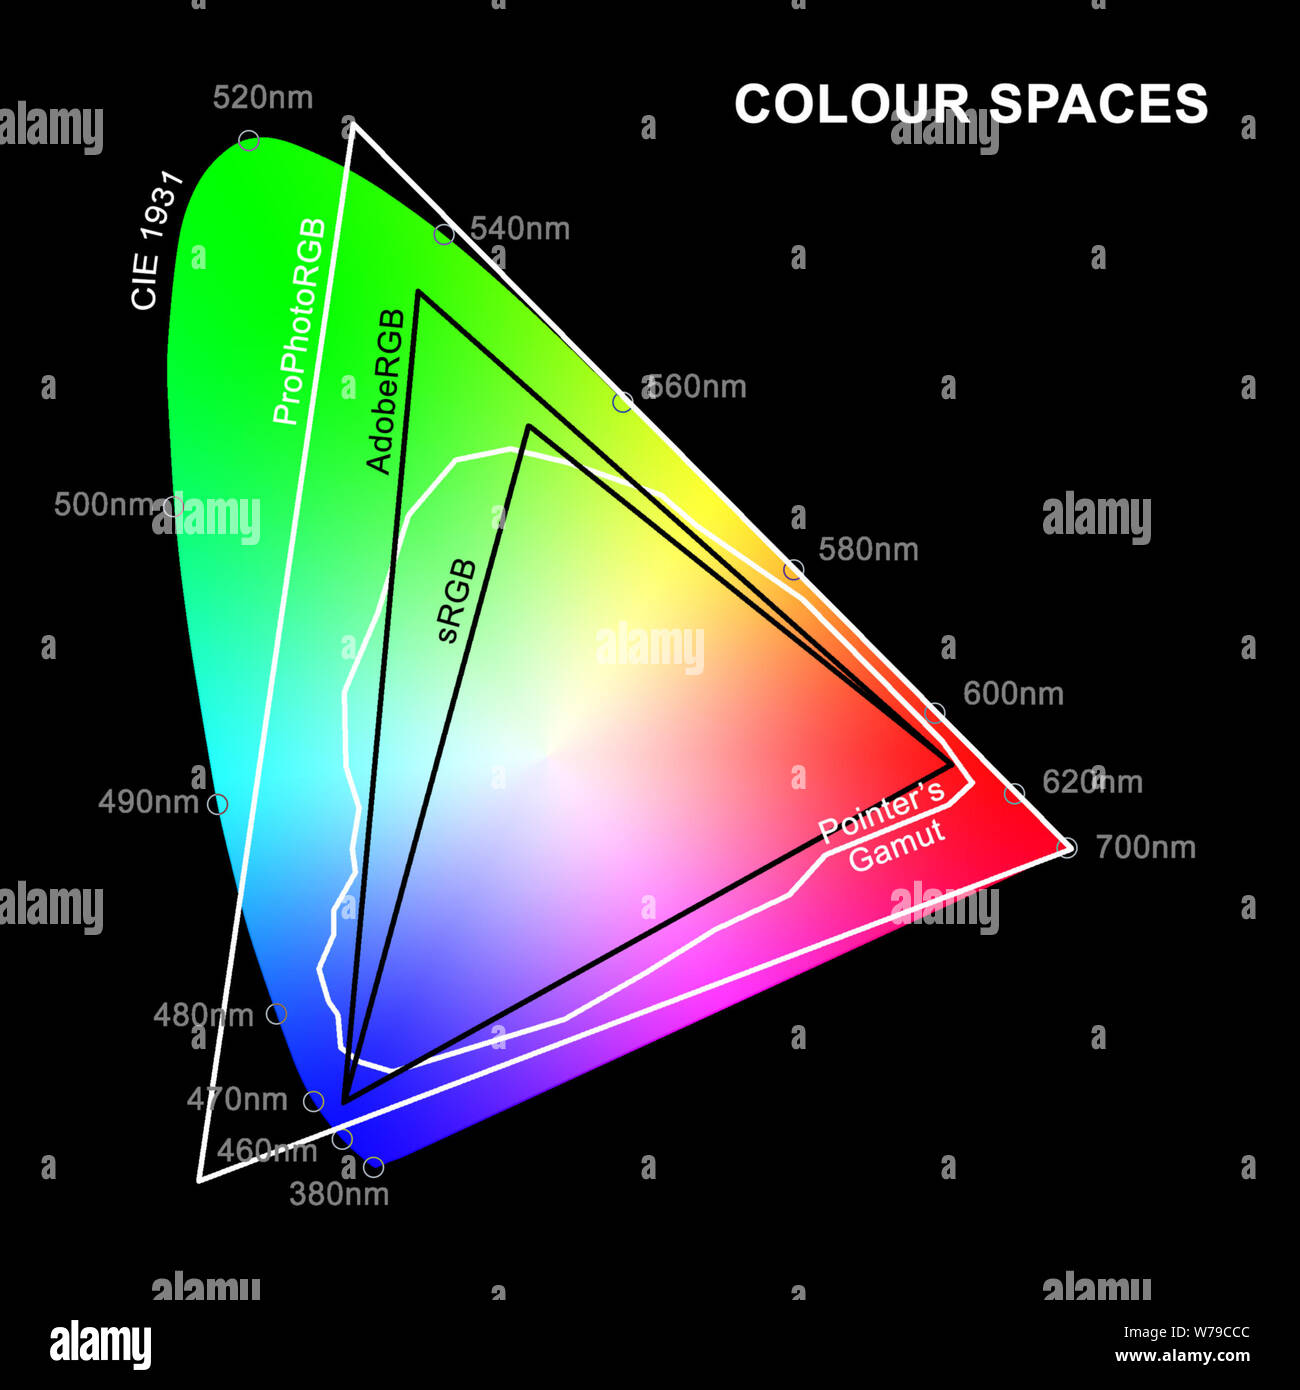 An illustration of sRGB, AdobeRGB, ProPhotoRGB and Pointer's Gamut colour spaces overlaid on CIE 1931 Chromaticity Diagram of human colour perception Stock Photohttps://www.alamy.com/image-license-details/?v=1https://www.alamy.com/an-illustration-of-srgb-adobergb-prophotorgb-and-pointers-gamut-colour-spaces-overlaid-on-cie-1931-chromaticity-diagram-of-human-colour-perception-image262665436.html
RMW79CCC–An illustration of sRGB, AdobeRGB, ProPhotoRGB and Pointer's Gamut colour spaces overlaid on CIE 1931 Chromaticity Diagram of human colour perception