Pie charts flat Cut Out Stock Images
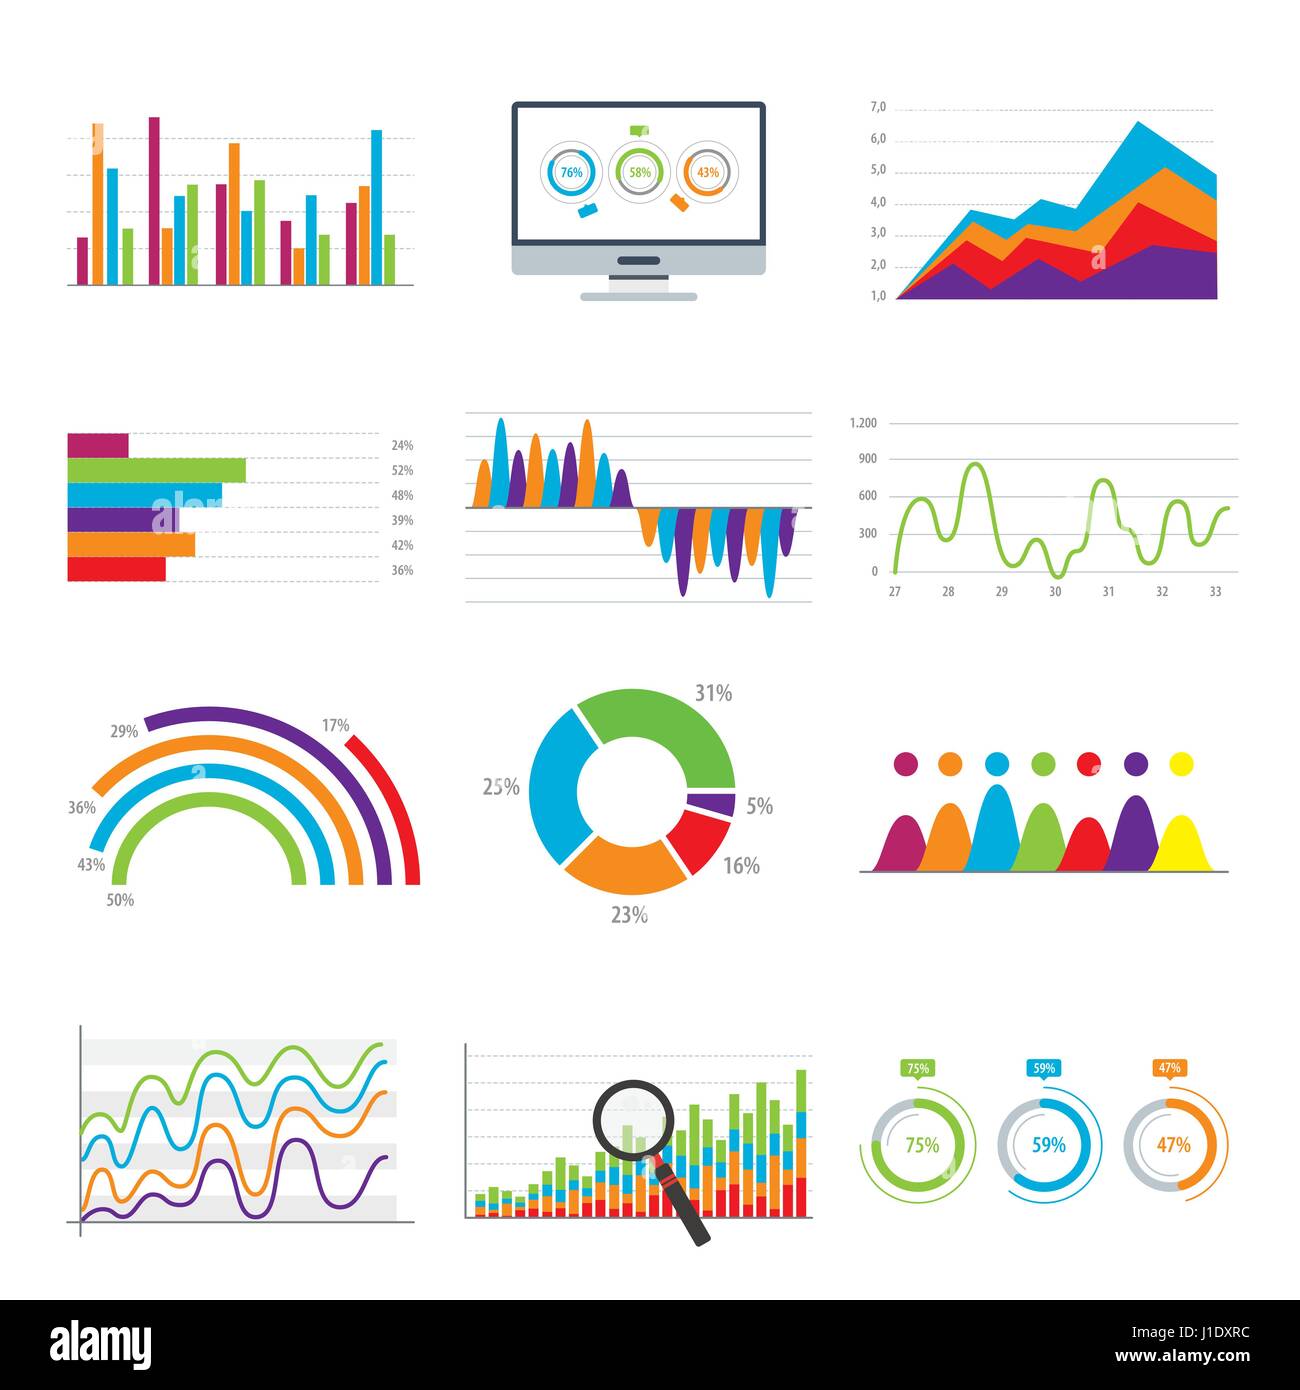 Business data market elements bar pie charts diagrams and graphs flat icons in vector illustration. Stock Vectorhttps://www.alamy.com/image-license-details/?v=1https://www.alamy.com/stock-photo-business-data-market-elements-bar-pie-charts-diagrams-and-graphs-flat-138604016.html
RFJ1DXRC–Business data market elements bar pie charts diagrams and graphs flat icons in vector illustration.
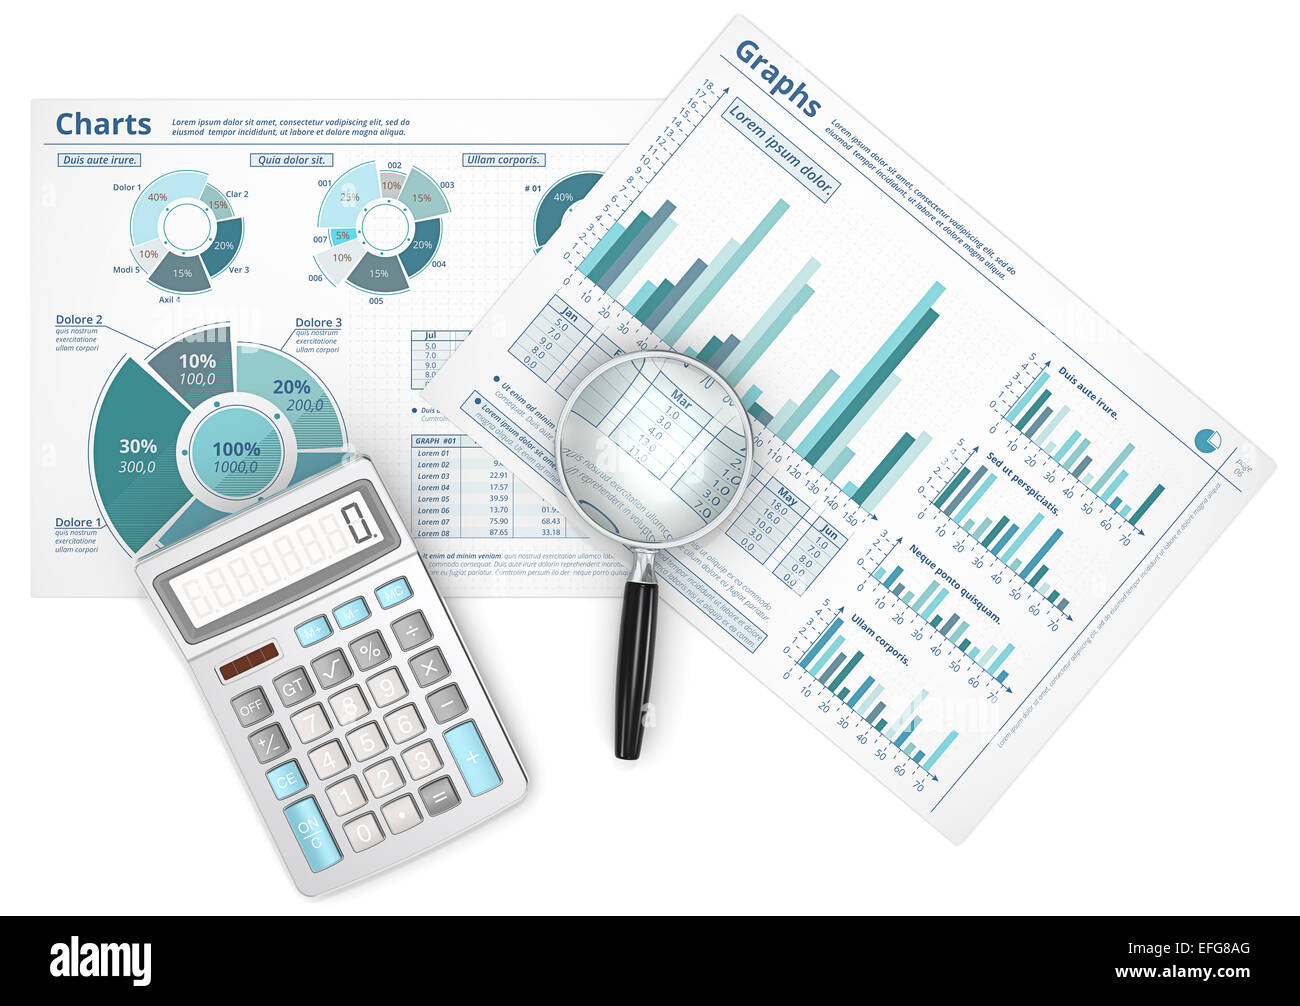 Business data infographics with magnifying glass and calculator. Stock Photohttps://www.alamy.com/image-license-details/?v=1https://www.alamy.com/stock-photo-business-data-infographics-with-magnifying-glass-and-calculator-78419112.html
RFEFG8AG–Business data infographics with magnifying glass and calculator.
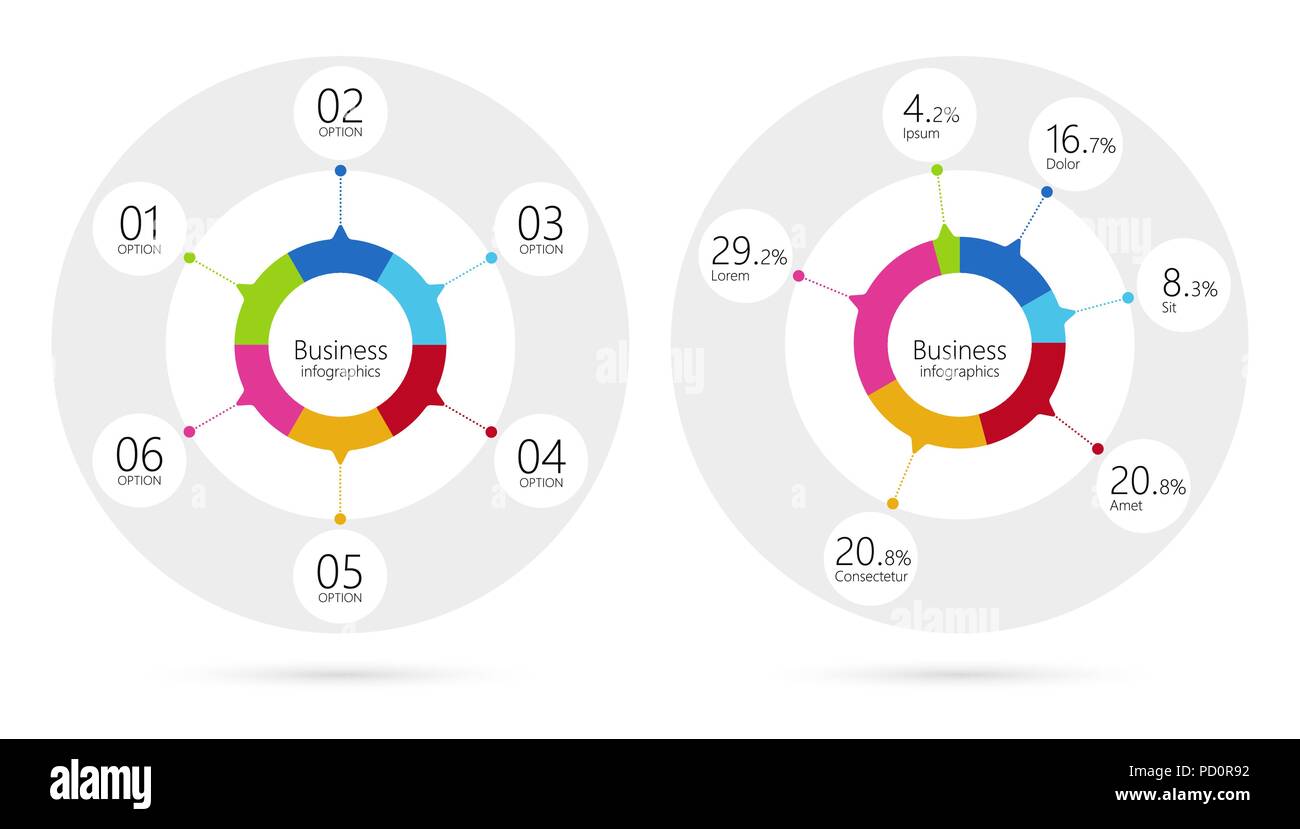 Modern infographic template pie charts with 6 steps. Business circle template with options for brochure, diagram, workflow, timeline. Vector EPS 10 Stock Vectorhttps://www.alamy.com/image-license-details/?v=1https://www.alamy.com/modern-infographic-template-pie-charts-with-6-steps-business-circle-template-with-options-for-brochure-diagram-workflow-timeline-vector-eps-10-image214533230.html
RFPD0R92–Modern infographic template pie charts with 6 steps. Business circle template with options for brochure, diagram, workflow, timeline. Vector EPS 10
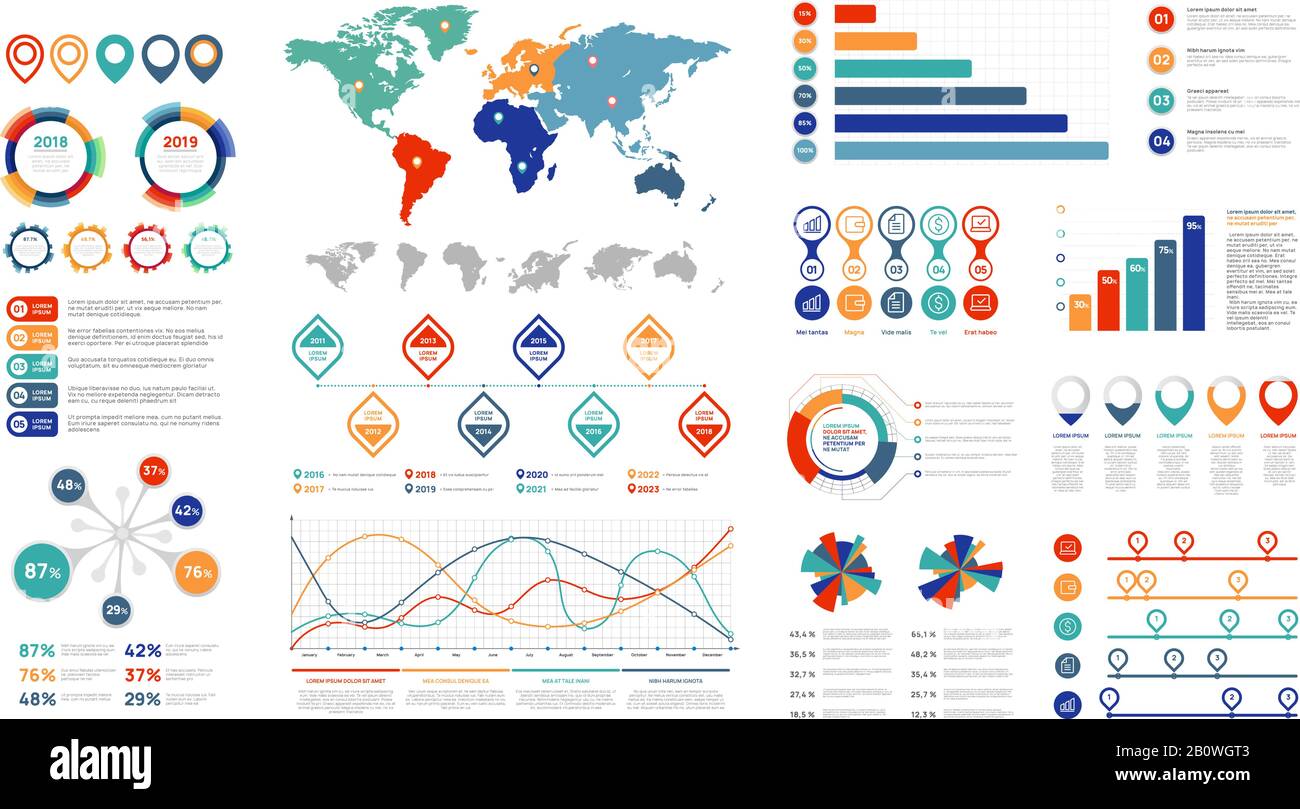 Flat infographic elements. Presentation chart element, percent graph banner and infograph flowchart. Charts for infographics vector set Stock Vectorhttps://www.alamy.com/image-license-details/?v=1https://www.alamy.com/flat-infographic-elements-presentation-chart-element-percent-graph-banner-and-infograph-flowchart-charts-for-infographics-vector-set-image344769379.html
RF2B0WGT3–Flat infographic elements. Presentation chart element, percent graph banner and infograph flowchart. Charts for infographics vector set
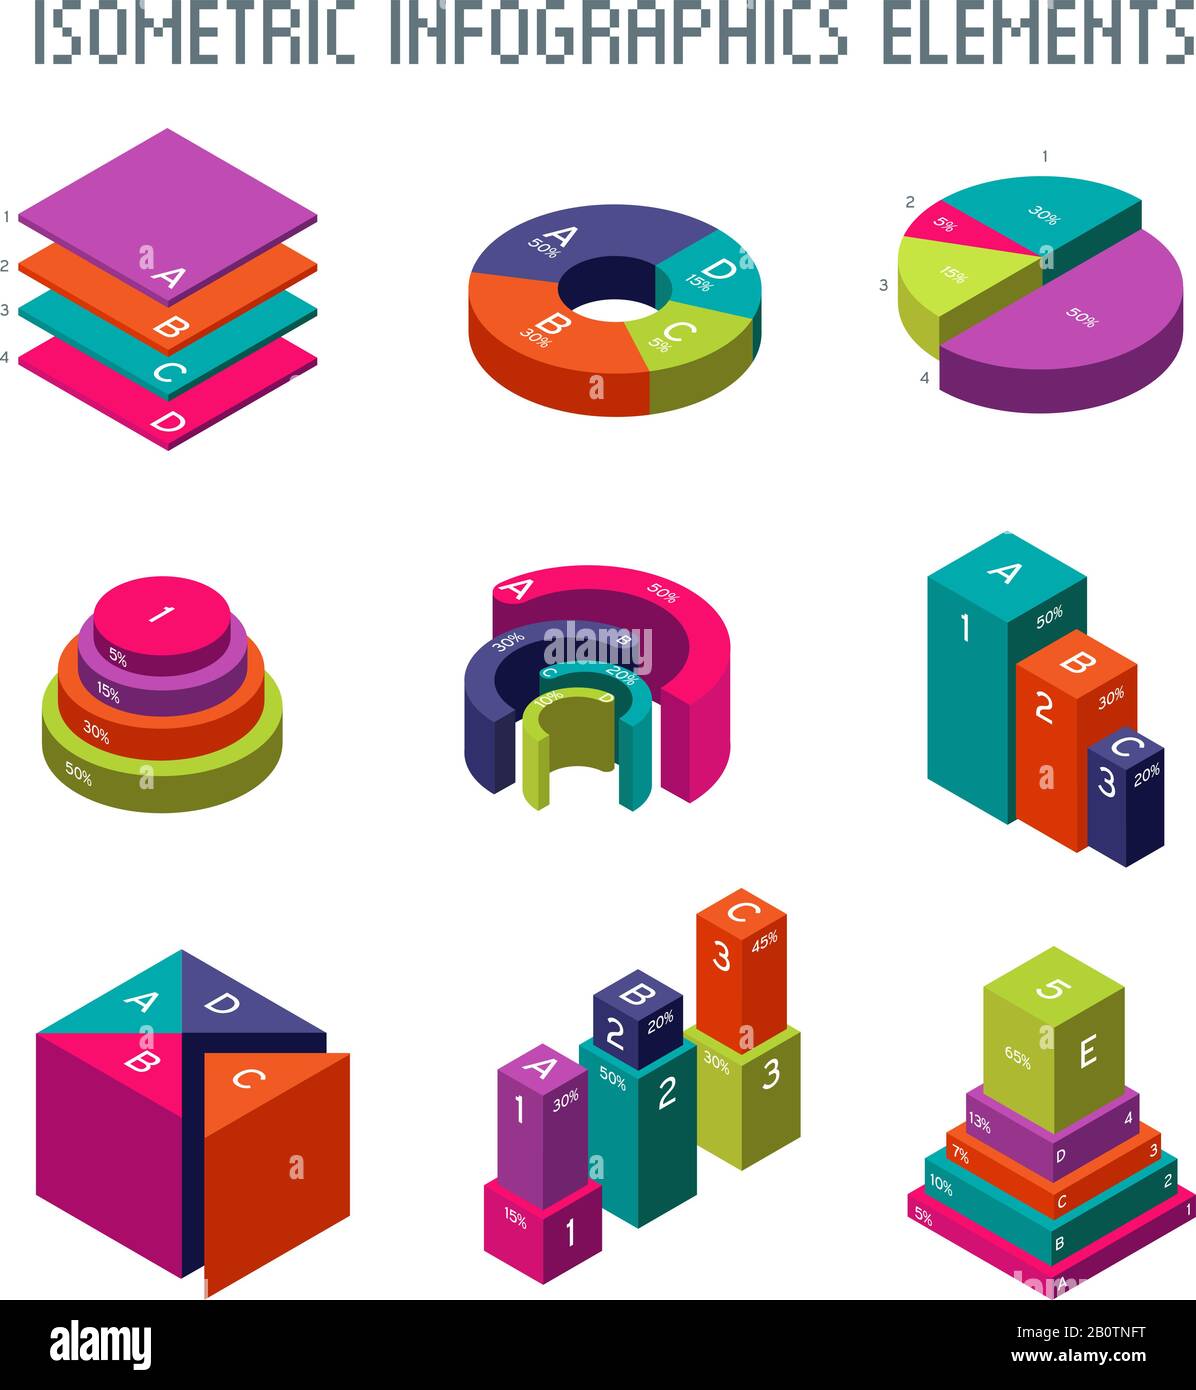 Infographic isometric vector elements. 3d pie graph, charts and progress bars. Graph and diagram statistic and progress isometric graphic illustration Stock Vectorhttps://www.alamy.com/image-license-details/?v=1https://www.alamy.com/infographic-isometric-vector-elements-3d-pie-graph-charts-and-progress-bars-graph-and-diagram-statistic-and-progress-isometric-graphic-illustration-image344751116.html
RF2B0TNFT–Infographic isometric vector elements. 3d pie graph, charts and progress bars. Graph and diagram statistic and progress isometric graphic illustration
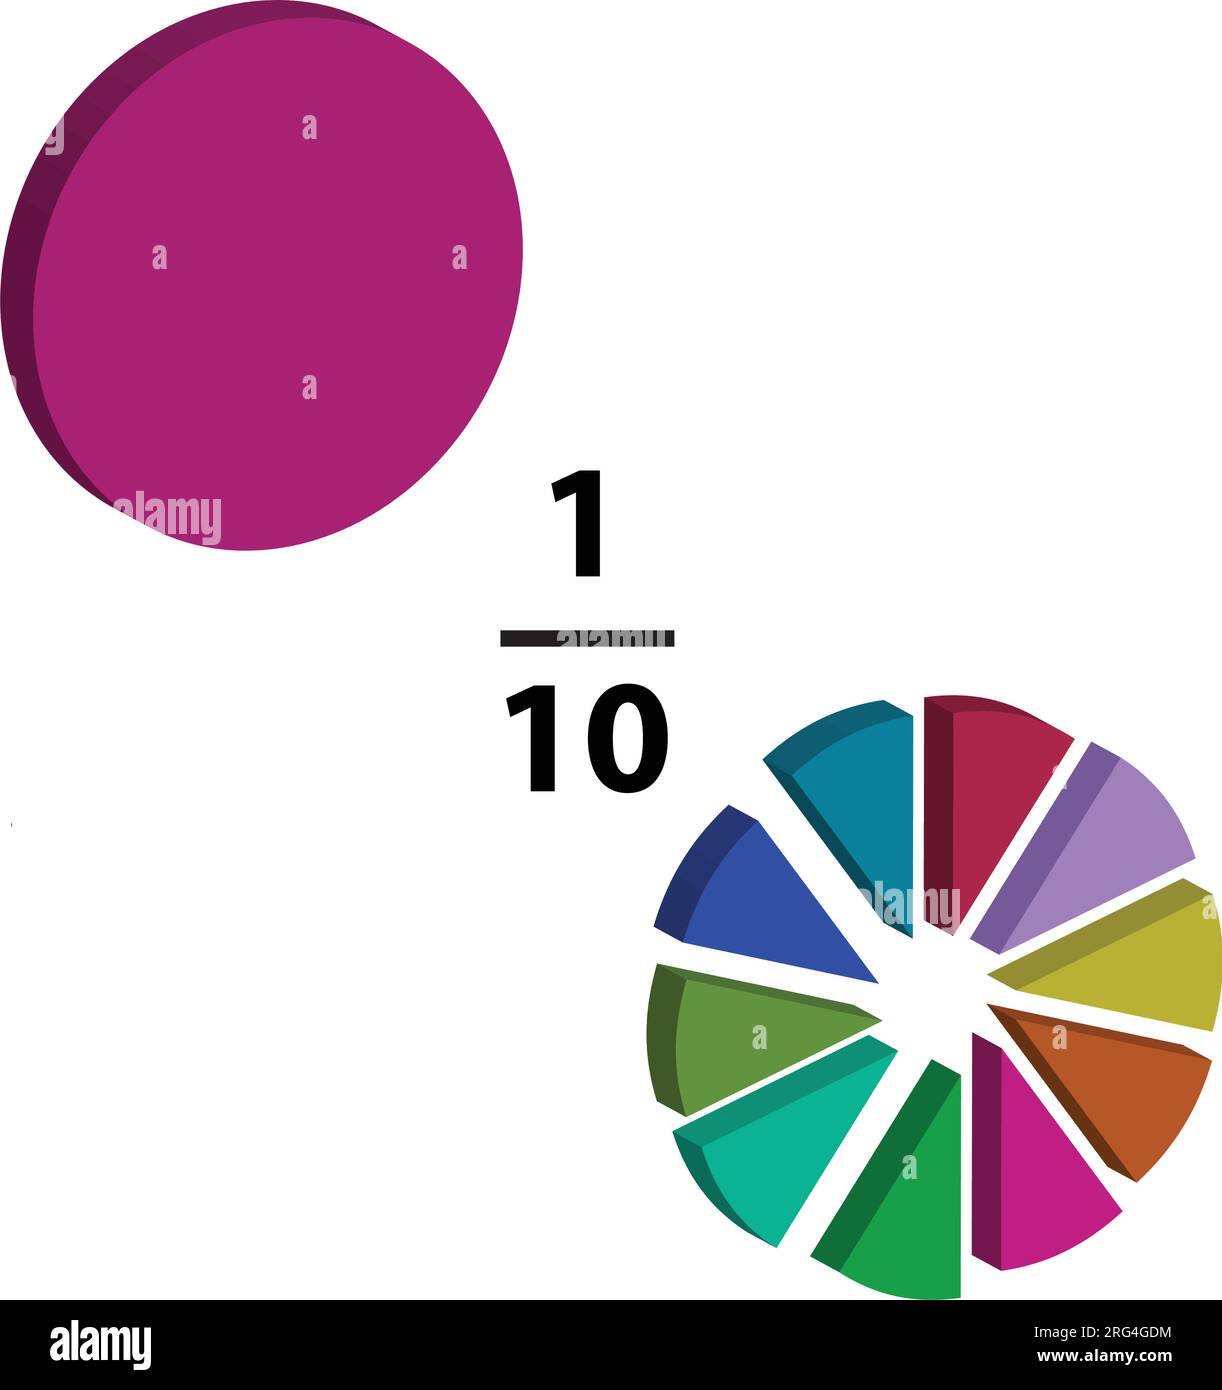 A fraction pie is divided into one-ten slice, each showing math fractions, explained in mathematics. on a white background. Stock Vectorhttps://www.alamy.com/image-license-details/?v=1https://www.alamy.com/a-fraction-pie-is-divided-into-one-ten-slice-each-showing-math-fractions-explained-in-mathematics-on-a-white-background-image560667008.html
RF2RG4GDM–A fraction pie is divided into one-ten slice, each showing math fractions, explained in mathematics. on a white background.
 Circles divided in monochrome grey segments from 3 to 12 with one separated fragment. Pie or donut charts. Statistics infographic examples. Round shapes cut in equal slices. Vector flat illustration Stock Vectorhttps://www.alamy.com/image-license-details/?v=1https://www.alamy.com/circles-divided-in-monochrome-grey-segments-from-3-to-12-with-one-separated-fragment-pie-or-donut-charts-statistics-infographic-examples-round-shapes-cut-in-equal-slices-vector-flat-illustration-image485047419.html
RF2K53PX3–Circles divided in monochrome grey segments from 3 to 12 with one separated fragment. Pie or donut charts. Statistics infographic examples. Round shapes cut in equal slices. Vector flat illustration
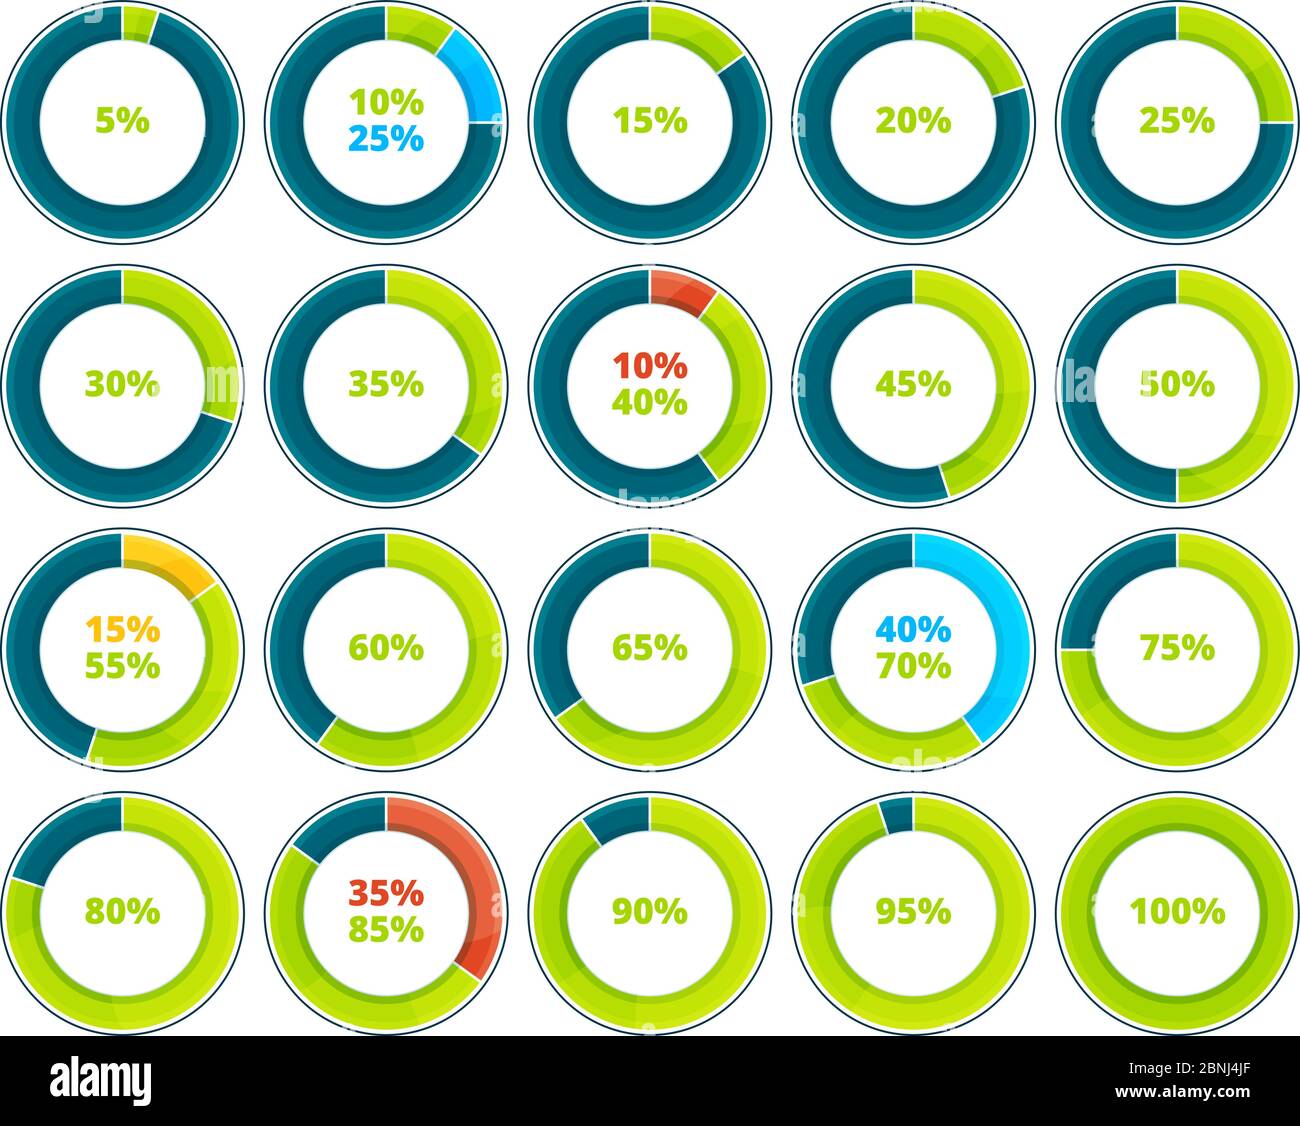 Charts and pie graphs. Vector infographics Stock Vectorhttps://www.alamy.com/image-license-details/?v=1https://www.alamy.com/charts-and-pie-graphs-vector-infographics-image357513927.html
RF2BNJ4JF–Charts and pie graphs. Vector infographics
RF2HYR8BA–Pie chart icon. Charts. Statistics. Editable vector.
 3D business charts coming out of a flat screen television. Stock Vectorhttps://www.alamy.com/image-license-details/?v=1https://www.alamy.com/3d-business-charts-coming-out-of-a-flat-screen-television-image554996080.html
RF2R6X74G–3D business charts coming out of a flat screen television.
 Businessman in blue suit shows a poster with growing charts. Growth concept - success business, increase sales. Flat style vector clip art on white ba Stock Vectorhttps://www.alamy.com/image-license-details/?v=1https://www.alamy.com/businessman-in-blue-suit-shows-a-poster-with-growing-charts-growth-concept-success-business-increase-sales-flat-style-vector-clip-art-on-white-ba-image376537711.html
RF2CTGNKB–Businessman in blue suit shows a poster with growing charts. Growth concept - success business, increase sales. Flat style vector clip art on white ba
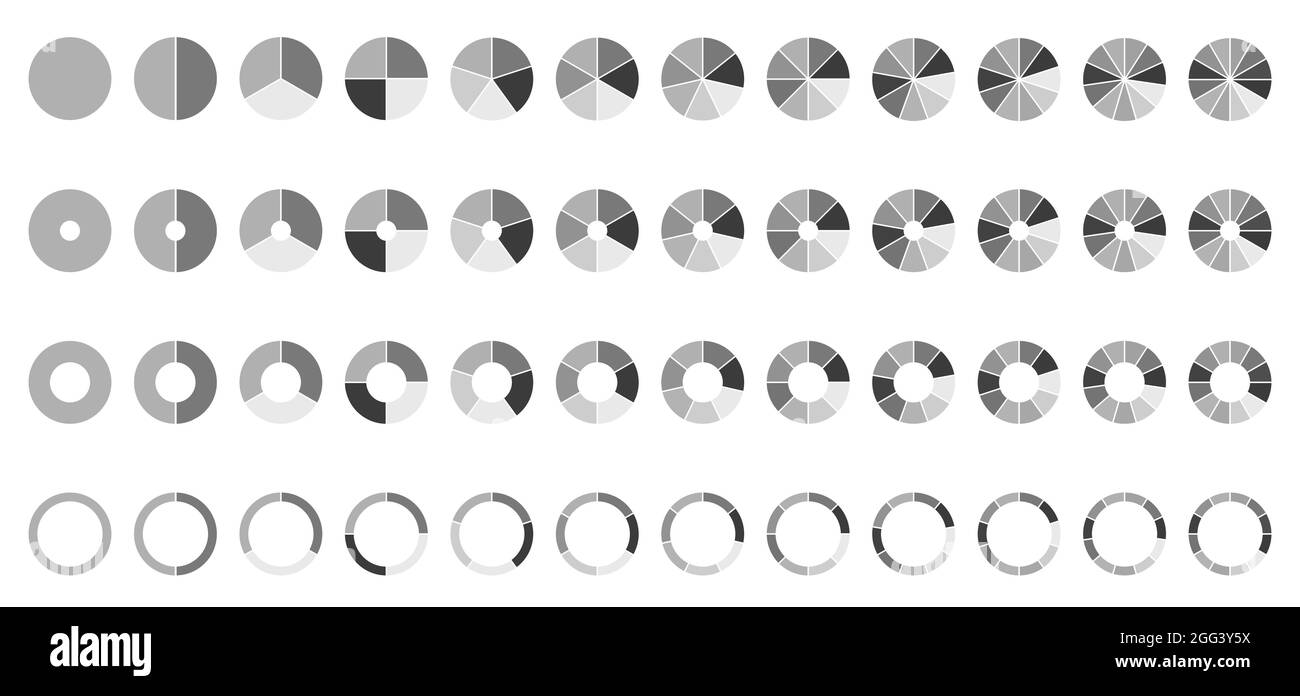 Circle pie charts. Round diagram. 2,3,4,5,6,7,8,9,10,11,12 sections or steps. Stock Vectorhttps://www.alamy.com/image-license-details/?v=1https://www.alamy.com/circle-pie-charts-round-diagram-23456789101112-sections-or-steps-image440180886.html
RF2GG3Y5X–Circle pie charts. Round diagram. 2,3,4,5,6,7,8,9,10,11,12 sections or steps.
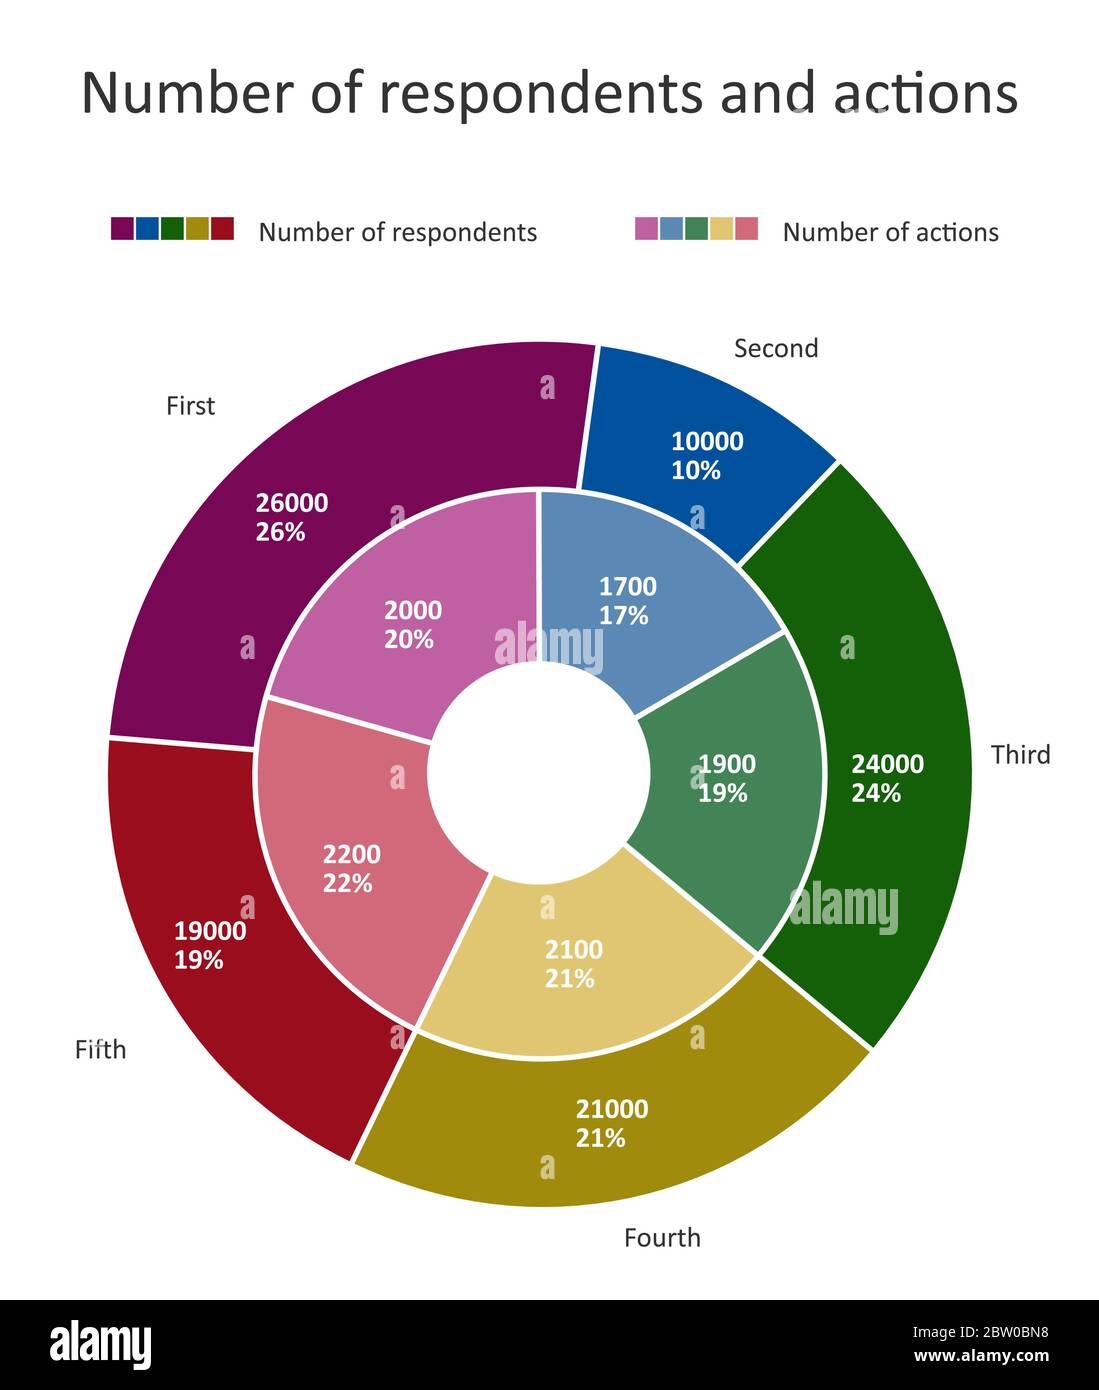 Double donut chart with percentages, one inside another. Pie chart with contrast colors on black background. Stock Vectorhttps://www.alamy.com/image-license-details/?v=1https://www.alamy.com/double-donut-chart-with-percentages-one-inside-another-pie-chart-with-contrast-colors-on-black-background-image359582980.html
RF2BW0BN8–Double donut chart with percentages, one inside another. Pie chart with contrast colors on black background.
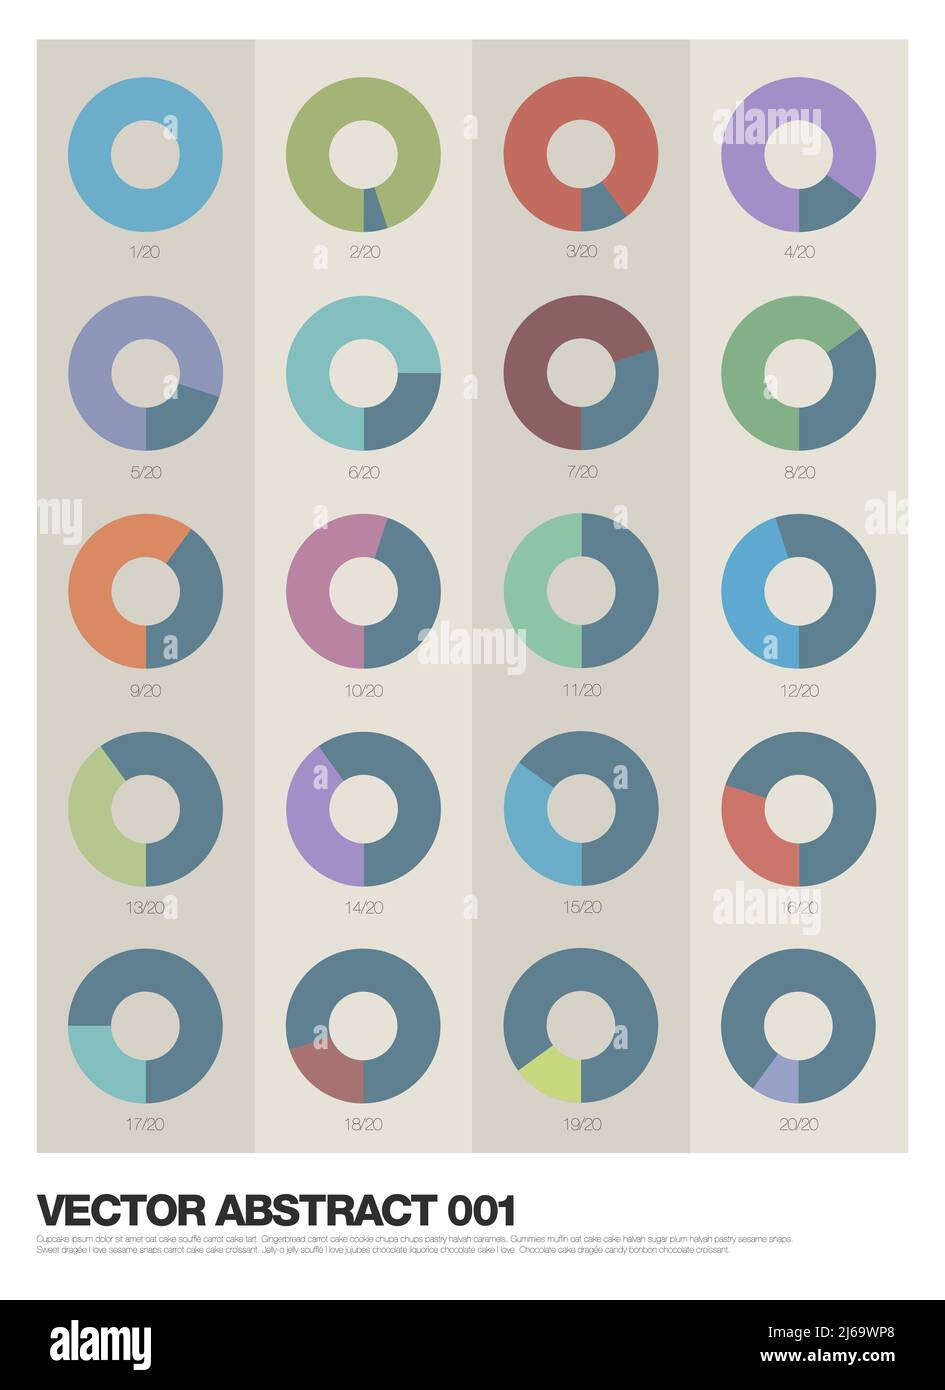 Abstract Background made from colorful rows of different infographic diagram pie charts. Stock vector illustration. Stock Photohttps://www.alamy.com/image-license-details/?v=1https://www.alamy.com/abstract-background-made-from-colorful-rows-of-different-infographic-diagram-pie-charts-stock-vector-illustration-image468585664.html
RF2J69WP8–Abstract Background made from colorful rows of different infographic diagram pie charts. Stock vector illustration.
 Business analytics flat vector illustration. Marketing metrics, data analysis, financial audit concept. Pie charts and diagrams analyzing. flat vector Stock Vectorhttps://www.alamy.com/image-license-details/?v=1https://www.alamy.com/business-analytics-flat-vector-illustration-marketing-metrics-data-analysis-financial-audit-concept-pie-charts-and-diagrams-analyzing-flat-vector-image491748678.html
RF2KG12CP–Business analytics flat vector illustration. Marketing metrics, data analysis, financial audit concept. Pie charts and diagrams analyzing. flat vector
RFME1JEA–Data analysis pie chart company logo design template, Business corporate vector icon
 Pie chart element, business infographic round diagram Stock Vectorhttps://www.alamy.com/image-license-details/?v=1https://www.alamy.com/pie-chart-element-business-infographic-round-diagram-image179371113.html
RFMBR1K5–Pie chart element, business infographic round diagram
RF2XXMB8C–Business data market elements dot bar pie charts diagrams and graphs flat icons set isolated vector illustration.
 Colorful pie chart, diagram, Infographic. Vector illustration. Stock Vectorhttps://www.alamy.com/image-license-details/?v=1https://www.alamy.com/colorful-pie-chart-diagram-infographic-vector-illustration-image329919575.html
RF2A4N3NY–Colorful pie chart, diagram, Infographic. Vector illustration.
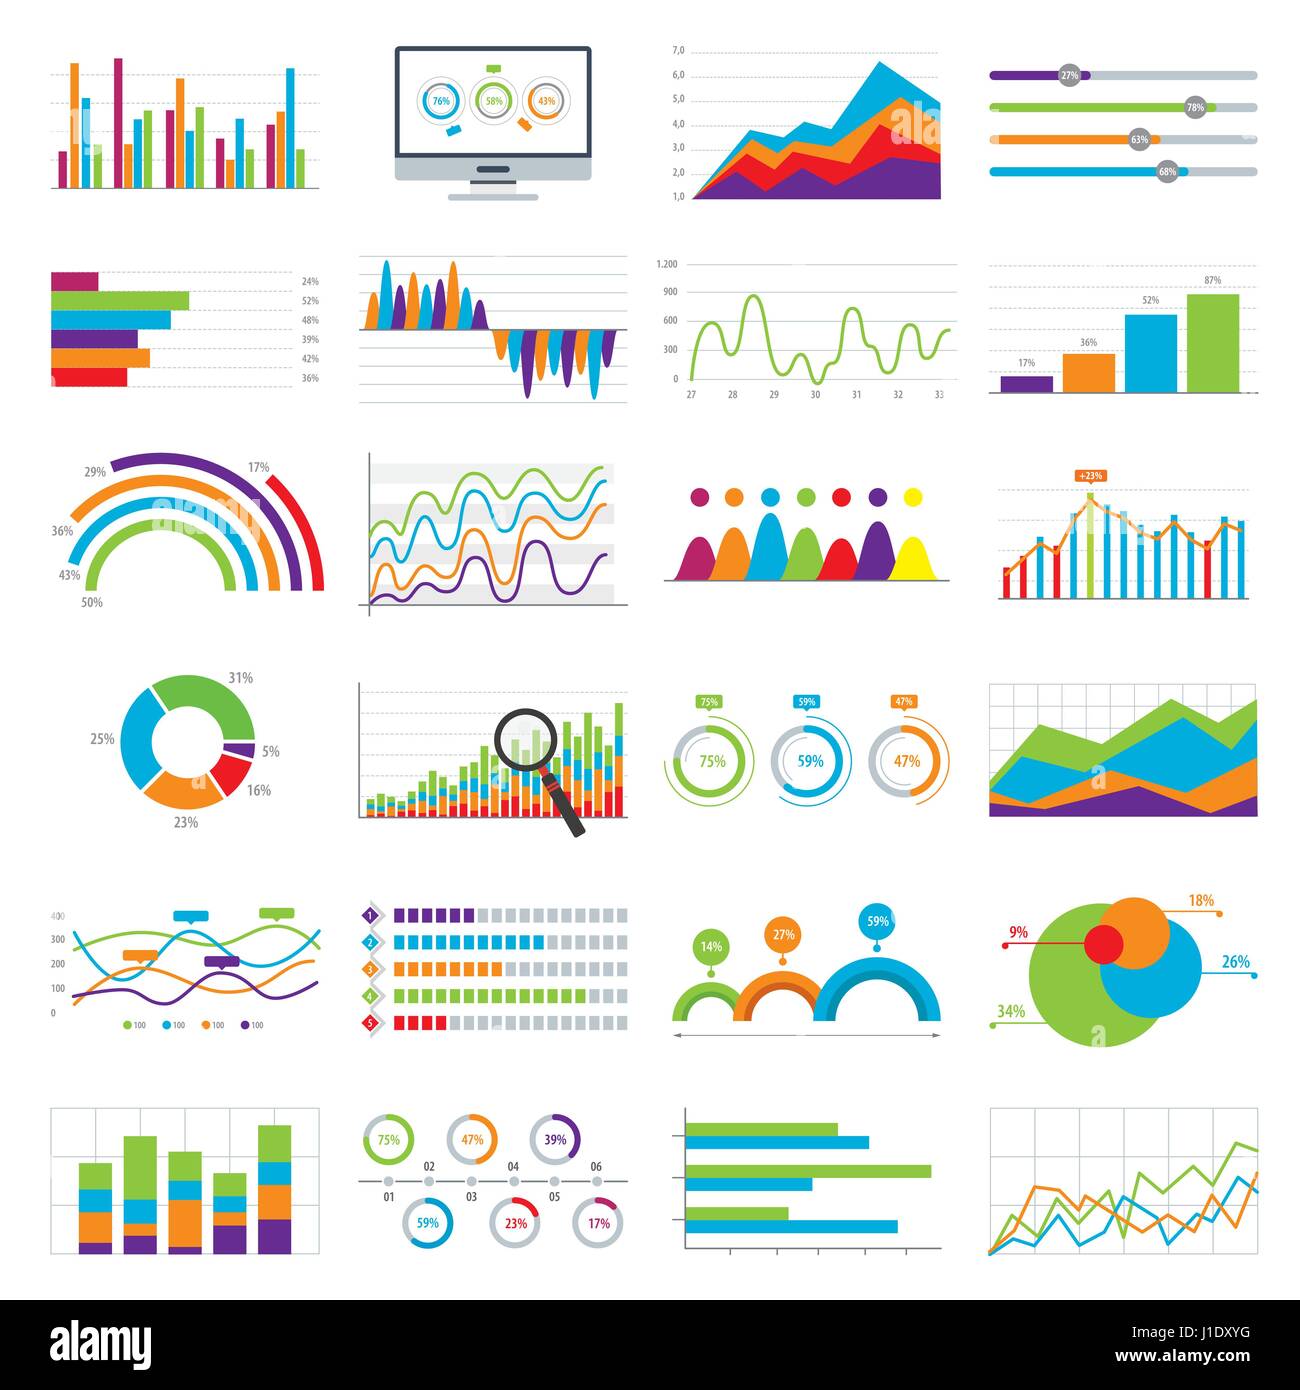 Business data market elements bar pie charts diagrams and graphs flat icons in vector illustration. Stock Vectorhttps://www.alamy.com/image-license-details/?v=1https://www.alamy.com/stock-photo-business-data-market-elements-bar-pie-charts-diagrams-and-graphs-flat-138604132.html
RFJ1DXYG–Business data market elements bar pie charts diagrams and graphs flat icons in vector illustration.
 Experienced Office Supervisor Candidate, Gives Presentations in Business Seminars, Uses Pie Charts and Column Charts, flat vector modern illustration Stock Vectorhttps://www.alamy.com/image-license-details/?v=1https://www.alamy.com/experienced-office-supervisor-candidate-gives-presentations-in-business-seminars-uses-pie-charts-and-column-charts-flat-vector-modern-illustration-image570874101.html
RF2T4NFMN–Experienced Office Supervisor Candidate, Gives Presentations in Business Seminars, Uses Pie Charts and Column Charts, flat vector modern illustration
RF2HE4239–Statistics - line icon set with editable stroke. Collection of 20 graphs, charts, diagrams.
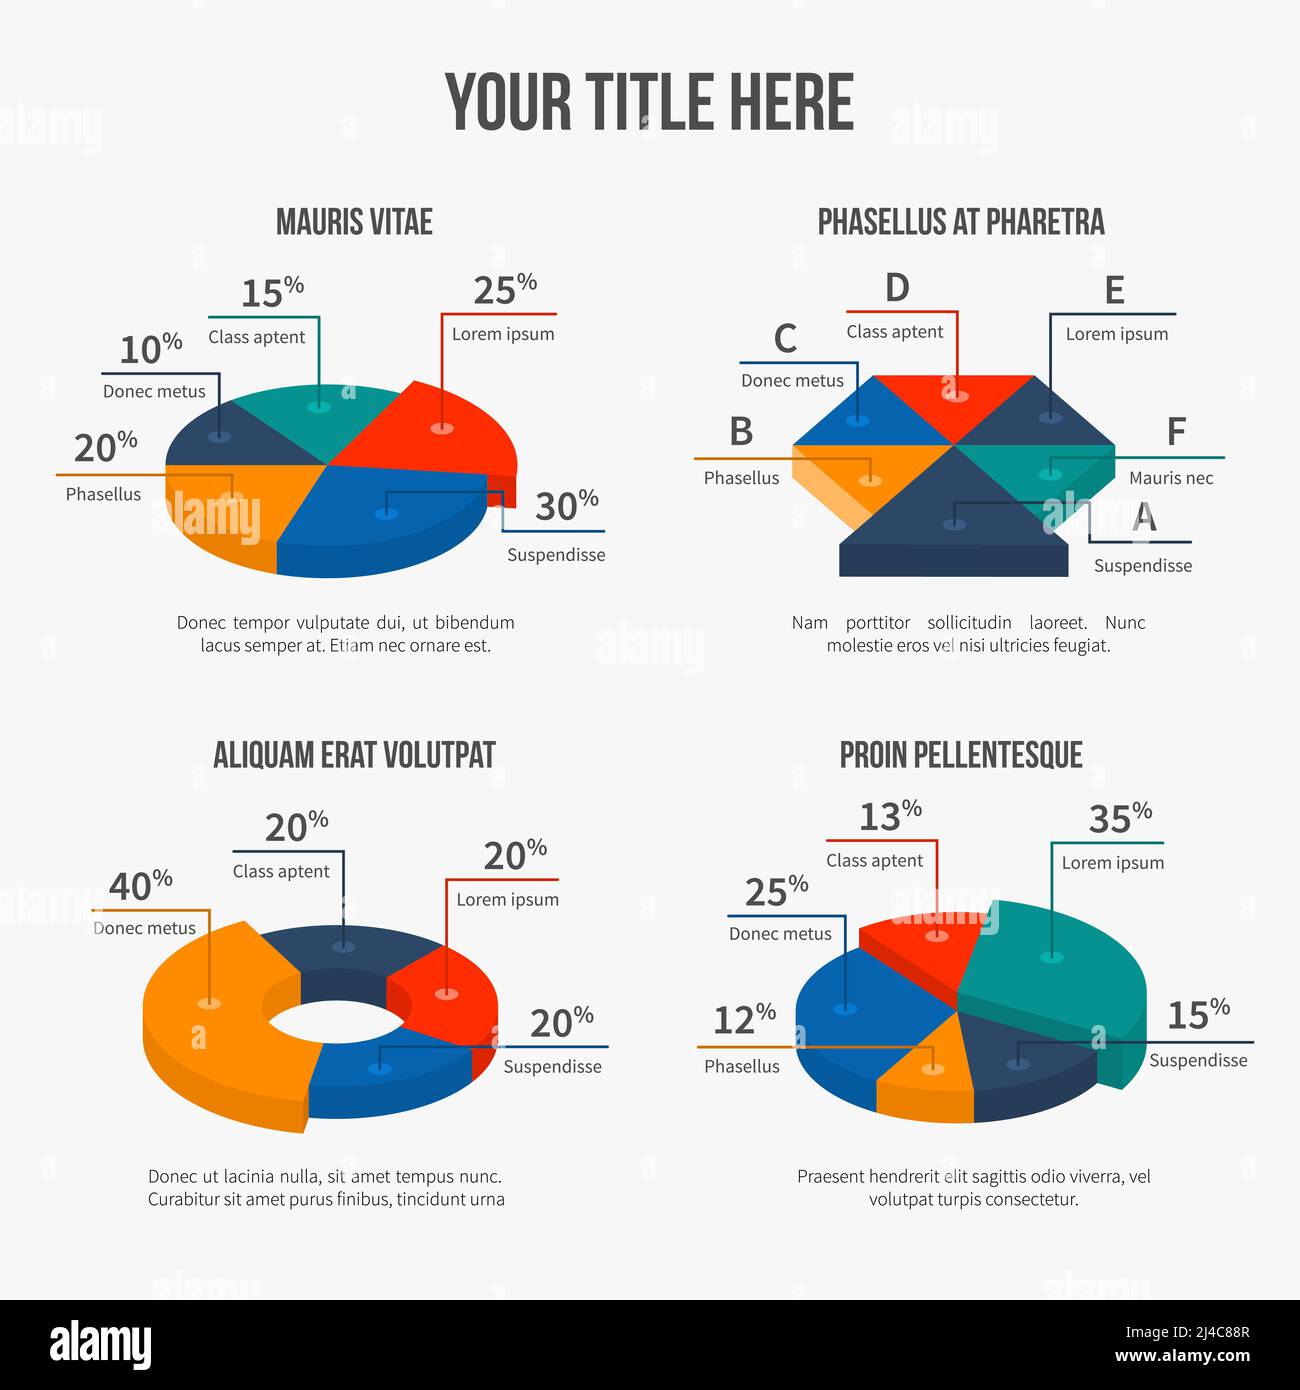 Vector pie charts in modern 3d flat style. Infographic presentation, finance graphic, interest figures Stock Vectorhttps://www.alamy.com/image-license-details/?v=1https://www.alamy.com/vector-pie-charts-in-modern-3d-flat-style-infographic-presentation-finance-graphic-interest-figures-image467408503.html
RF2J4C88R–Vector pie charts in modern 3d flat style. Infographic presentation, finance graphic, interest figures
RF2BEFB8G–Business data graph and charts. Marketing statistics vector flat icons. Graph and chart data, diagram finance for report illustration
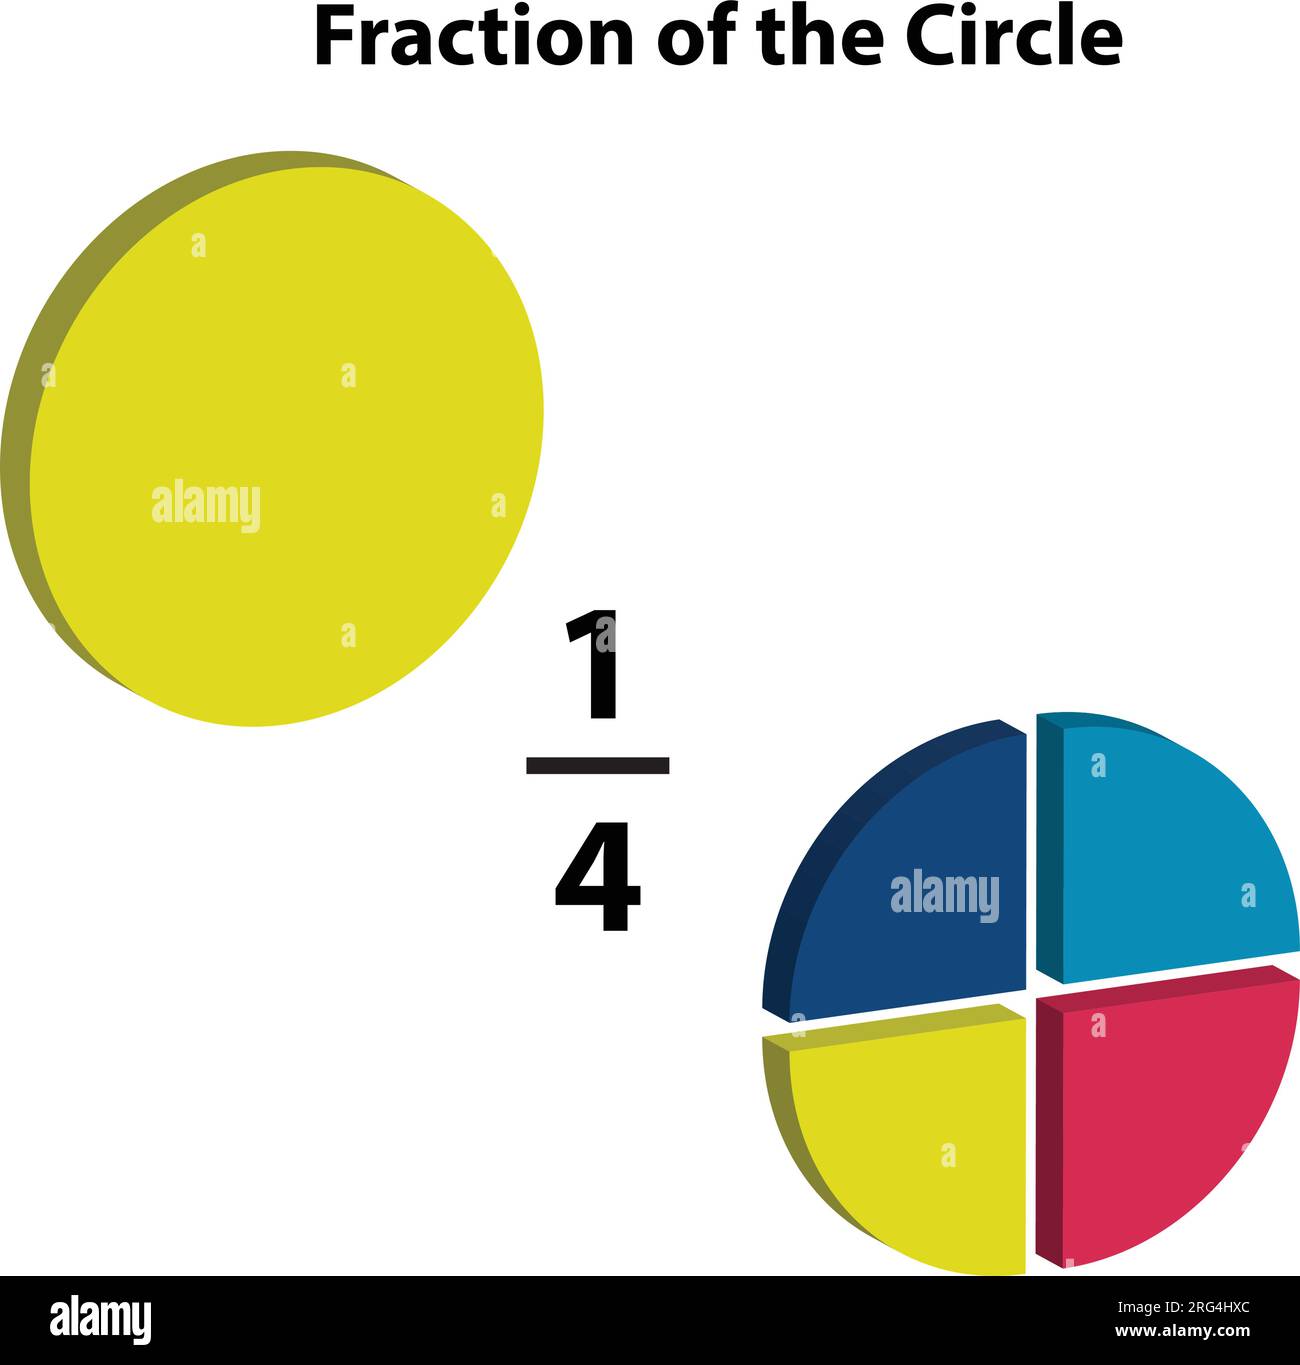 A fraction pie is divided into one-Forth slice, each showing math fractions, explained in mathematics. on a white background. Stock Vectorhttps://www.alamy.com/image-license-details/?v=1https://www.alamy.com/a-fraction-pie-is-divided-into-one-forth-slice-each-showing-math-fractions-explained-in-mathematics-on-a-white-background-image560668148.html
RF2RG4HXC–A fraction pie is divided into one-Forth slice, each showing math fractions, explained in mathematics. on a white background.
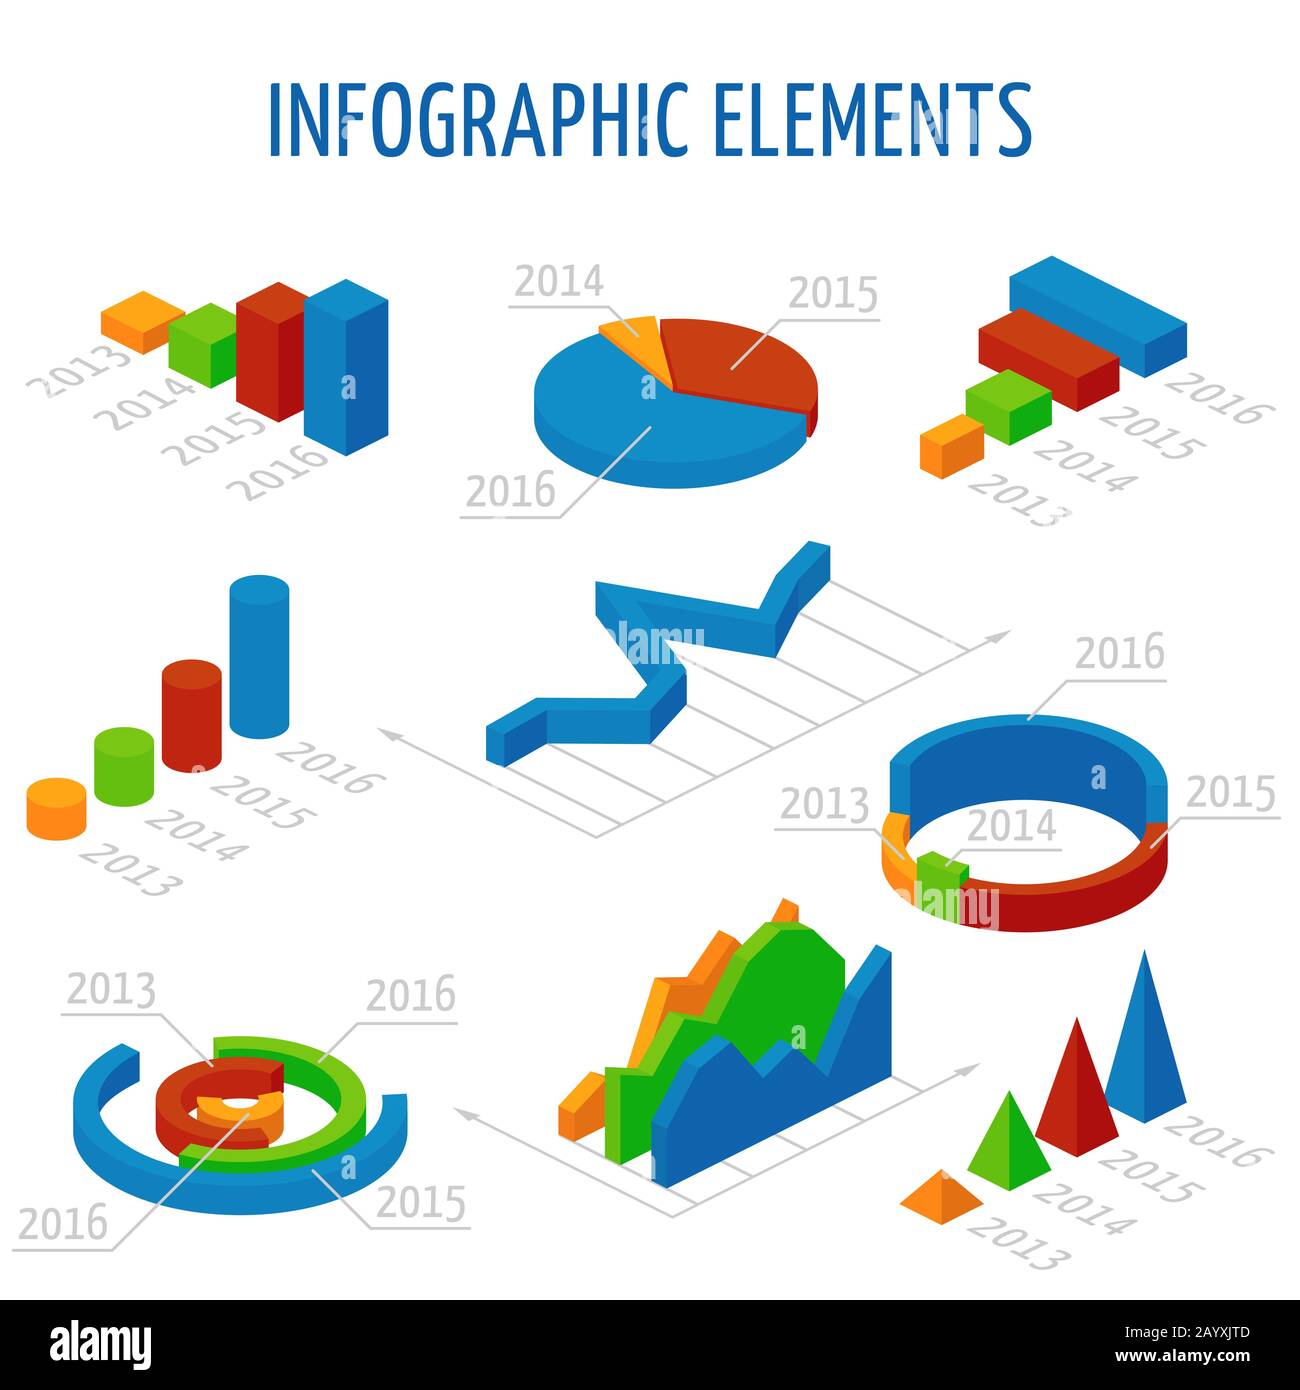 Isometric 3d vector charts set for infographics. Business graph and chart for report, illustration pie chart for presentation data illustration Stock Vectorhttps://www.alamy.com/image-license-details/?v=1https://www.alamy.com/isometric-3d-vector-charts-set-for-infographics-business-graph-and-chart-for-report-illustration-pie-chart-for-presentation-data-illustration-image344178253.html
RF2AYXJTD–Isometric 3d vector charts set for infographics. Business graph and chart for report, illustration pie chart for presentation data illustration
RF2TBN6D4–Dot bar pie charts, business data market elements, graphs, and flat icons set. Suitable for infographics, numbered banners, diagrams, and graphic or
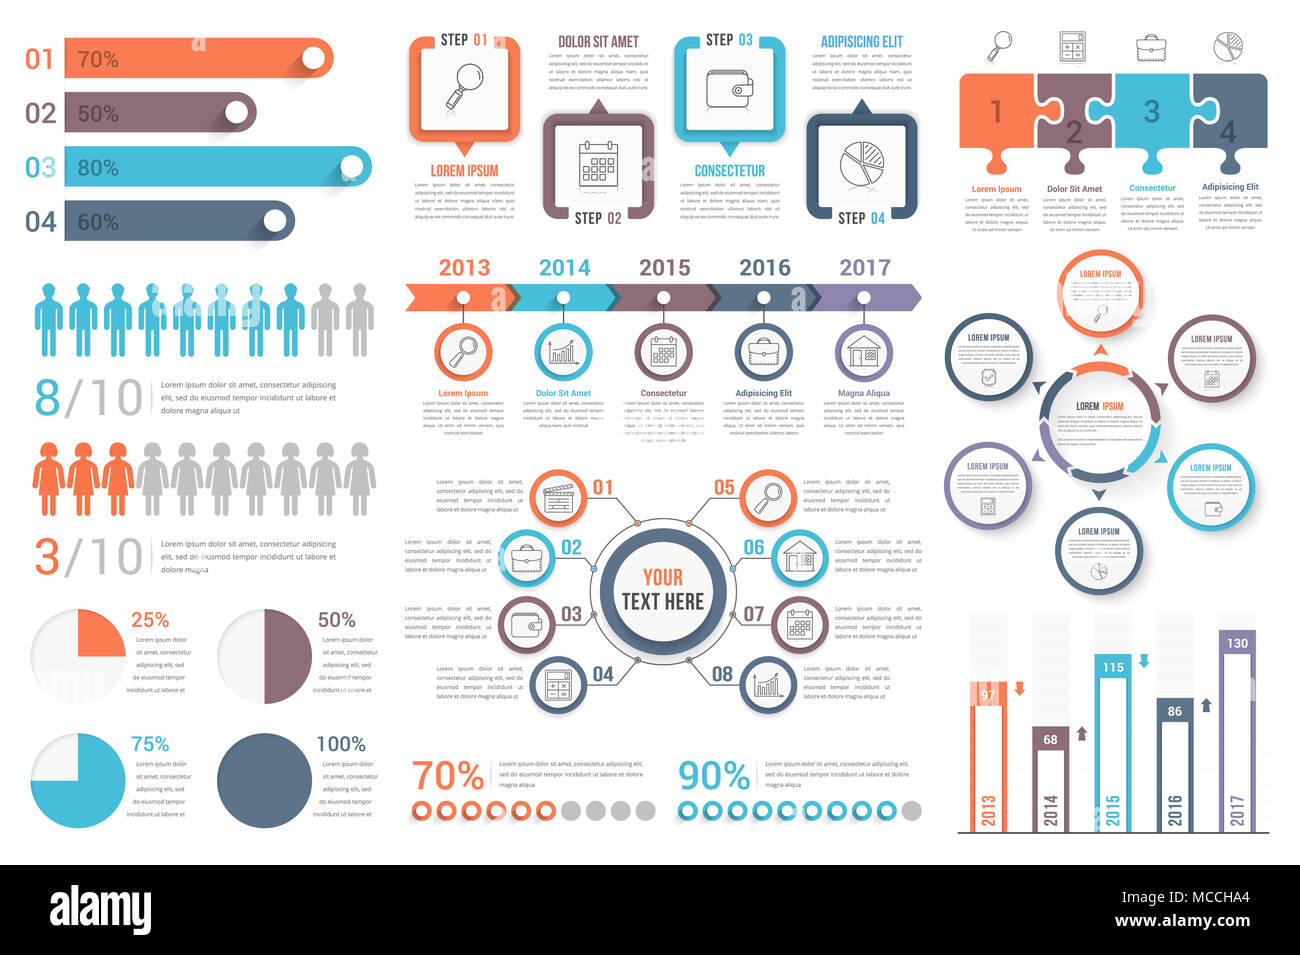 Set of most useful infographic elements - bar graphs, human infographics, pie charts, steps and options, workflow, puzzle, percents, circle diagram, t Stock Photohttps://www.alamy.com/image-license-details/?v=1https://www.alamy.com/set-of-most-useful-infographic-elements-bar-graphs-human-infographics-pie-charts-steps-and-options-workflow-puzzle-percents-circle-diagram-t-image179756588.html
RFMCCHA4–Set of most useful infographic elements - bar graphs, human infographics, pie charts, steps and options, workflow, puzzle, percents, circle diagram, t
RF2BYGW2B–Set of Users and Charts icon with flat style design vector
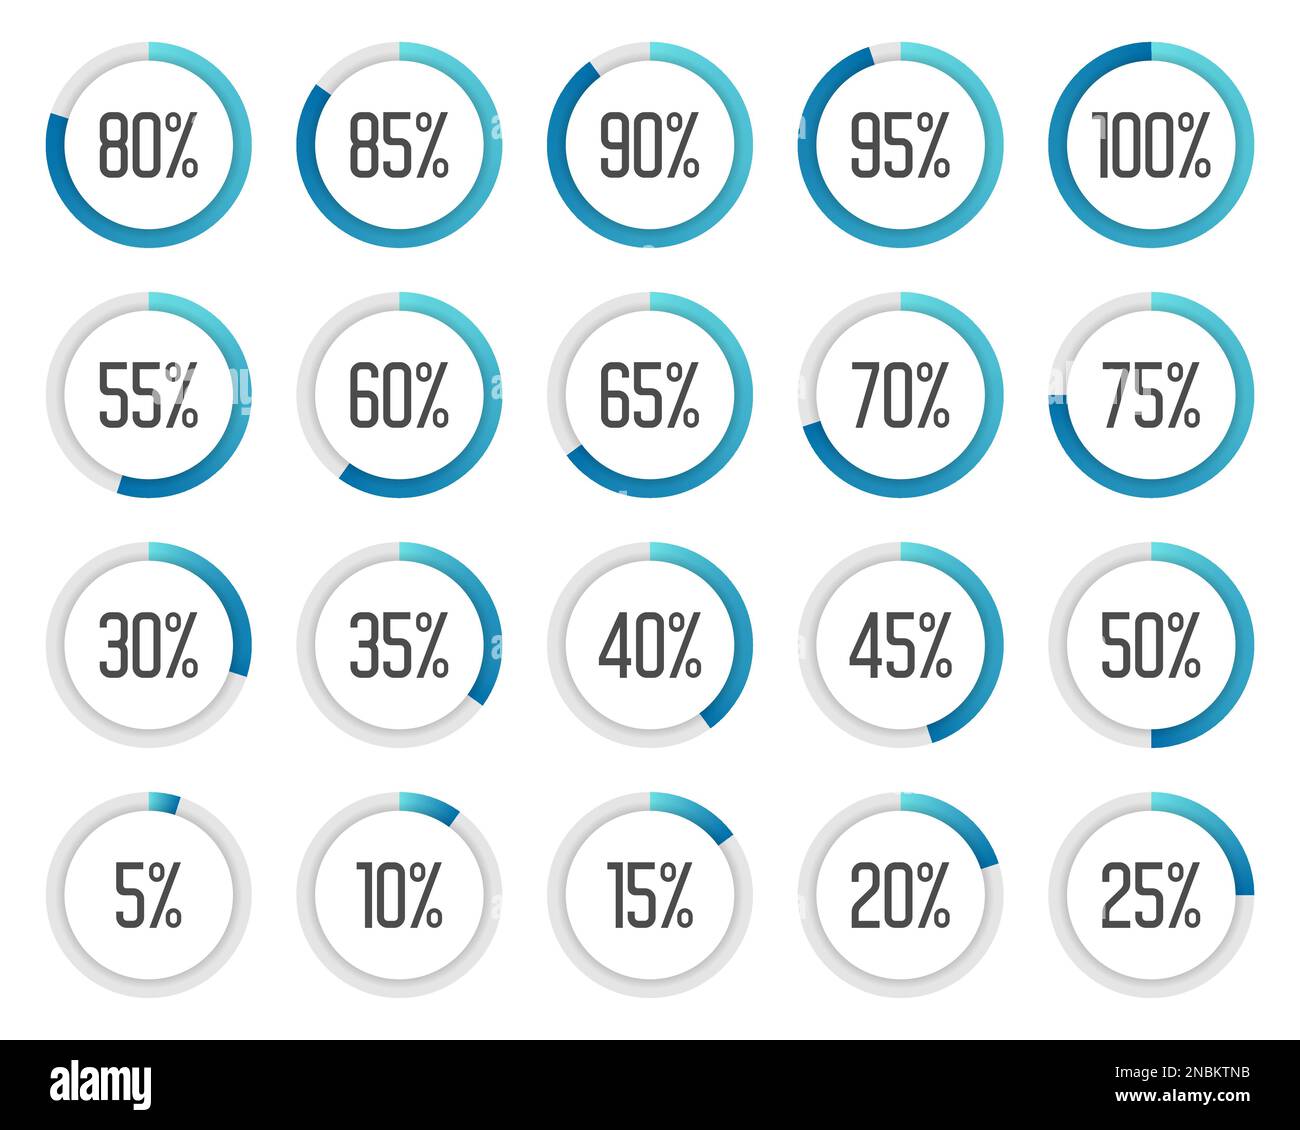 Set of colorful pie charts. Collection of blue percentage diagrams Stock Vectorhttps://www.alamy.com/image-license-details/?v=1https://www.alamy.com/set-of-colorful-pie-charts-collection-of-blue-percentage-diagrams-image523508759.html
RF2NBKTNB–Set of colorful pie charts. Collection of blue percentage diagrams
 Business man presenting new project to her partners and colleagues. He is presentation using pie diagram and column charts at conference meeting room. Stock Vectorhttps://www.alamy.com/image-license-details/?v=1https://www.alamy.com/business-man-presenting-new-project-to-her-partners-and-colleagues-he-is-presentation-using-pie-diagram-and-column-charts-at-conference-meeting-room-image425651154.html
RF2FME2AX–Business man presenting new project to her partners and colleagues. He is presentation using pie diagram and column charts at conference meeting room.
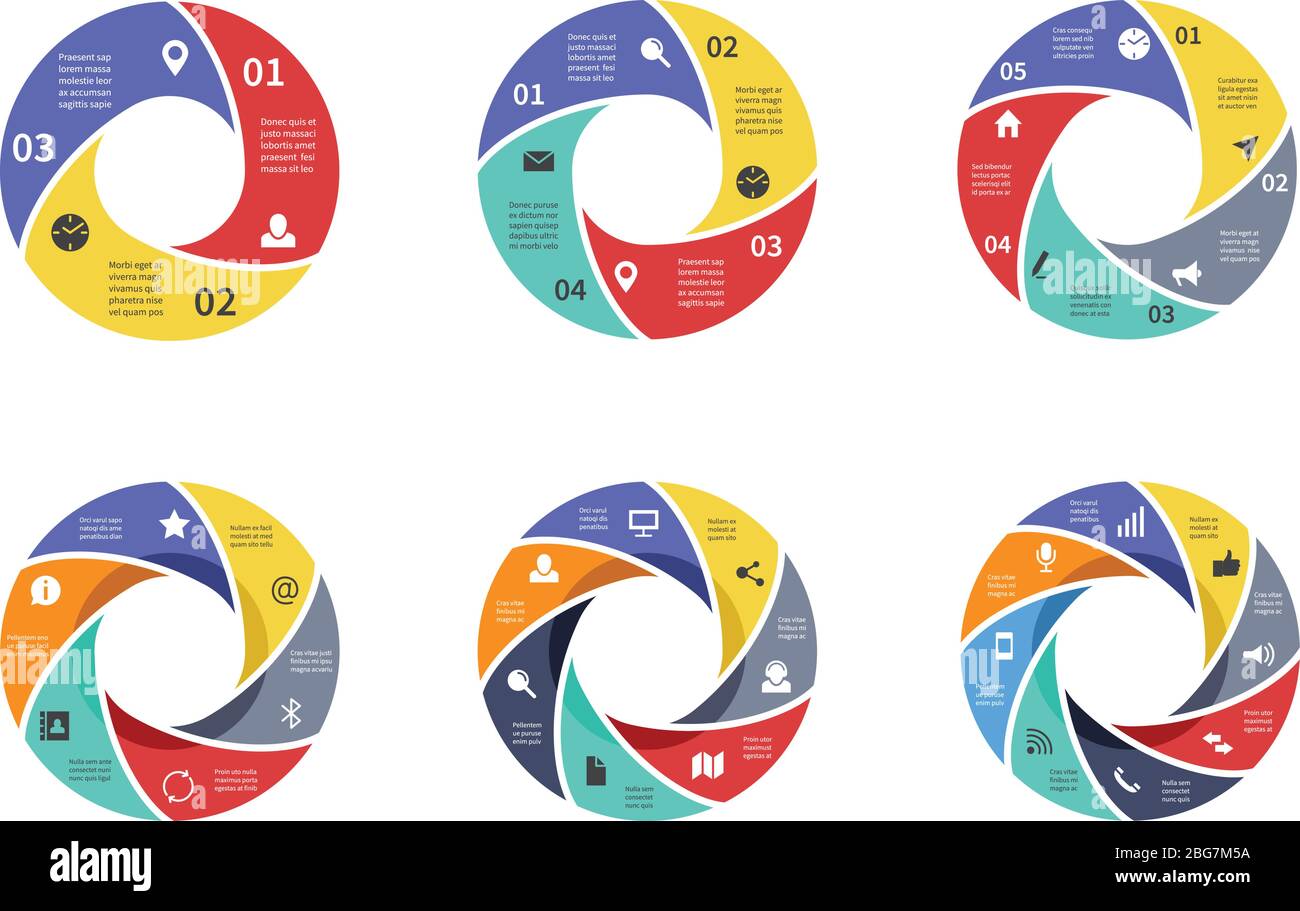 Circle graph, pie strategy diagrams, circular arrows charts with options, parts, steps, process sectors. Business vector infographic. Illustration of Stock Vectorhttps://www.alamy.com/image-license-details/?v=1https://www.alamy.com/circle-graph-pie-strategy-diagrams-circular-arrows-charts-with-options-parts-steps-process-sectors-business-vector-infographic-illustration-of-image354211350.html
RF2BG7M5A–Circle graph, pie strategy diagrams, circular arrows charts with options, parts, steps, process sectors. Business vector infographic. Illustration of
 business concept, studying the infographic, Data analysis, Finance report graph. Charts and diagrams, set flat vector modern illustration Stock Vectorhttps://www.alamy.com/image-license-details/?v=1https://www.alamy.com/business-concept-studying-the-infographic-data-analysis-finance-report-graph-charts-and-diagrams-set-flat-vector-modern-illustration-image560441061.html
RF2RFP885–business concept, studying the infographic, Data analysis, Finance report graph. Charts and diagrams, set flat vector modern illustration
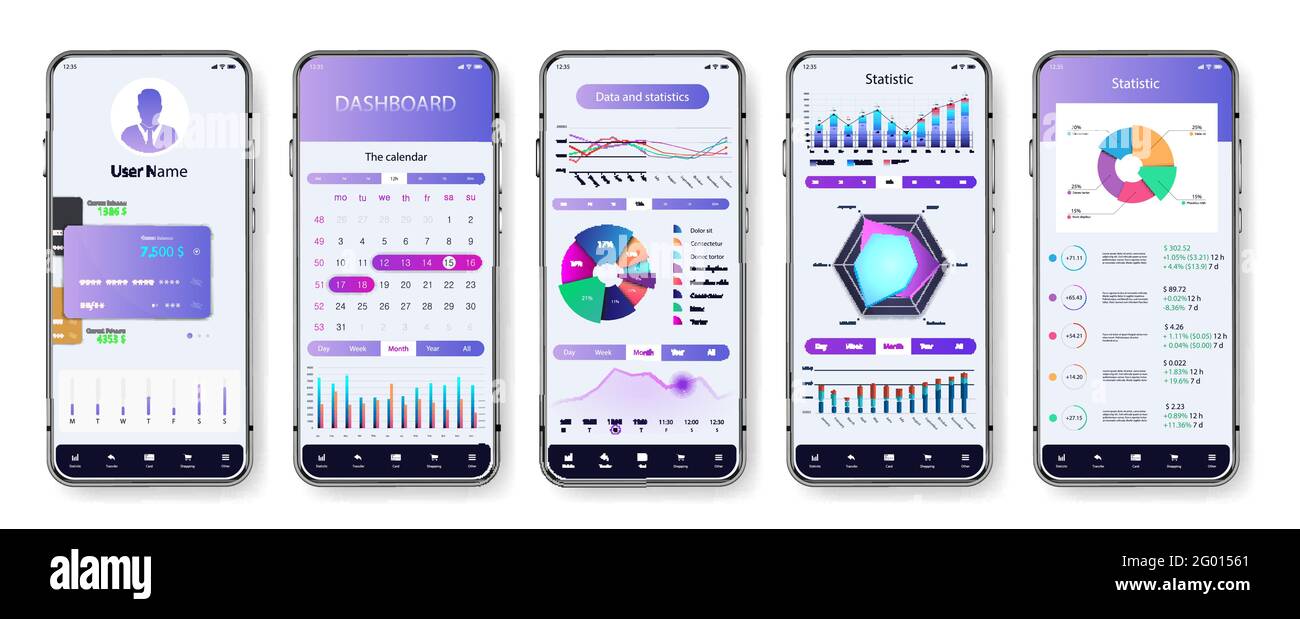 Light application interface for mobile phone. UI screens with dashboard, pie charts, infographics, diagrams and statistic. App mockup with investment Stock Vectorhttps://www.alamy.com/image-license-details/?v=1https://www.alamy.com/light-application-interface-for-mobile-phone-ui-screens-with-dashboard-pie-charts-infographics-diagrams-and-statistic-app-mockup-with-investment-image430285241.html
RF2G01561–Light application interface for mobile phone. UI screens with dashboard, pie charts, infographics, diagrams and statistic. App mockup with investment
RFMDYY15–Set Of 9 simple editable icons such as Safe box, Data analytics, Chart, Box plot chart, Pie graphic with four areas, Data import interface, Global use
 Online survey results analysis. Pie charts, infographics, analyzing process. Business and financial reports analytics. Social poll answers statistics. Stock Vectorhttps://www.alamy.com/image-license-details/?v=1https://www.alamy.com/online-survey-results-analysis-pie-charts-infographics-analyzing-process-business-and-financial-reports-analytics-social-poll-answers-statistics-image485094073.html
RF2K55XC9–Online survey results analysis. Pie charts, infographics, analyzing process. Business and financial reports analytics. Social poll answers statistics.
 Modern infographic vector elements for business brochures. Use in website, corporate brochure, advertising and marketing. Pie charts, line graphs, bar Stock Vectorhttps://www.alamy.com/image-license-details/?v=1https://www.alamy.com/modern-infographic-vector-elements-for-business-brochures-use-in-website-corporate-brochure-advertising-and-marketing-pie-charts-line-graphs-bar-image344179386.html
RF2AYXM8X–Modern infographic vector elements for business brochures. Use in website, corporate brochure, advertising and marketing. Pie charts, line graphs, bar
 Business coach speaking in front of audience, Using Pie Diagrams and Column Charts, doing presentation and professional training about marketing, sale Stock Vectorhttps://www.alamy.com/image-license-details/?v=1https://www.alamy.com/business-coach-speaking-in-front-of-audience-using-pie-diagrams-and-column-charts-doing-presentation-and-professional-training-about-marketing-sale-image560439720.html
RF2RFP6G8–Business coach speaking in front of audience, Using Pie Diagrams and Column Charts, doing presentation and professional training about marketing, sale
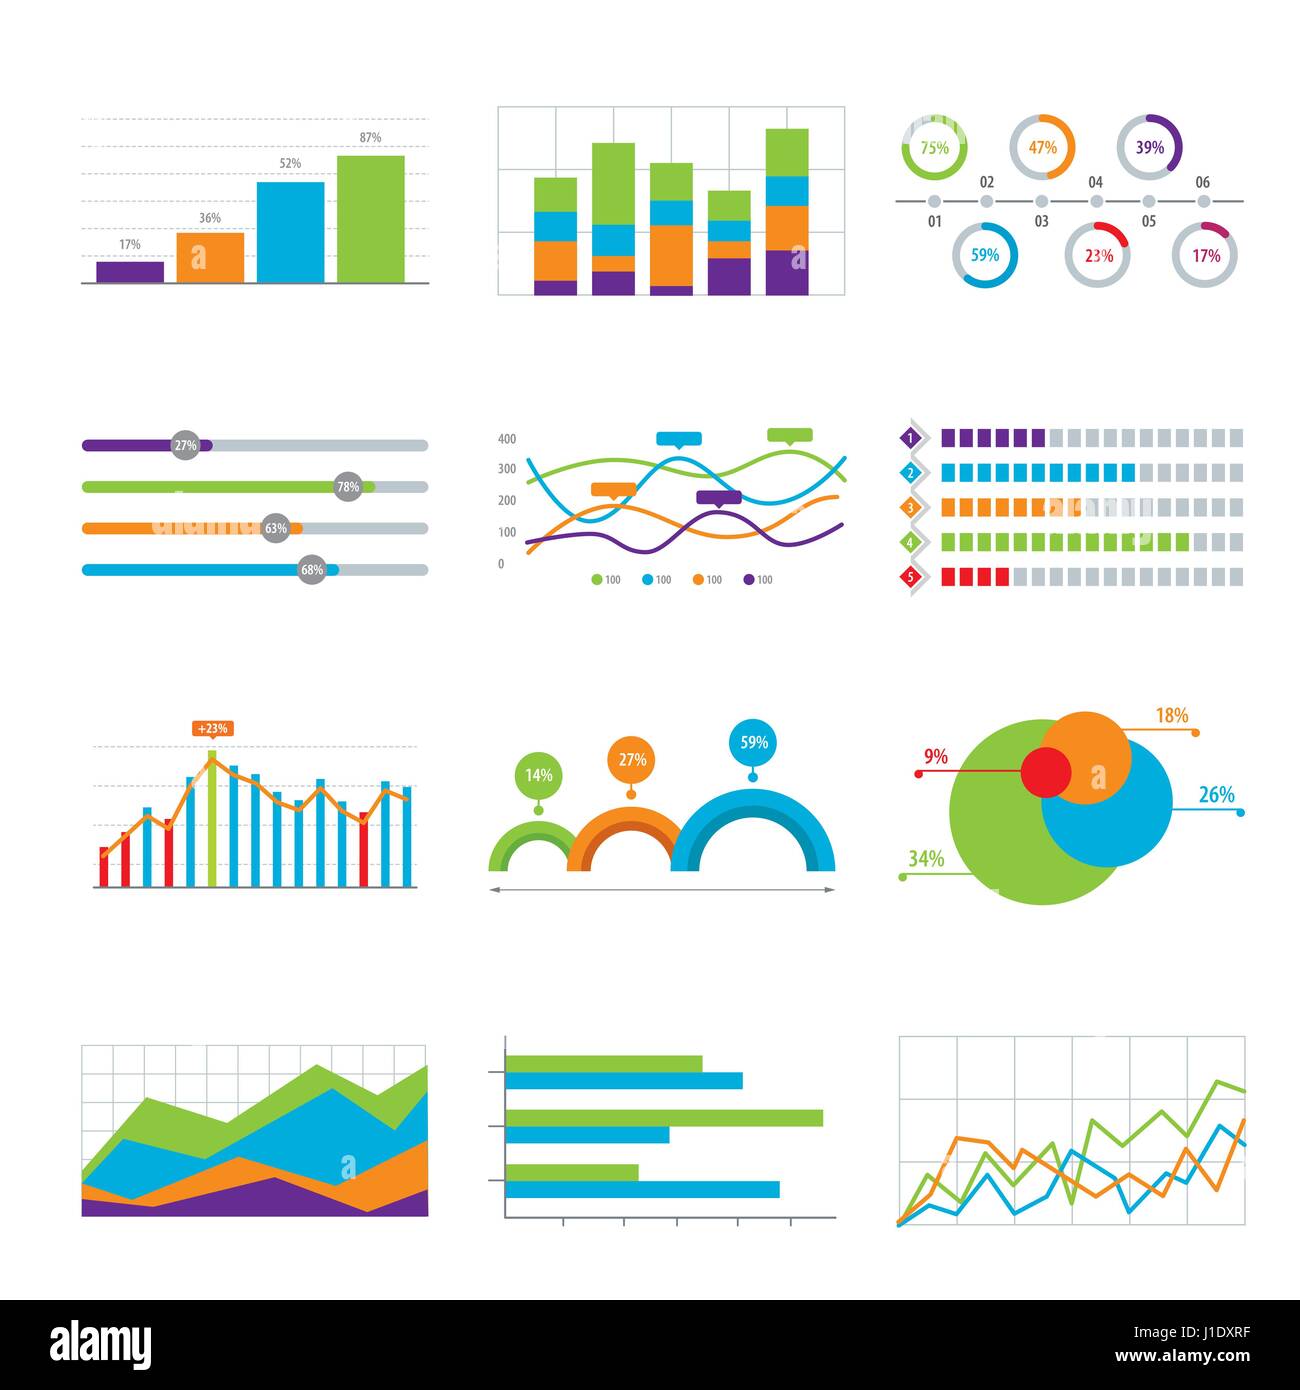 Business data market elements bar pie charts diagrams and graphs flat icons in vector illustration. Stock Vectorhttps://www.alamy.com/image-license-details/?v=1https://www.alamy.com/stock-photo-business-data-market-elements-bar-pie-charts-diagrams-and-graphs-flat-138604019.html
RFJ1DXRF–Business data market elements bar pie charts diagrams and graphs flat icons in vector illustration.
 Different diagrams and charts isometric vector illustration. Business charts, infographic elements Stock Vectorhttps://www.alamy.com/image-license-details/?v=1https://www.alamy.com/different-diagrams-and-charts-isometric-vector-illustration-business-charts-infographic-elements-image256595833.html
RFTWCXGW–Different diagrams and charts isometric vector illustration. Business charts, infographic elements
 Pie charts, illustration, vector on white background Stock Vectorhttps://www.alamy.com/image-license-details/?v=1https://www.alamy.com/pie-charts-illustration-vector-on-white-background-image359234930.html
RF2BTCFPX–Pie charts, illustration, vector on white background
 Set of pie charts infographic. Vector illustration Stock Vectorhttps://www.alamy.com/image-license-details/?v=1https://www.alamy.com/set-of-pie-charts-infographic-vector-illustration-image343377915.html
RF2AXJ60Y–Set of pie charts infographic. Vector illustration
 Business Concepts, Illustration Set of Infographic Templates Pattern Element in Pie Charts for Business Presentation. Stock Photohttps://www.alamy.com/image-license-details/?v=1https://www.alamy.com/business-concepts-illustration-set-of-infographic-templates-pattern-element-in-pie-charts-for-business-presentation-image207811857.html
RFP22J41–Business Concepts, Illustration Set of Infographic Templates Pattern Element in Pie Charts for Business Presentation.
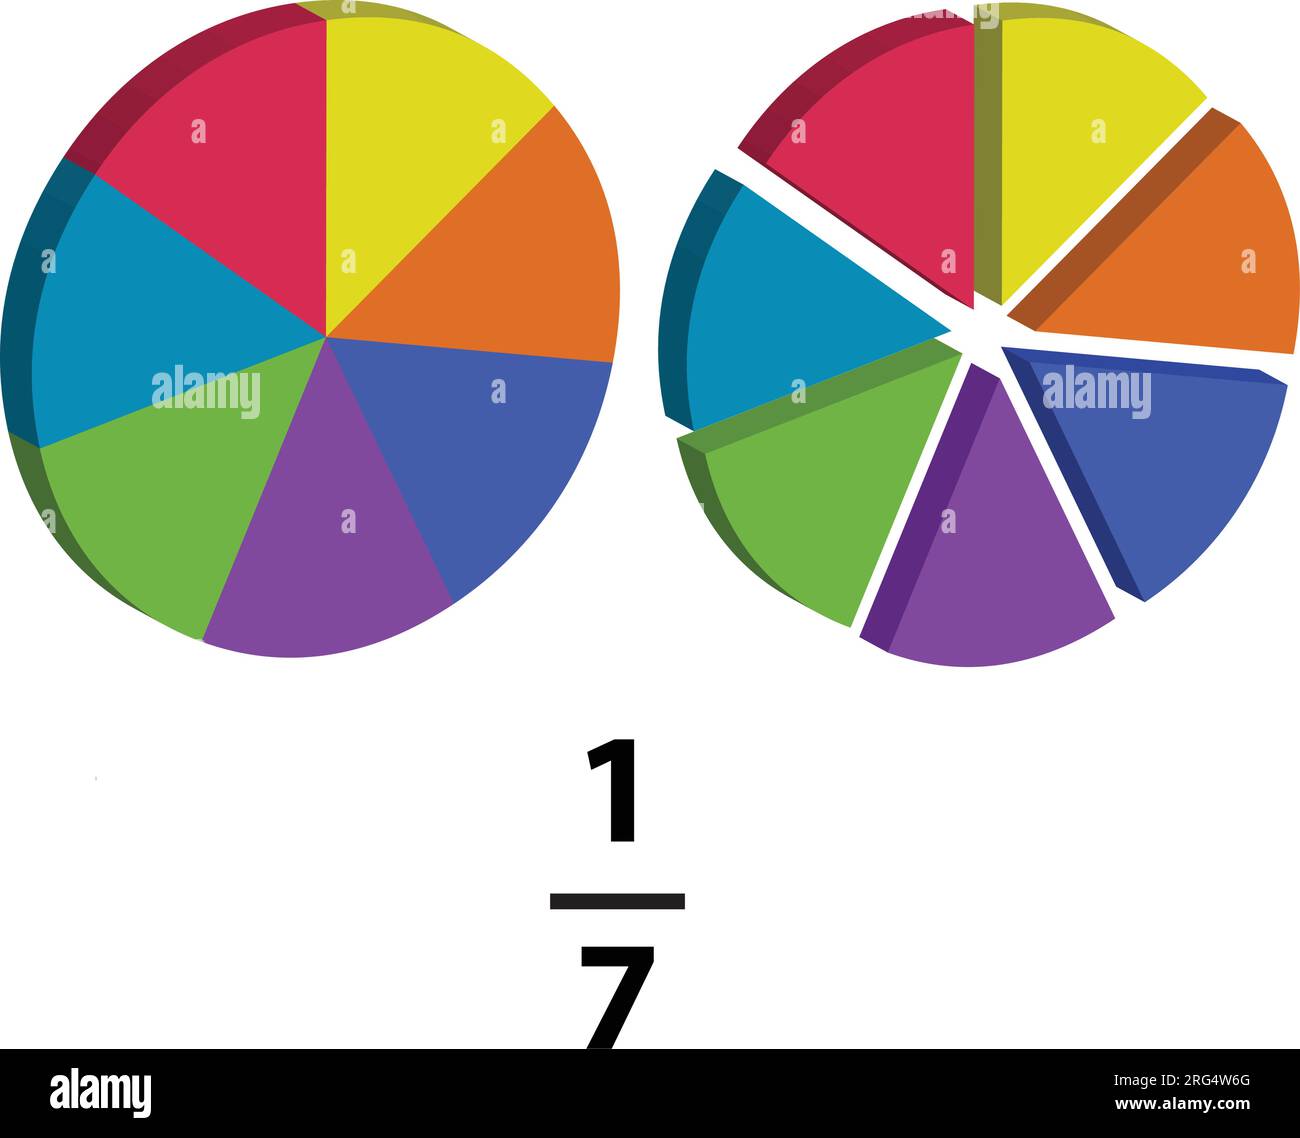 A fraction pie is divided into one-six slice, each showing math fractions, explained in mathematics. on a white background. Stock Vectorhttps://www.alamy.com/image-license-details/?v=1https://www.alamy.com/a-fraction-pie-is-divided-into-one-six-slice-each-showing-math-fractions-explained-in-mathematics-on-a-white-background-image560673864.html
RF2RG4W6G–A fraction pie is divided into one-six slice, each showing math fractions, explained in mathematics. on a white background.
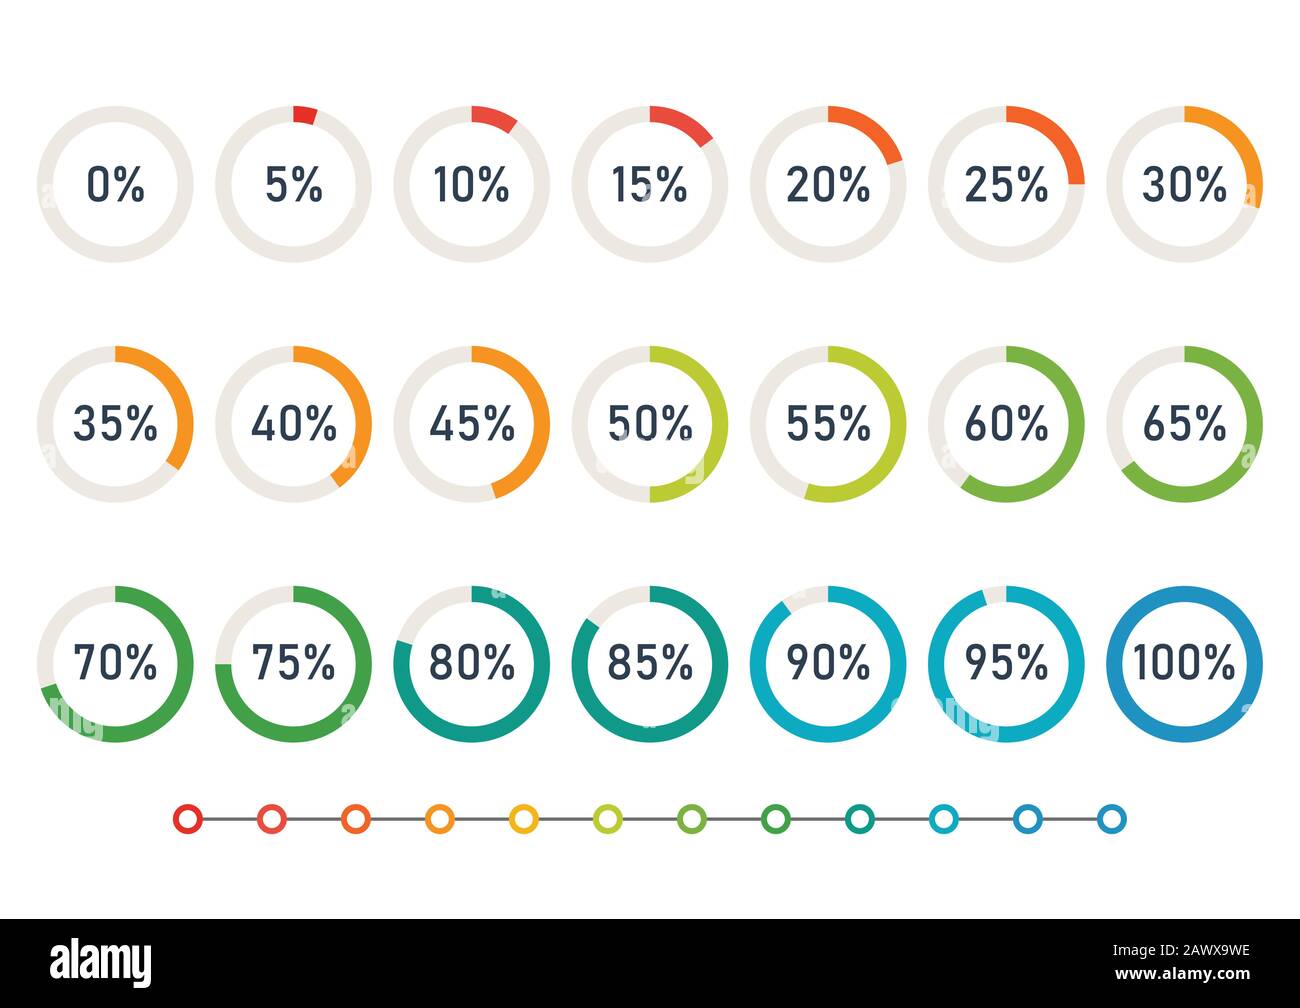 Progress Wheel Pie Charts Infographic. vector illustration Stock Vectorhttps://www.alamy.com/image-license-details/?v=1https://www.alamy.com/progress-wheel-pie-charts-infographic-vector-illustration-image342941914.html
RF2AWX9WE–Progress Wheel Pie Charts Infographic. vector illustration
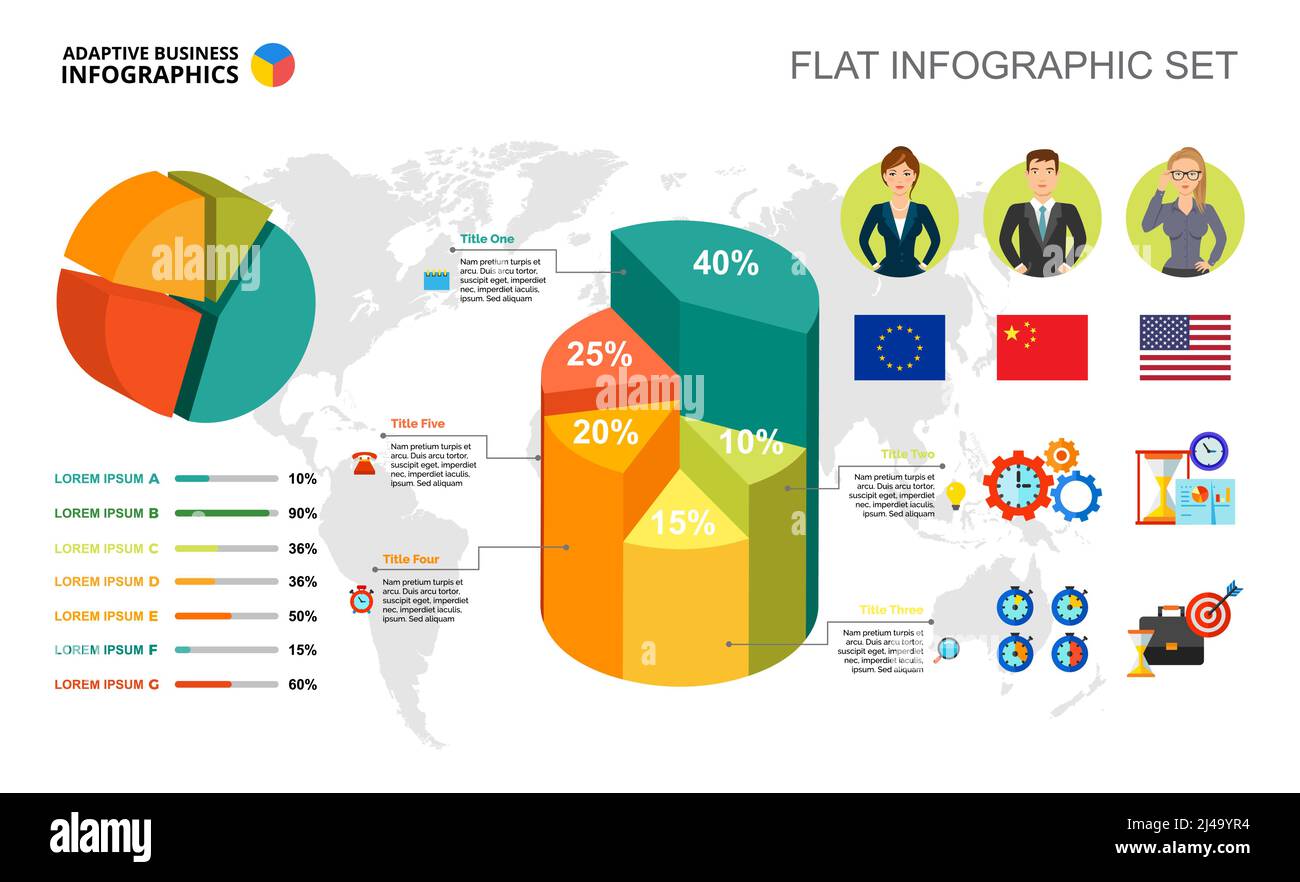 International business percentage and pie charts template for presentation. Abstract elements of diagram, graphic. Progress, economy, management or st Stock Vectorhttps://www.alamy.com/image-license-details/?v=1https://www.alamy.com/international-business-percentage-and-pie-charts-template-for-presentation-abstract-elements-of-diagram-graphic-progress-economy-management-or-st-image467357944.html
RF2J49YR4–International business percentage and pie charts template for presentation. Abstract elements of diagram, graphic. Progress, economy, management or st
 Set of most useful infographic elements - bar graphs, human infographics, pie charts, steps and options, workflow, puzzle, percents, circle diagram, t Stock Photohttps://www.alamy.com/image-license-details/?v=1https://www.alamy.com/set-of-most-useful-infographic-elements-bar-graphs-human-infographics-pie-charts-steps-and-options-workflow-puzzle-percents-circle-diagram-t-image178144870.html
RFM9R5GP–Set of most useful infographic elements - bar graphs, human infographics, pie charts, steps and options, workflow, puzzle, percents, circle diagram, t
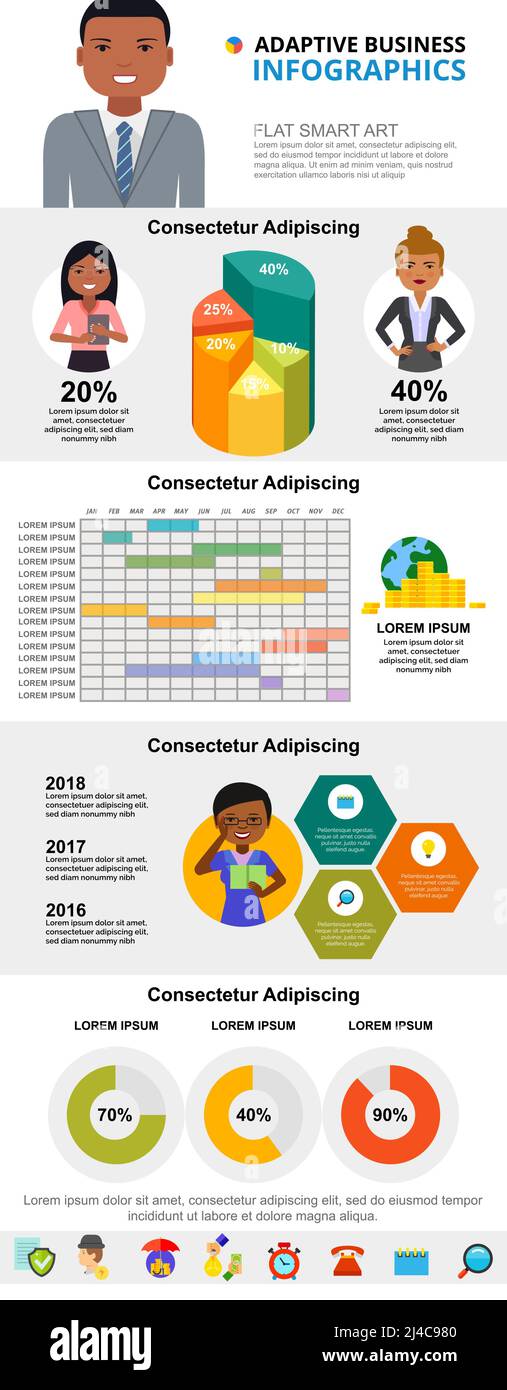 Planning or analysis concept infographic charts set. Business timing, doughnut and pie charts for presentation slide templates. For corporate report, Stock Vectorhttps://www.alamy.com/image-license-details/?v=1https://www.alamy.com/planning-or-analysis-concept-infographic-charts-set-business-timing-doughnut-and-pie-charts-for-presentation-slide-templates-for-corporate-report-image467409264.html
RF2J4C980–Planning or analysis concept infographic charts set. Business timing, doughnut and pie charts for presentation slide templates. For corporate report,
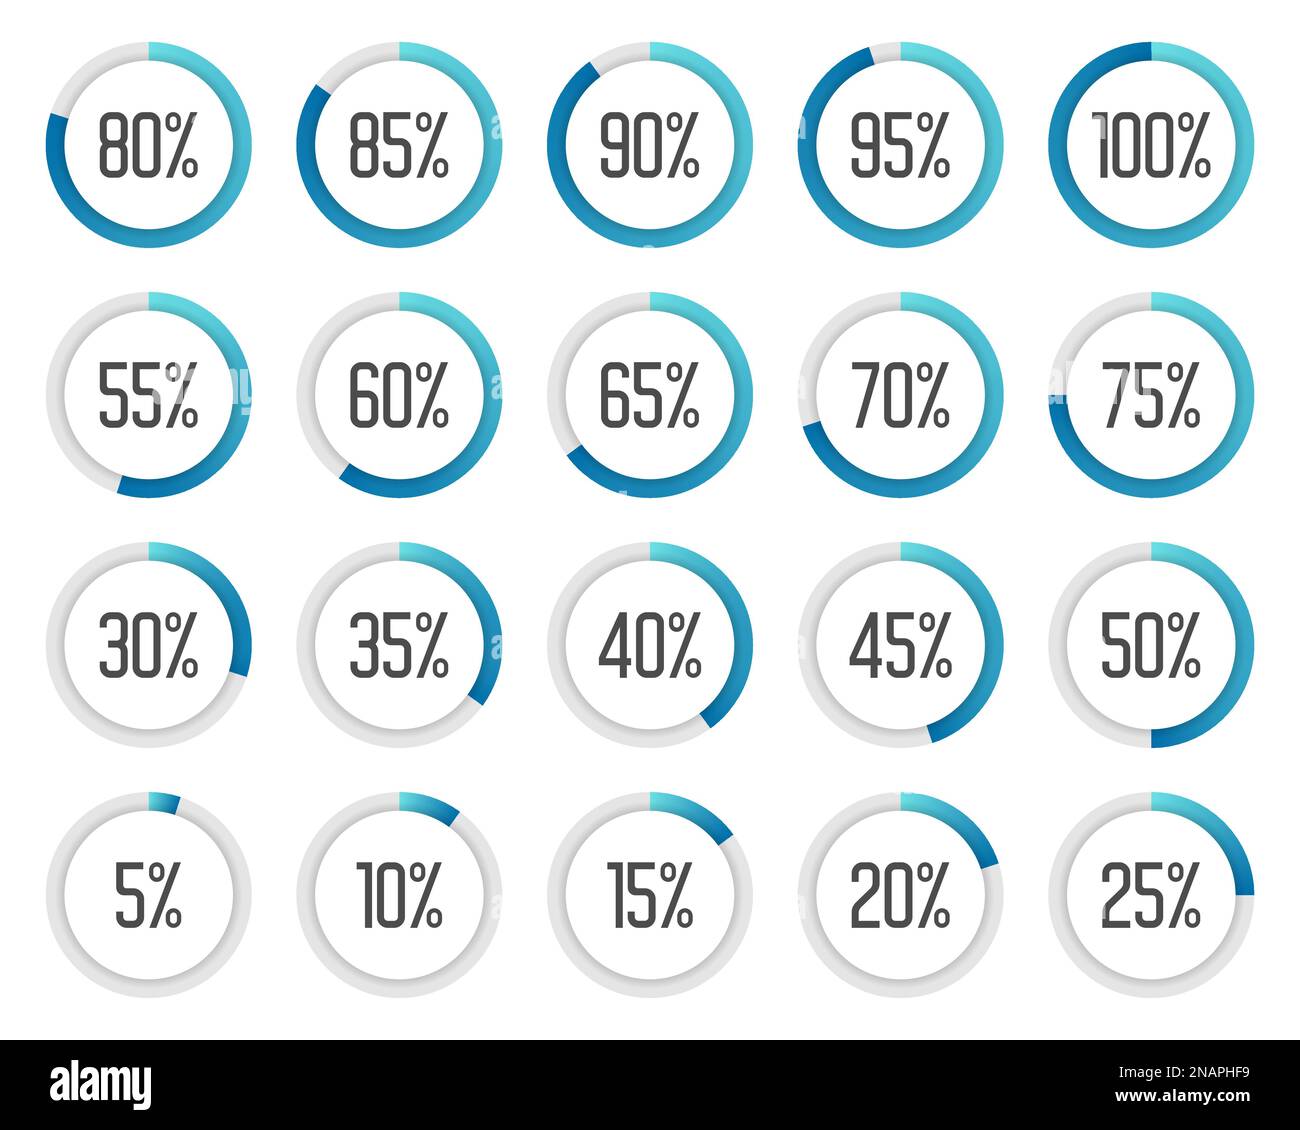 Set of colorful pie charts. Collection of blue percentage diagrams Stock Vectorhttps://www.alamy.com/image-license-details/?v=1https://www.alamy.com/set-of-colorful-pie-charts-collection-of-blue-percentage-diagrams-image522954301.html
RF2NAPHF9–Set of colorful pie charts. Collection of blue percentage diagrams
 Business woman presenting new project to her partners and colleagues. She is presentation using pie diagram and column charts at conference meeting ro Stock Vectorhttps://www.alamy.com/image-license-details/?v=1https://www.alamy.com/business-woman-presenting-new-project-to-her-partners-and-colleagues-she-is-presentation-using-pie-diagram-and-column-charts-at-conference-meeting-ro-image425650986.html
RF2FME24X–Business woman presenting new project to her partners and colleagues. She is presentation using pie diagram and column charts at conference meeting ro
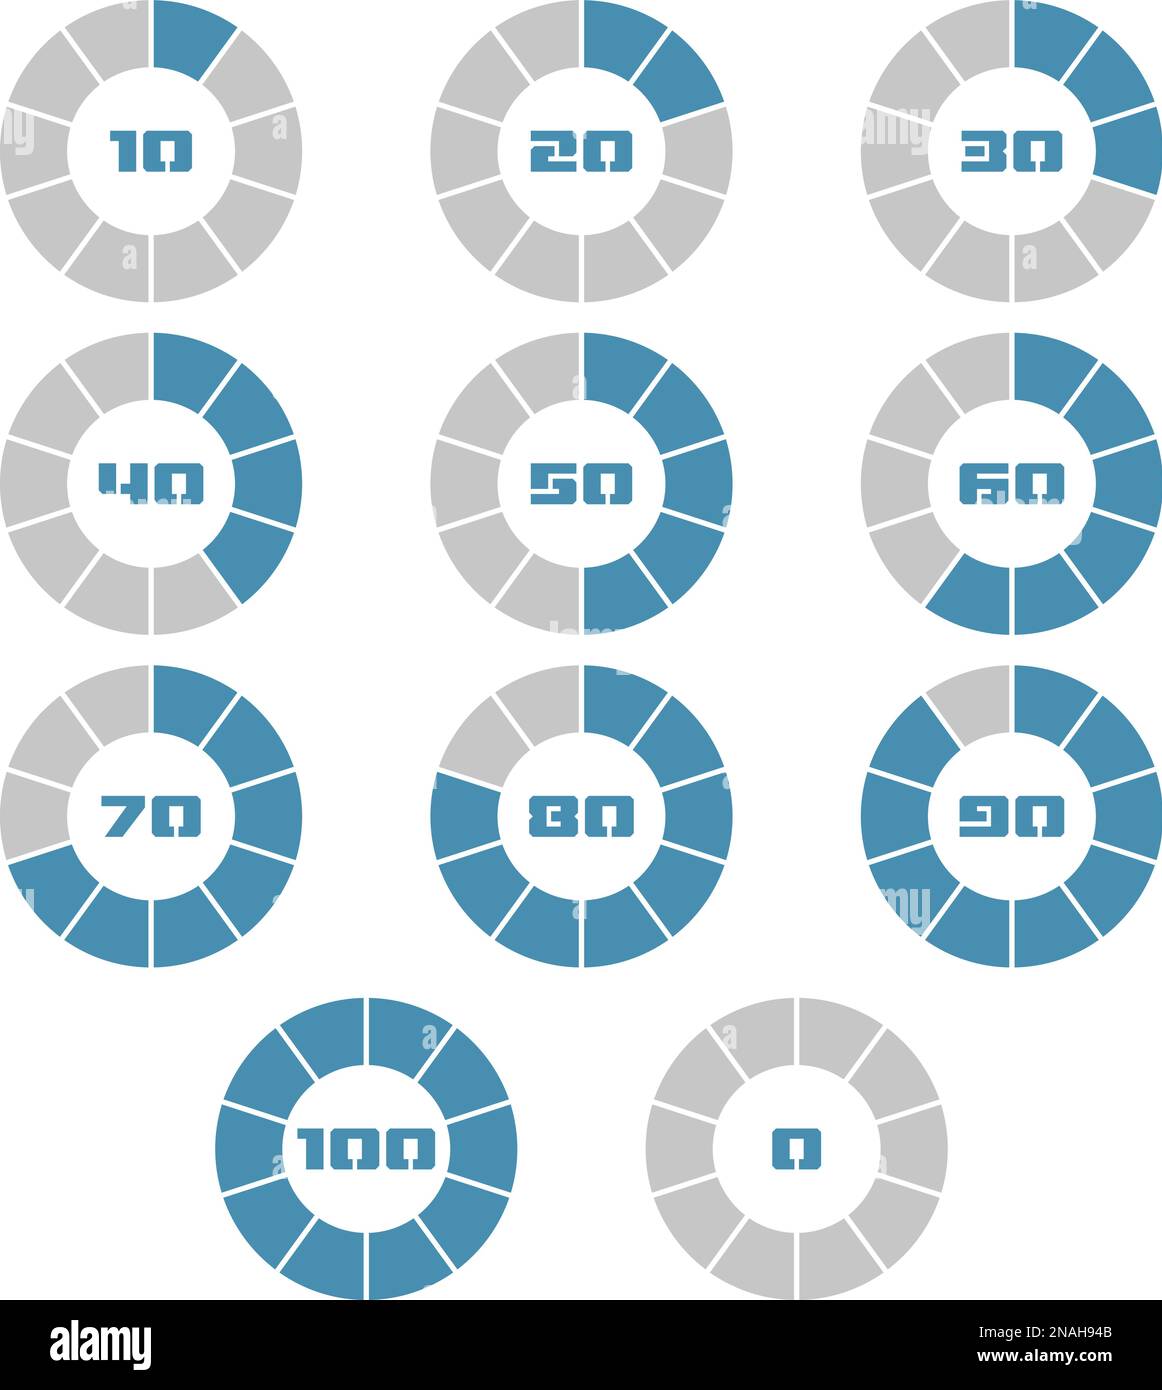 Colorful pie charts. Set of green percentage diagrams. Modern infographic elements Stock Vectorhttps://www.alamy.com/image-license-details/?v=1https://www.alamy.com/colorful-pie-charts-set-of-green-percentage-diagrams-modern-infographic-elements-image522837963.html
RF2NAH94B–Colorful pie charts. Set of green percentage diagrams. Modern infographic elements
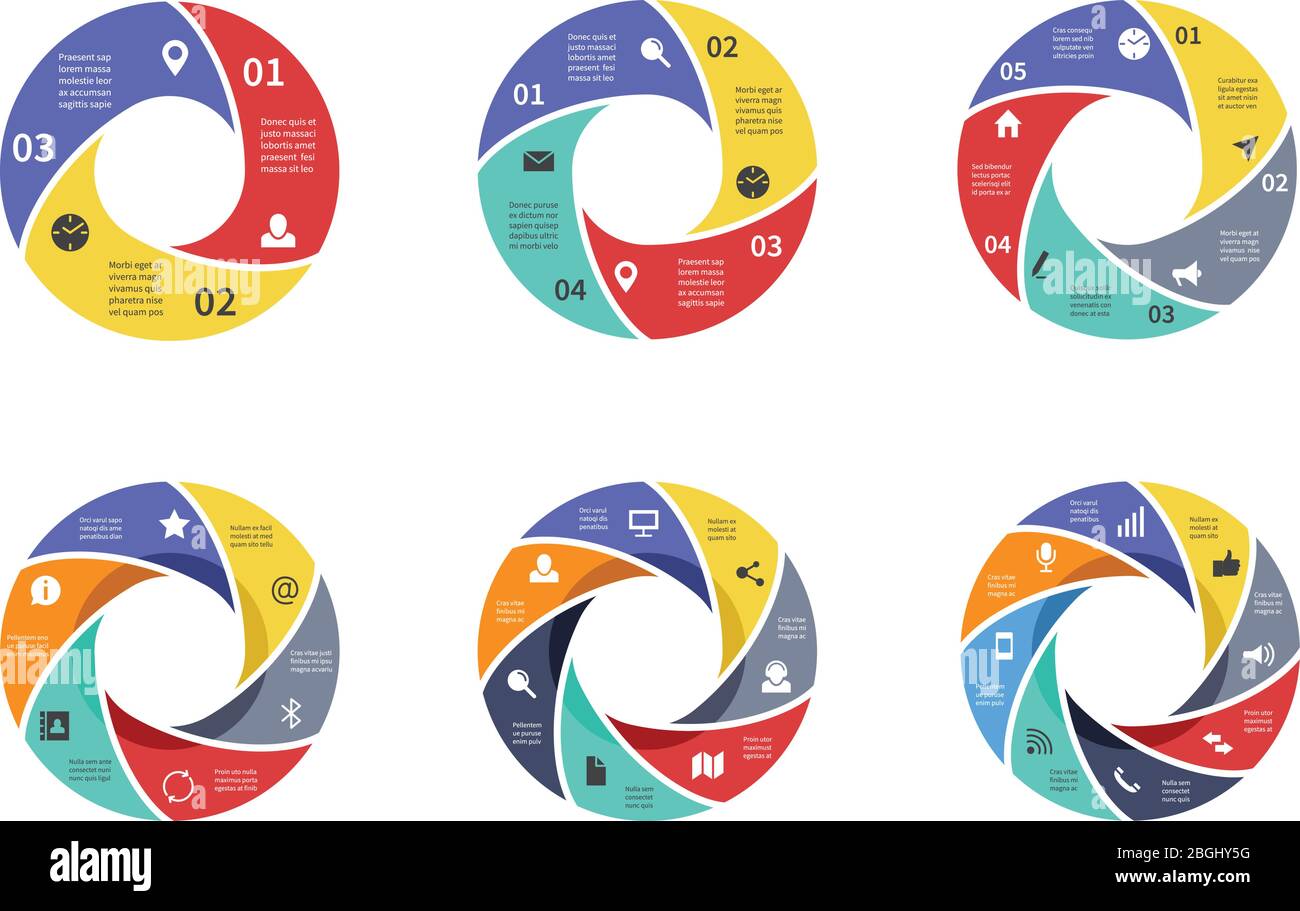 Circle graph, pie strategy diagrams, circular arrows charts with options, parts, steps, process sectors. Business vector infographic. Illustration of chart circle, circular data diagram Stock Vectorhttps://www.alamy.com/image-license-details/?v=1https://www.alamy.com/circle-graph-pie-strategy-diagrams-circular-arrows-charts-with-options-parts-steps-process-sectors-business-vector-infographic-illustration-of-chart-circle-circular-data-diagram-image354436364.html
RF2BGHY5G–Circle graph, pie strategy diagrams, circular arrows charts with options, parts, steps, process sectors. Business vector infographic. Illustration of chart circle, circular data diagram
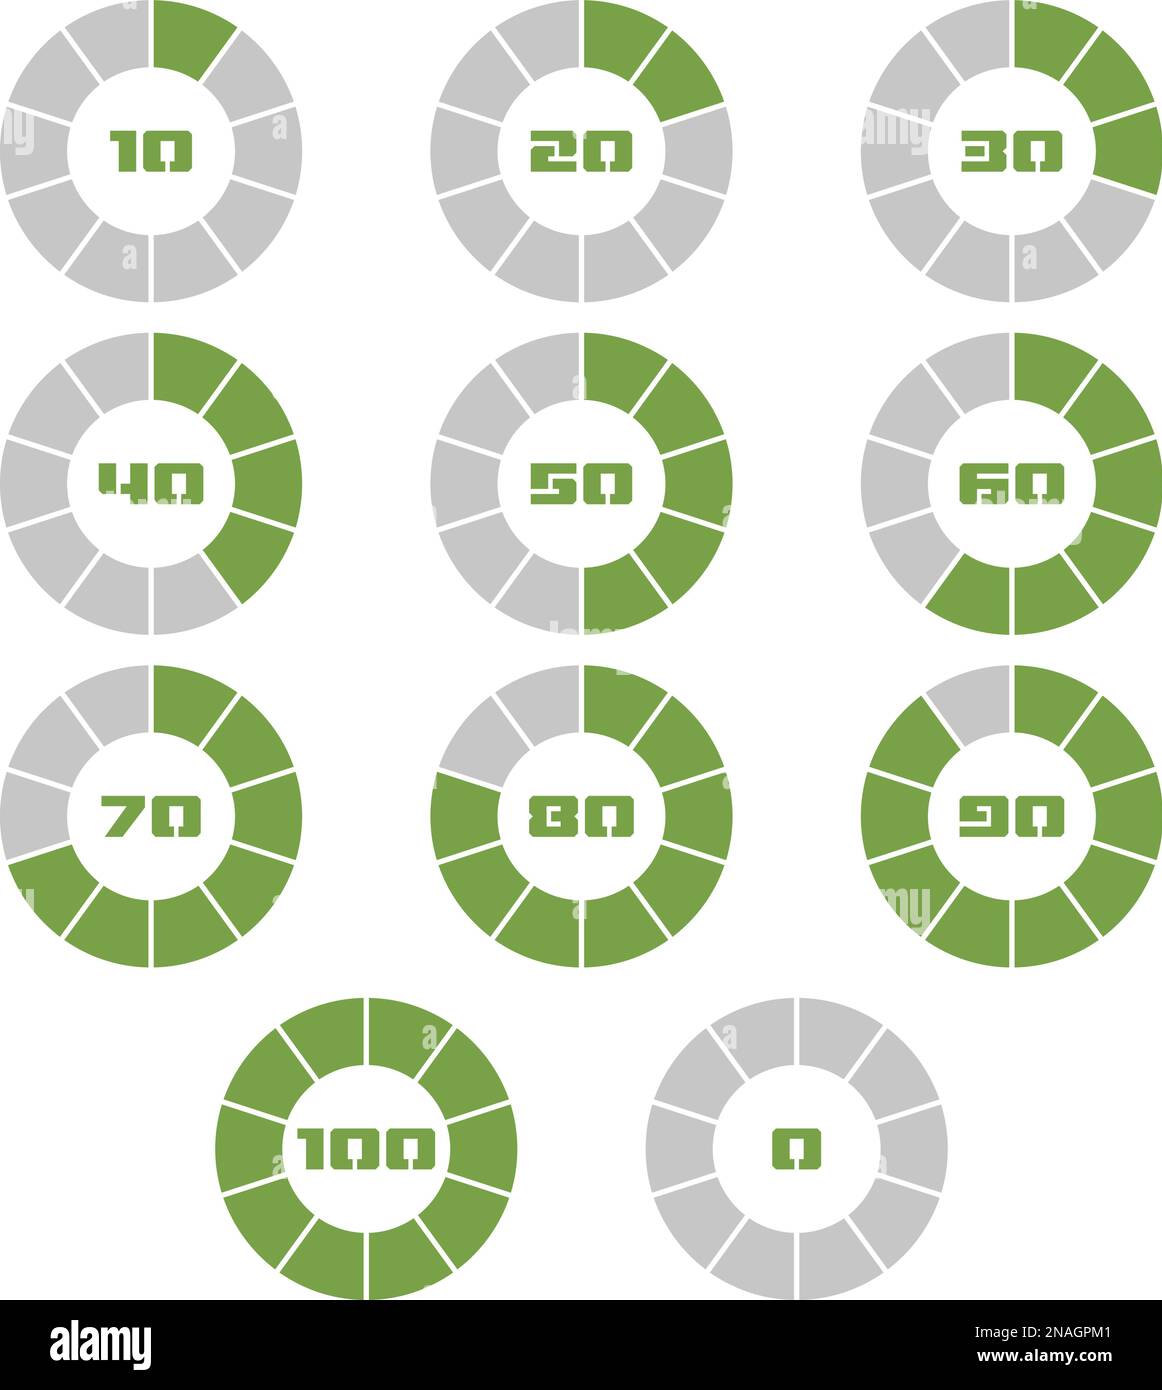 Colorful pie charts. Set of green percentage diagrams. Modern infographic elements Stock Vectorhttps://www.alamy.com/image-license-details/?v=1https://www.alamy.com/colorful-pie-charts-set-of-green-percentage-diagrams-modern-infographic-elements-image522826641.html
RF2NAGPM1–Colorful pie charts. Set of green percentage diagrams. Modern infographic elements
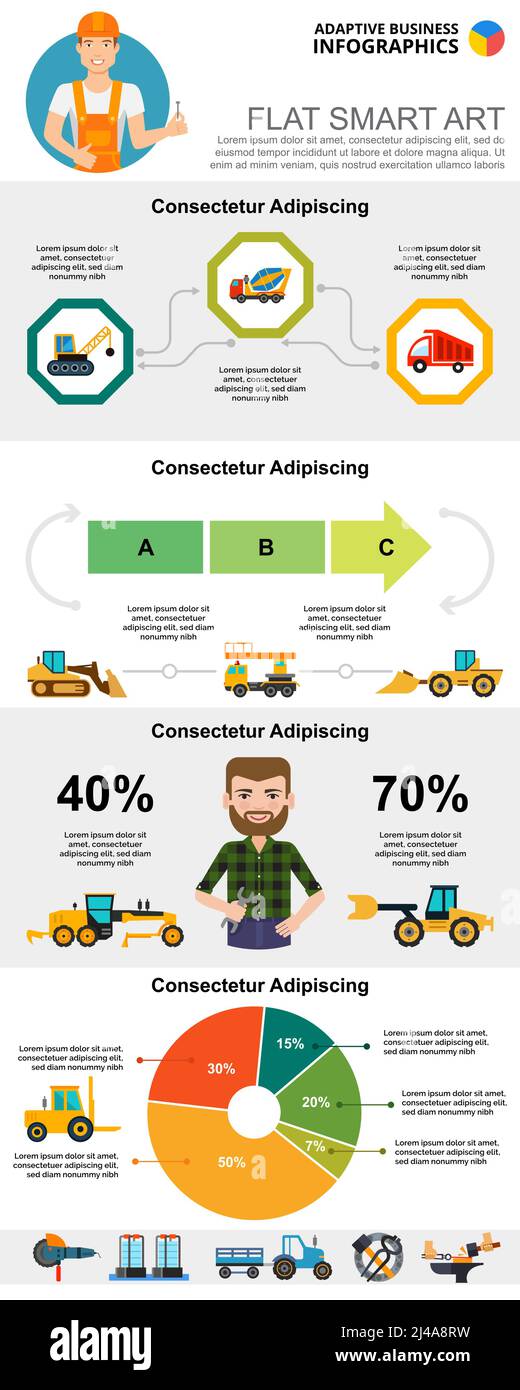 Construction and management concept infographic charts set. Business process and pie charts for presentation slide templates. For corporate report, ad Stock Vectorhttps://www.alamy.com/image-license-details/?v=1https://www.alamy.com/construction-and-management-concept-infographic-charts-set-business-process-and-pie-charts-for-presentation-slide-templates-for-corporate-report-ad-image467365021.html
RF2J4A8RW–Construction and management concept infographic charts set. Business process and pie charts for presentation slide templates. For corporate report, ad
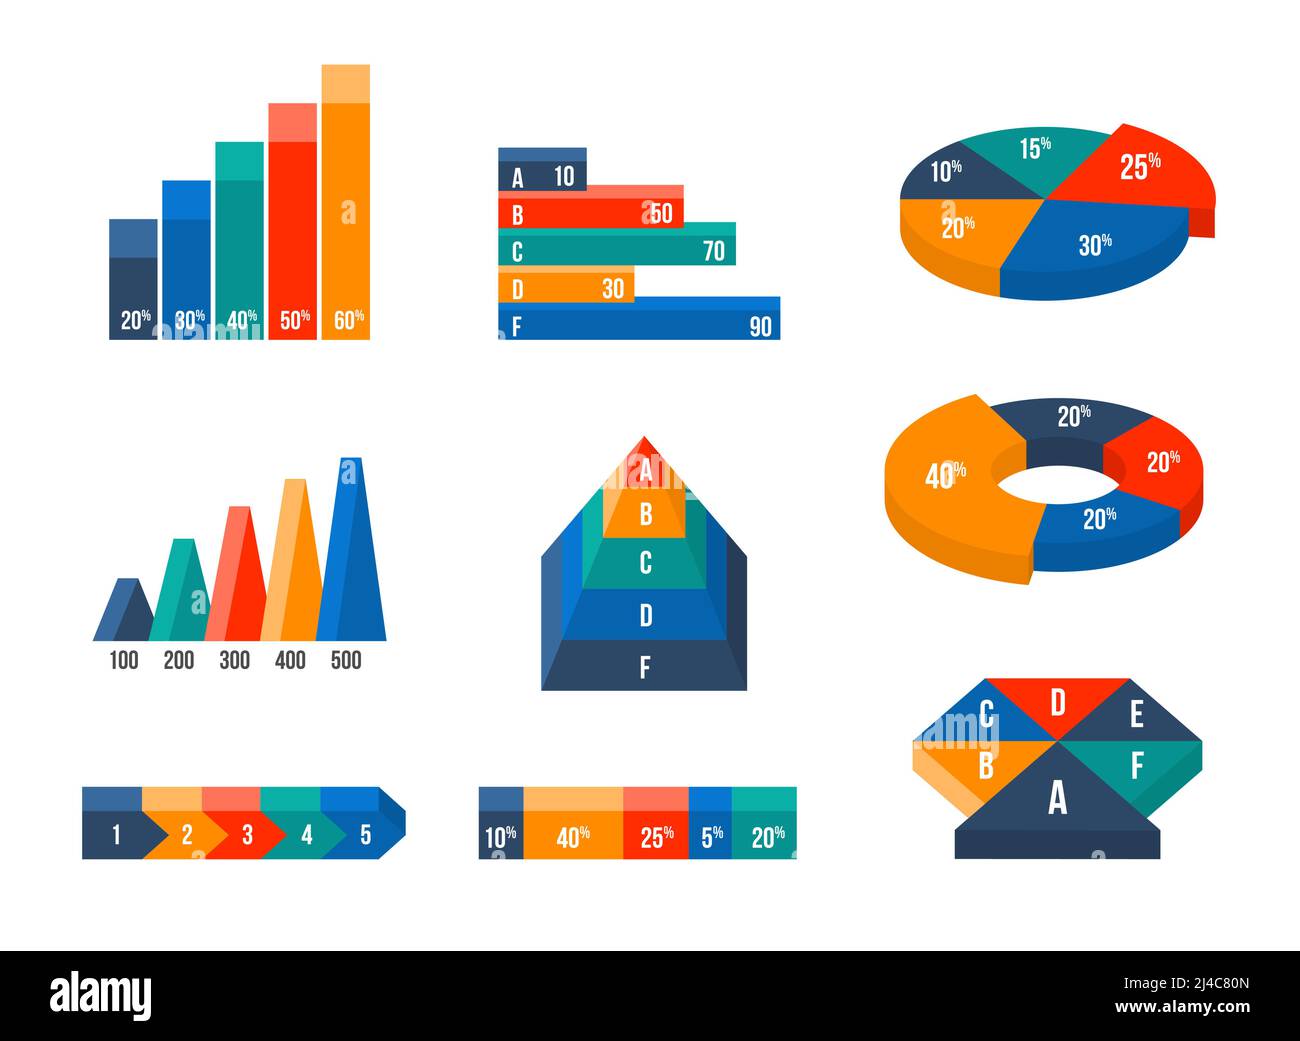 Charts, diagrams and graphs in modern isometric 3d flat style. Infographic presentation, design data finance, vector illustration Stock Vectorhttps://www.alamy.com/image-license-details/?v=1https://www.alamy.com/charts-diagrams-and-graphs-in-modern-isometric-3d-flat-style-infographic-presentation-design-data-finance-vector-illustration-image467408277.html
RF2J4C80N–Charts, diagrams and graphs in modern isometric 3d flat style. Infographic presentation, design data finance, vector illustration
 Modern infographic vector elements for business brochures. Use in website, corporate brochure, advertising and marketing. Pie charts, line graphs, bar Stock Vectorhttps://www.alamy.com/image-license-details/?v=1https://www.alamy.com/modern-infographic-vector-elements-for-business-brochures-use-in-website-corporate-brochure-advertising-and-marketing-pie-charts-line-graphs-bar-image344154583.html
RF2AYWGK3–Modern infographic vector elements for business brochures. Use in website, corporate brochure, advertising and marketing. Pie charts, line graphs, bar
 Management pie, scatter and bar charts template for presentation. Business data. Abstract elements of diagram, graphic. Company, analysis, management Stock Vectorhttps://www.alamy.com/image-license-details/?v=1https://www.alamy.com/management-pie-scatter-and-bar-charts-template-for-presentation-business-data-abstract-elements-of-diagram-graphic-company-analysis-management-image467358390.html
RF2J4A0B2–Management pie, scatter and bar charts template for presentation. Business data. Abstract elements of diagram, graphic. Company, analysis, management
 Online survey results analysis. Pie charts, infographics, analyzing process. Business and financial reports analytics. Social poll answers statistics. Stock Vectorhttps://www.alamy.com/image-license-details/?v=1https://www.alamy.com/online-survey-results-analysis-pie-charts-infographics-analyzing-process-business-and-financial-reports-analytics-social-poll-answers-statistics-image467049395.html
RF2J3RX7F–Online survey results analysis. Pie charts, infographics, analyzing process. Business and financial reports analytics. Social poll answers statistics.
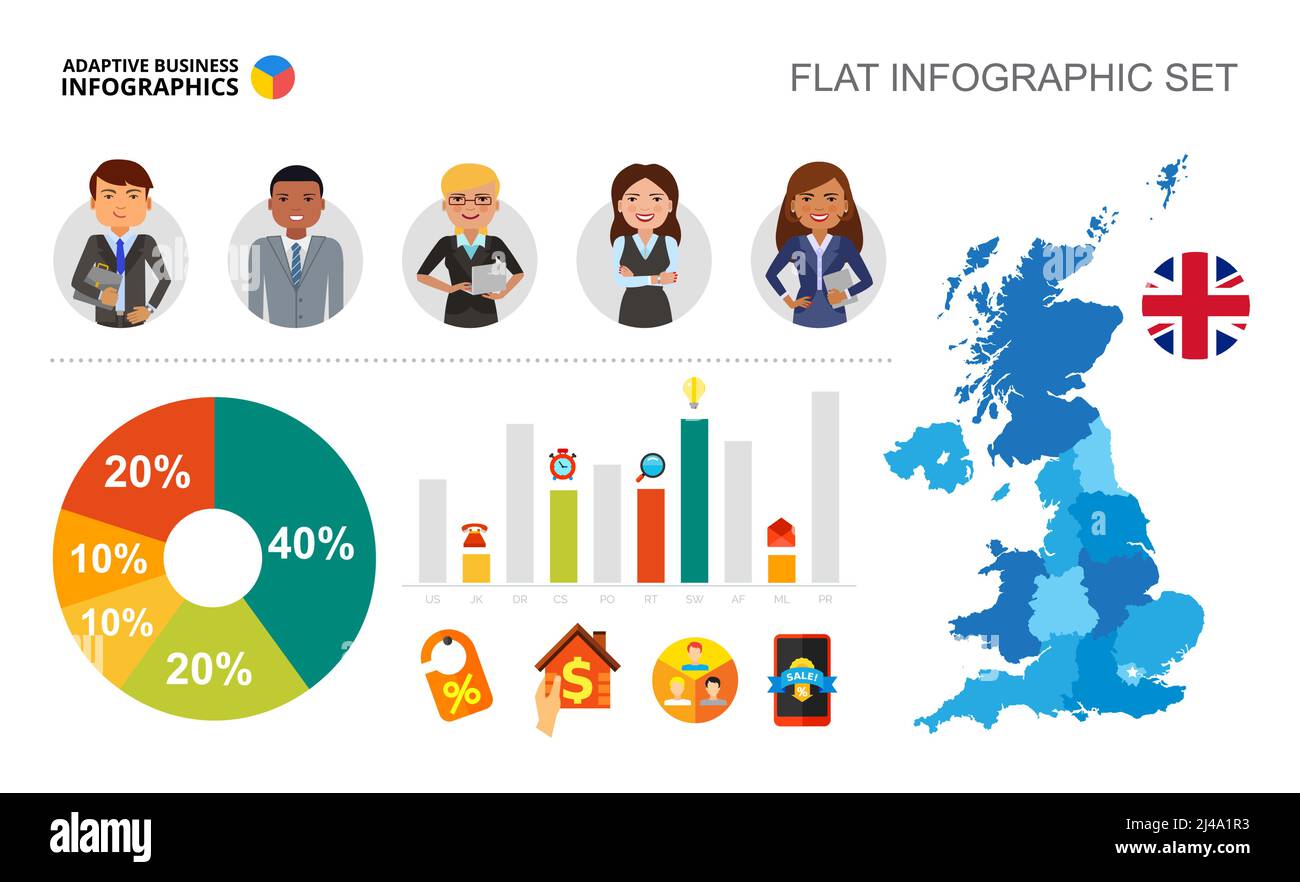 Progress review bar and pie charts template for presentation. Business data visualization. Workflow, finance, accounting or management creative concep Stock Vectorhttps://www.alamy.com/image-license-details/?v=1https://www.alamy.com/progress-review-bar-and-pie-charts-template-for-presentation-business-data-visualization-workflow-finance-accounting-or-management-creative-concep-image467359511.html
RF2J4A1R3–Progress review bar and pie charts template for presentation. Business data visualization. Workflow, finance, accounting or management creative concep
 Online survey results analysis. Pie charts, infographics, analyzing process. Business and financial reports analytics. Social poll answers statistics. Stock Vectorhttps://www.alamy.com/image-license-details/?v=1https://www.alamy.com/online-survey-results-analysis-pie-charts-infographics-analyzing-process-business-and-financial-reports-analytics-social-poll-answers-statistics-image467069332.html
RF2J3TRKG–Online survey results analysis. Pie charts, infographics, analyzing process. Business and financial reports analytics. Social poll answers statistics.
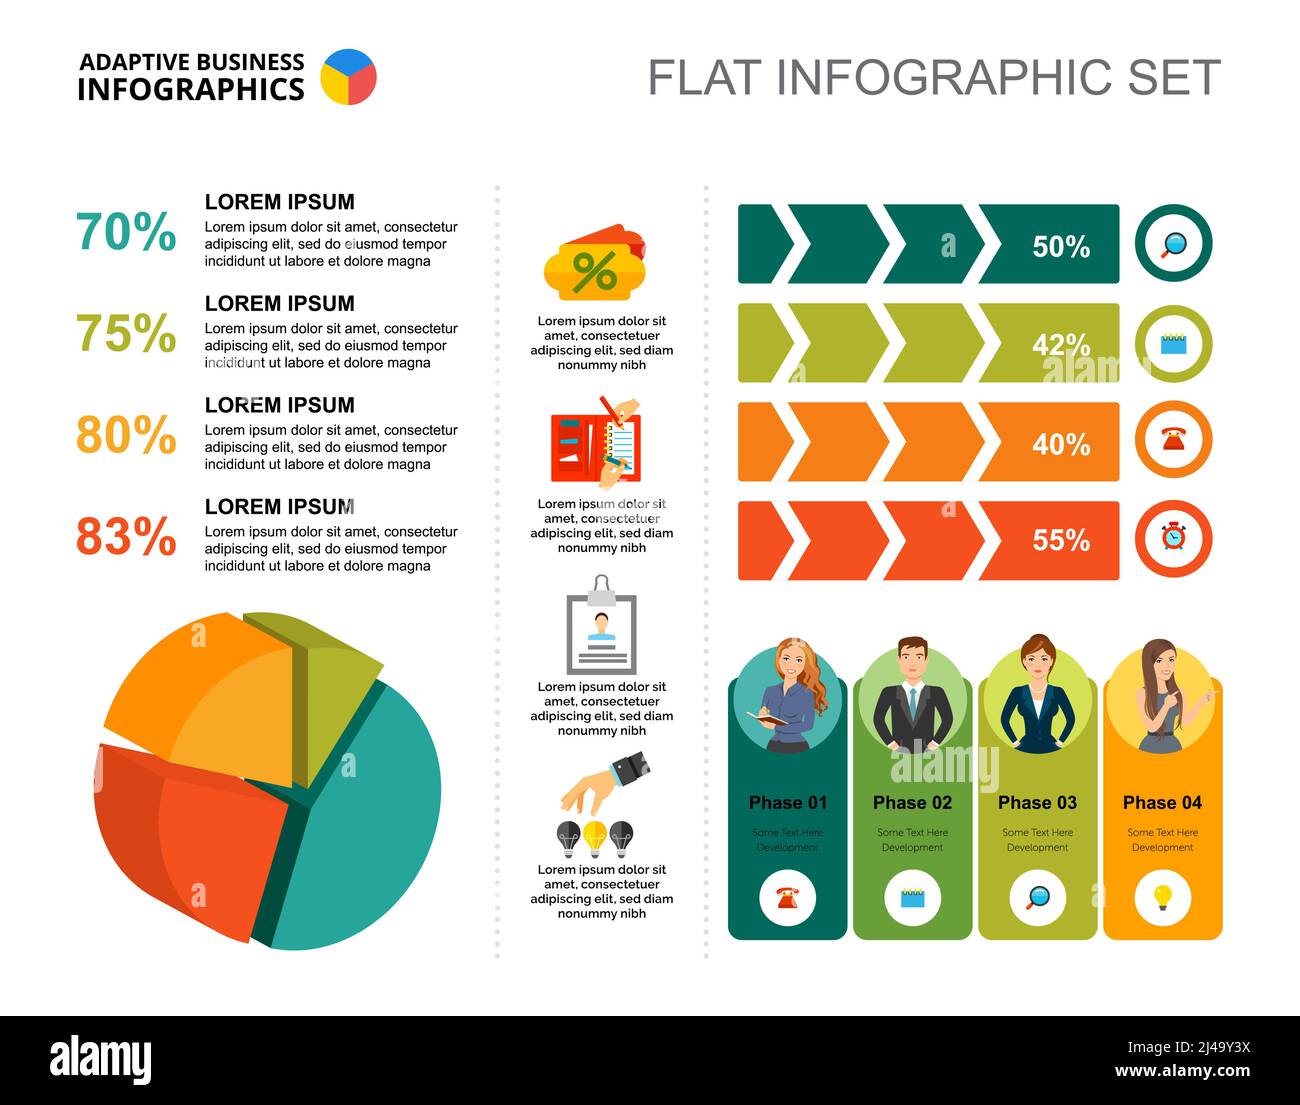 Four phases pie and percentage charts template for presentation. Vector illustration. Diagram, graph, infochart. Vision, management, planning or marke Stock Vectorhttps://www.alamy.com/image-license-details/?v=1https://www.alamy.com/four-phases-pie-and-percentage-charts-template-for-presentation-vector-illustration-diagram-graph-infochart-vision-management-planning-or-marke-image467357406.html
RF2J49Y3X–Four phases pie and percentage charts template for presentation. Vector illustration. Diagram, graph, infochart. Vision, management, planning or marke
 Disabled businessman in wheelchair show the poster with charts. Business concept - presentation, speech, annual report. Flat style vector clip art. Stock Vectorhttps://www.alamy.com/image-license-details/?v=1https://www.alamy.com/disabled-businessman-in-wheelchair-show-the-poster-with-charts-business-concept-presentation-speech-annual-report-flat-style-vector-clip-art-image376536825.html
RF2CTGMFN–Disabled businessman in wheelchair show the poster with charts. Business concept - presentation, speech, annual report. Flat style vector clip art.
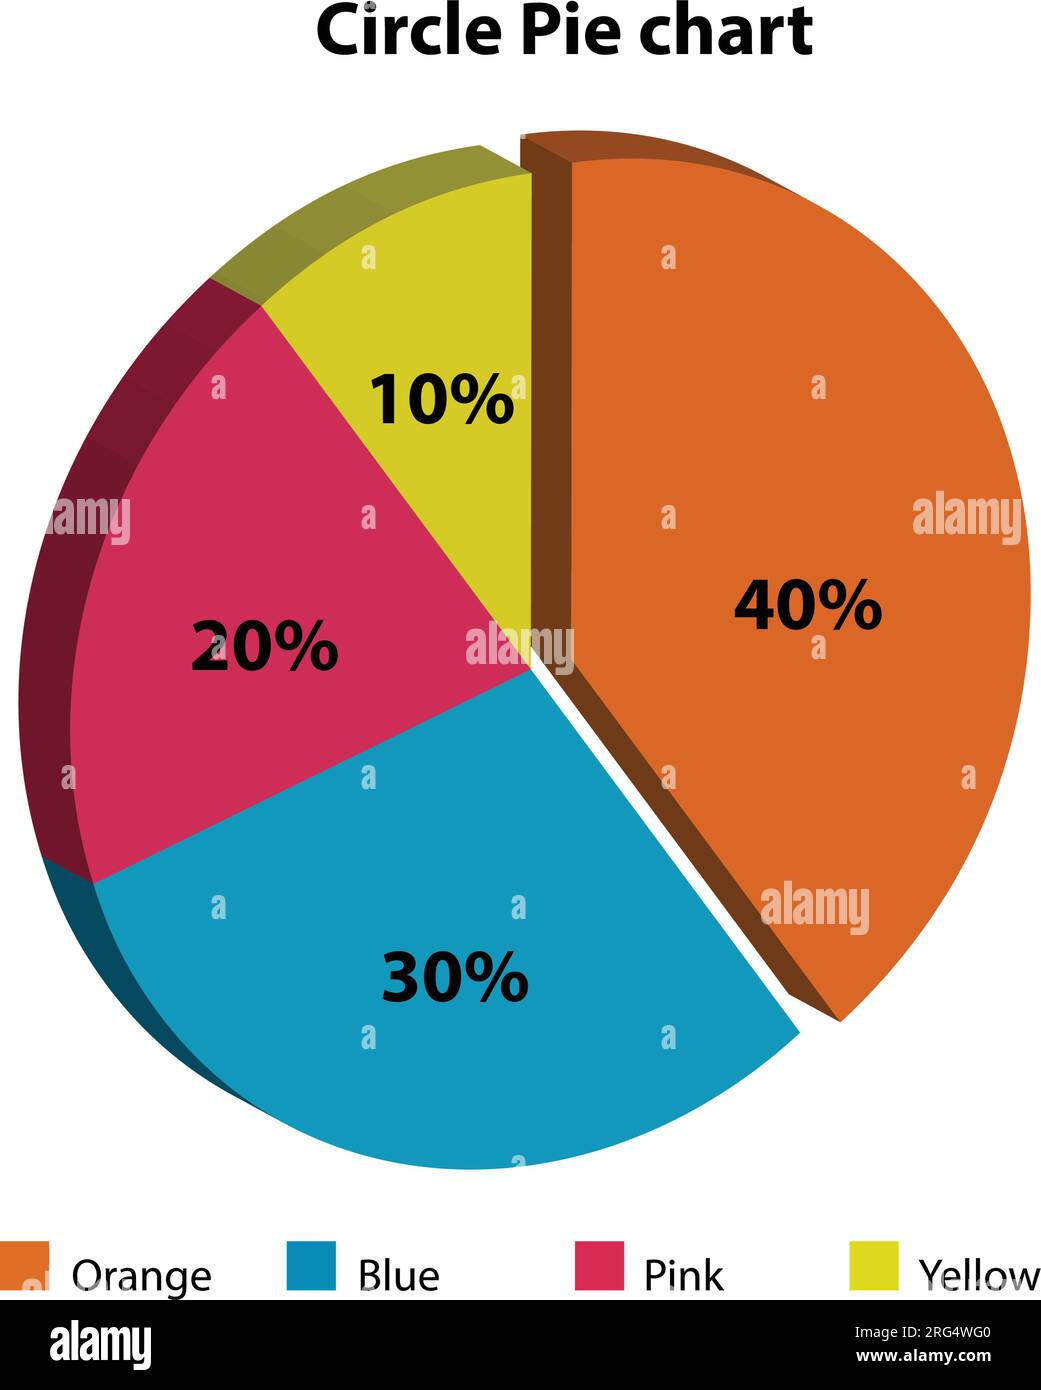 Different color circle pie chart. on white background Stock Vectorhttps://www.alamy.com/image-license-details/?v=1https://www.alamy.com/different-color-circle-pie-chart-on-white-background-image560674128.html
RF2RG4WG0–Different color circle pie chart. on white background
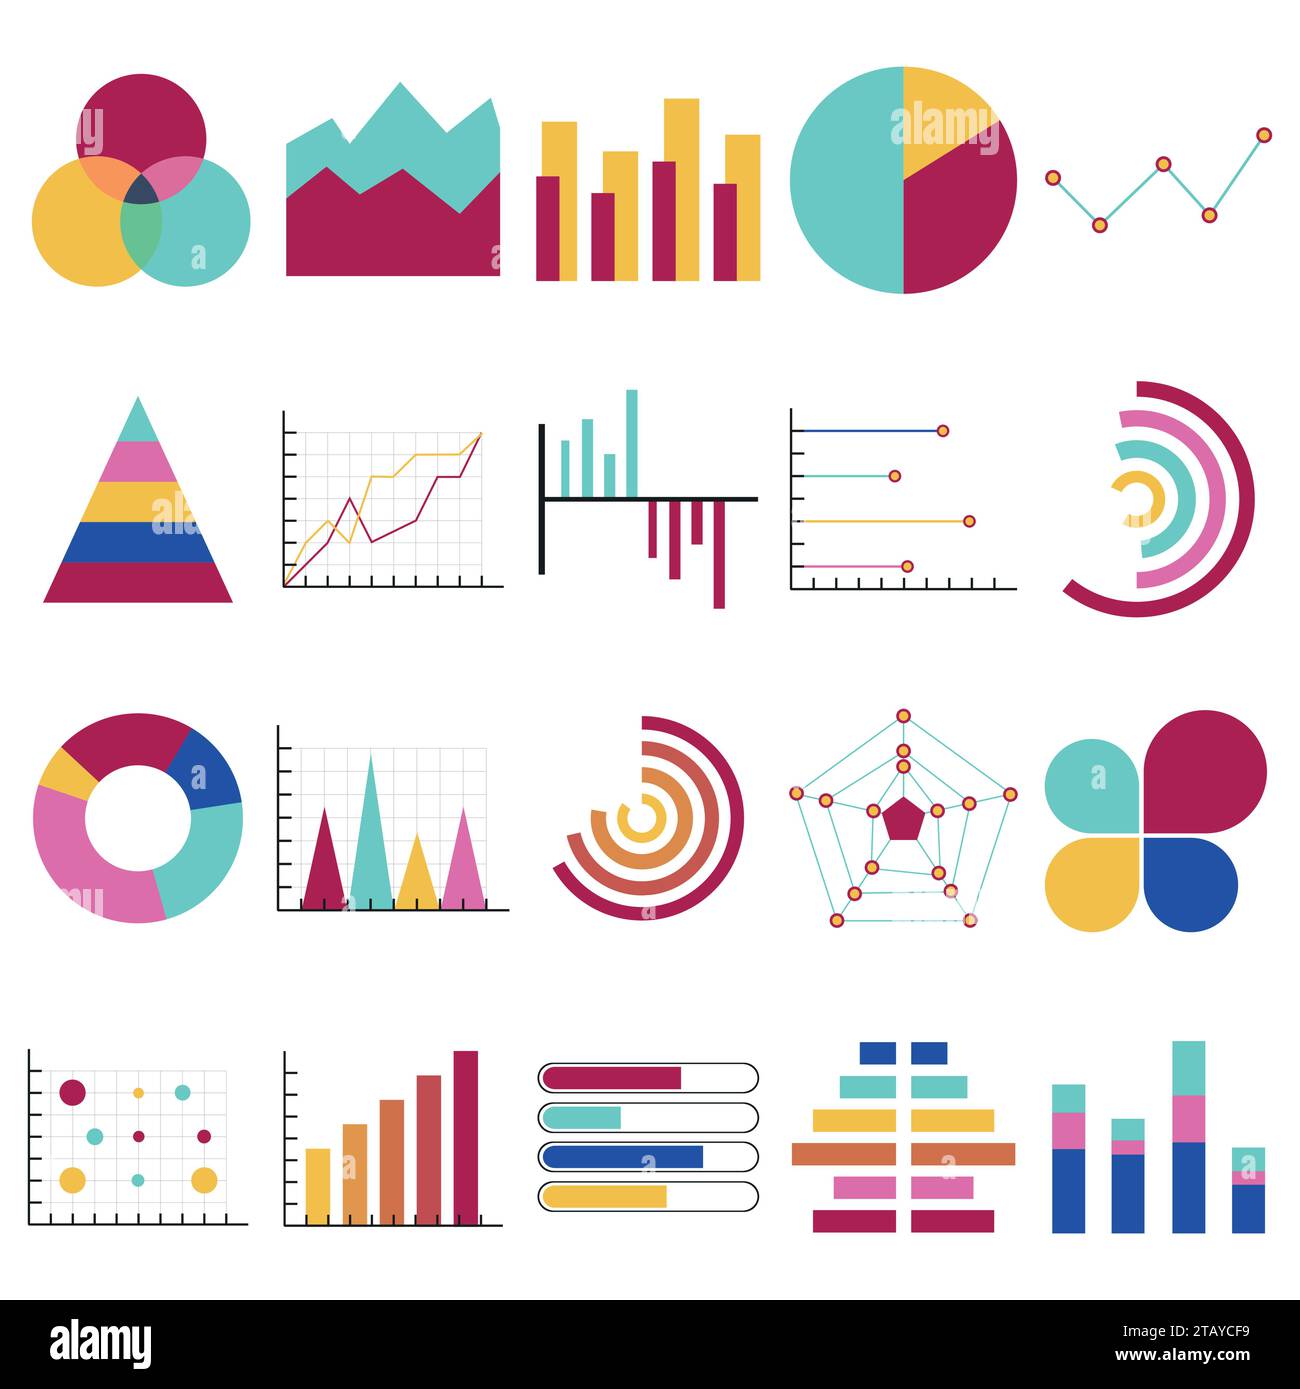 Business data graphs. Financial and marketing charts. Market elements dot bar pie charts diagrams and graphs. Business infographic flow sheet diagram. Stock Vectorhttps://www.alamy.com/image-license-details/?v=1https://www.alamy.com/business-data-graphs-financial-and-marketing-charts-market-elements-dot-bar-pie-charts-diagrams-and-graphs-business-infographic-flow-sheet-diagram-image574691245.html
RF2TAYCF9–Business data graphs. Financial and marketing charts. Market elements dot bar pie charts diagrams and graphs. Business infographic flow sheet diagram.
 Website analysis. SEO reports analytics. Pie charts, diagrams, computer monitor screen. Business and financial analyst annual presentation. Vector iso Stock Vectorhttps://www.alamy.com/image-license-details/?v=1https://www.alamy.com/website-analysis-seo-reports-analytics-pie-charts-diagrams-computer-monitor-screen-business-and-financial-analyst-annual-presentation-vector-iso-image467049368.html
RF2J3RX6G–Website analysis. SEO reports analytics. Pie charts, diagrams, computer monitor screen. Business and financial analyst annual presentation. Vector iso
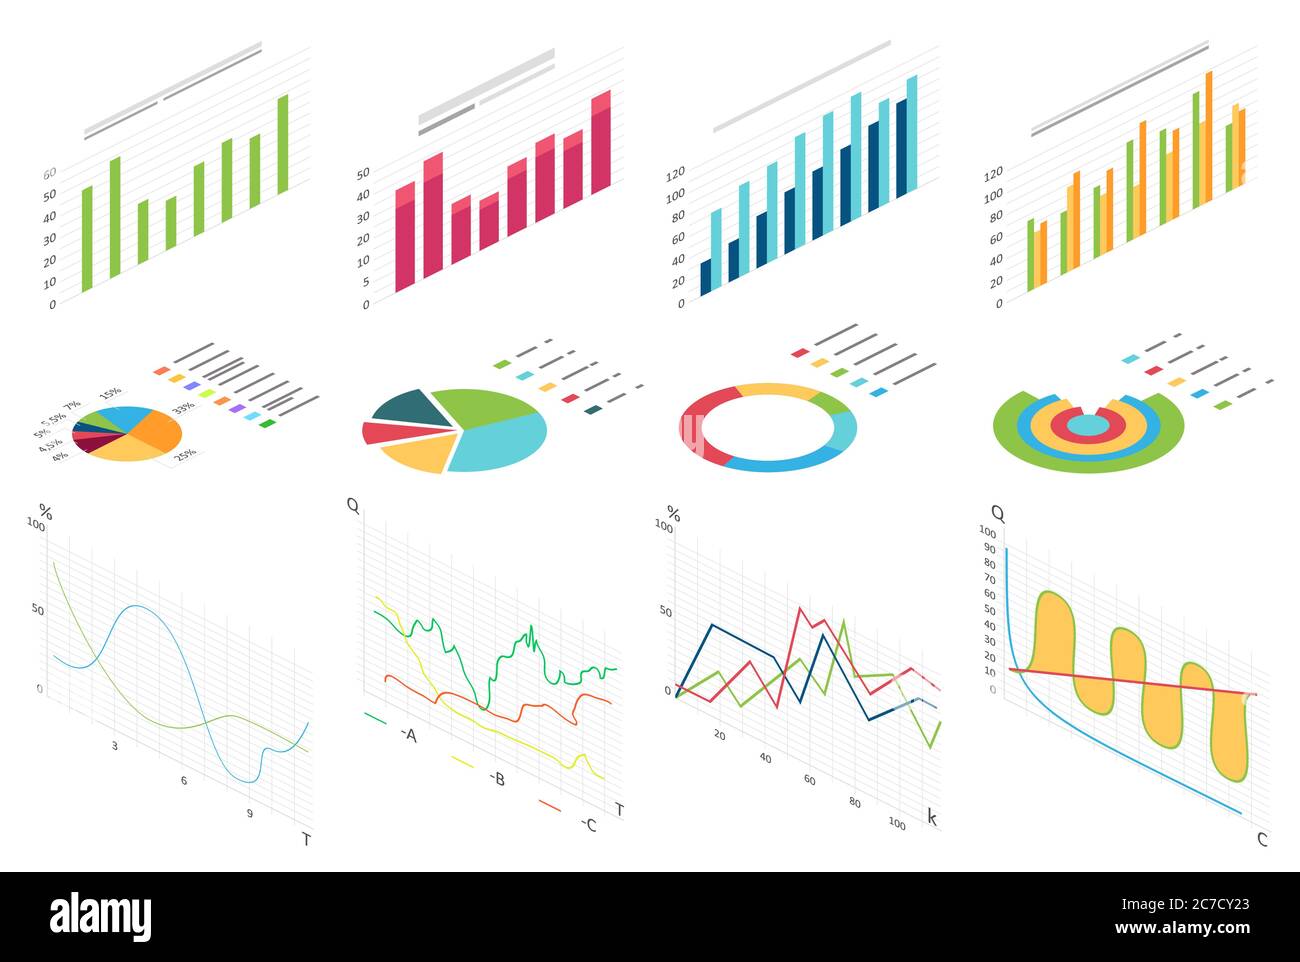 Isometric flat data finance graphic, business finance charts for infographic. Waves graph data, 2d diagram statistics, information columns isolated vector illustration Stock Vectorhttps://www.alamy.com/image-license-details/?v=1https://www.alamy.com/isometric-flat-data-finance-graphic-business-finance-charts-for-infographic-waves-graph-data-2d-diagram-statistics-information-columns-isolated-vector-illustration-image366004971.html
RF2C7CY23–Isometric flat data finance graphic, business finance charts for infographic. Waves graph data, 2d diagram statistics, information columns isolated vector illustration
RFKNF1WF–Chart icon bar symbol for web site design, logo, app, UI. Vector illustration.
RFMDYYWM–Box plot chart company logo design template, Business corporate vector icon
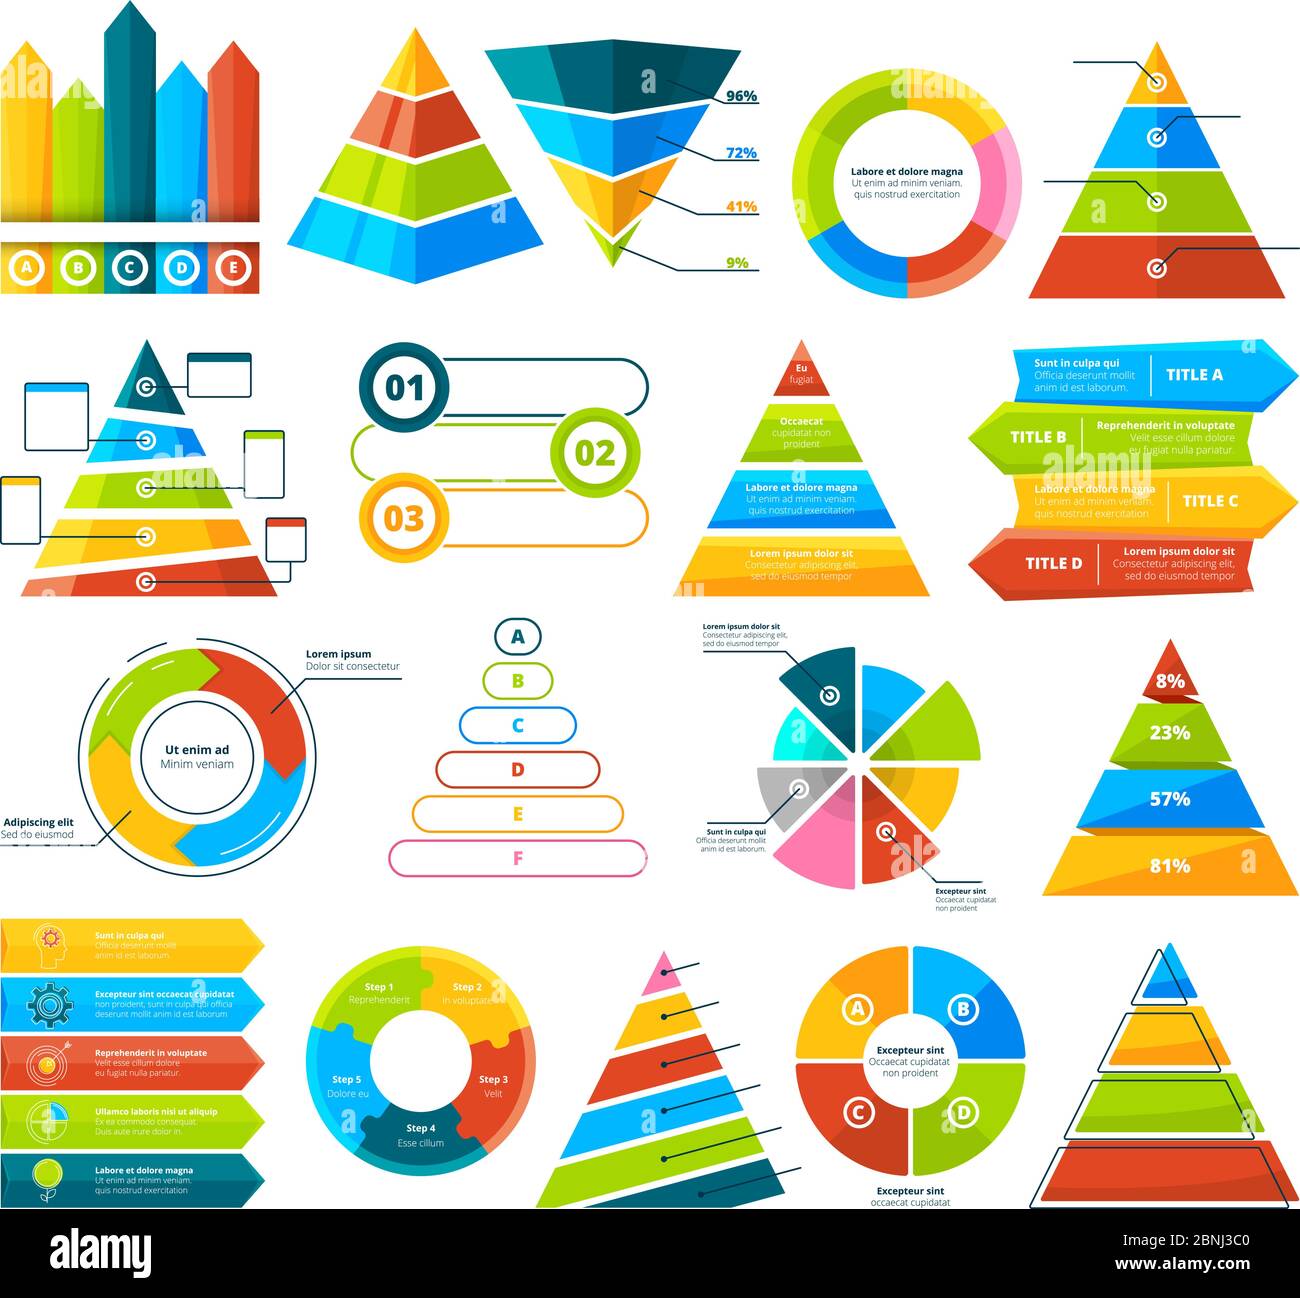 Big vector collection of infographic elements. Pie charts, graphs, diagram and triangles Stock Vectorhttps://www.alamy.com/image-license-details/?v=1https://www.alamy.com/big-vector-collection-of-infographic-elements-pie-charts-graphs-diagram-and-triangles-image357512960.html
RF2BNJ3C0–Big vector collection of infographic elements. Pie charts, graphs, diagram and triangles
RF2JB8RN9–Business data market elements dot bar pie charts diagrams and graphs flat icons set isolated vector illustration.
RF2AF8C7D–flat marketing agent graph presentation icon apps logo
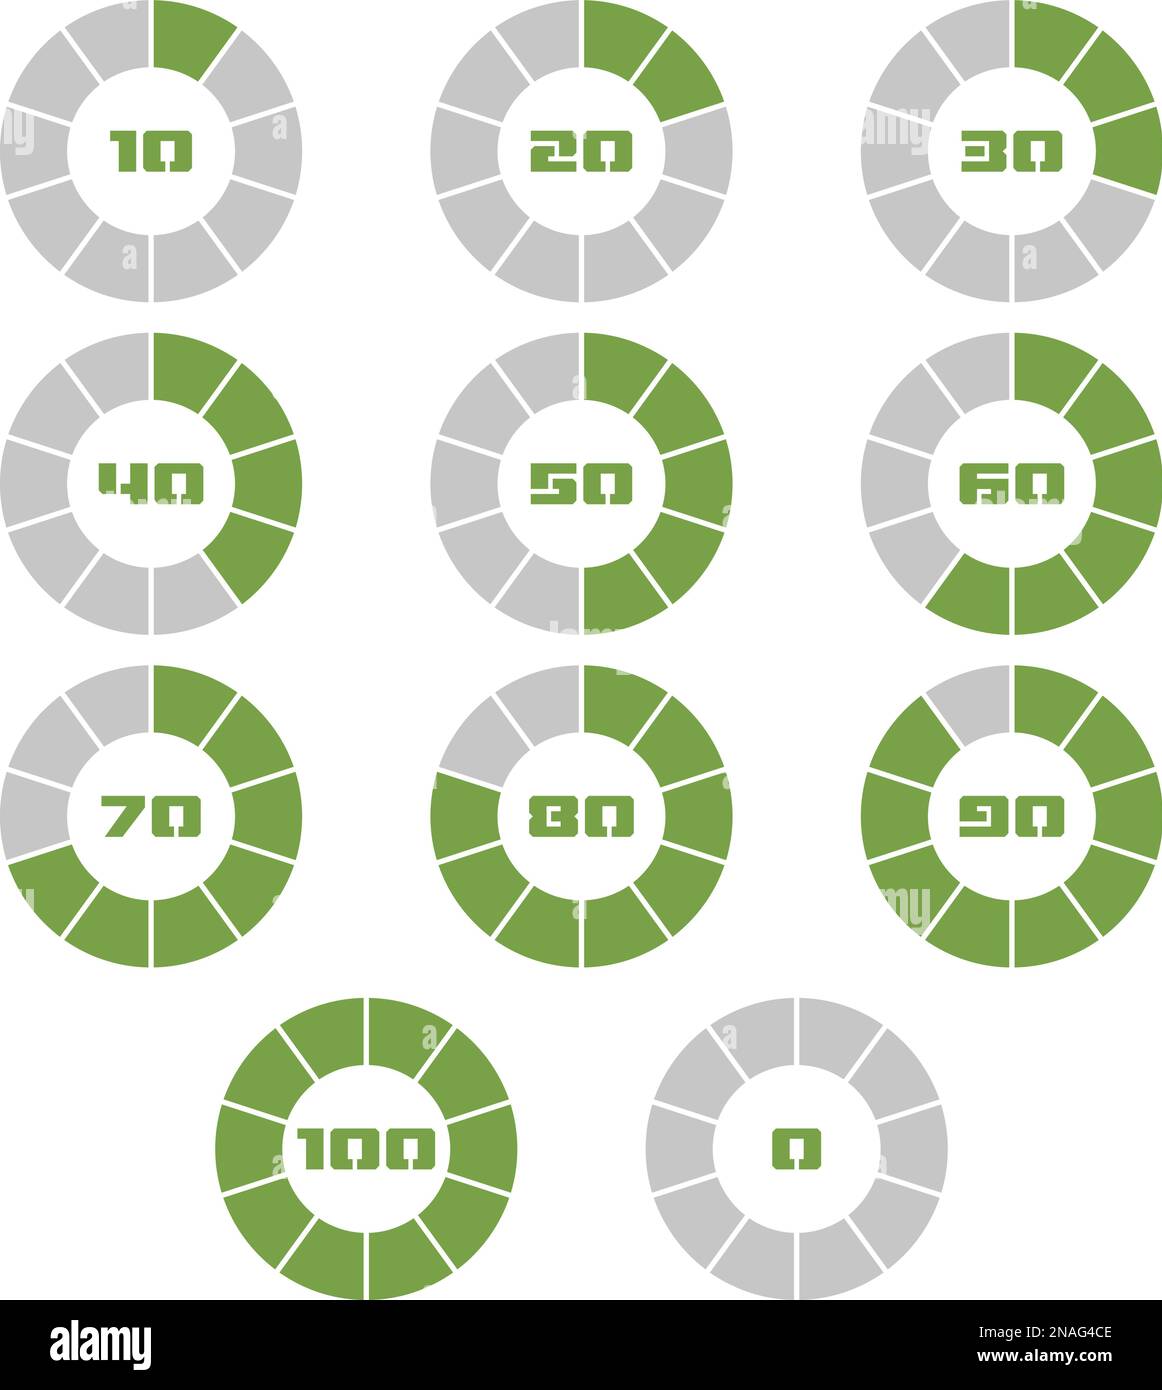 Colorful pie charts. Set of green percentage diagrams. Modern infographic elements Stock Vectorhttps://www.alamy.com/image-license-details/?v=1https://www.alamy.com/colorful-pie-charts-set-of-green-percentage-diagrams-modern-infographic-elements-image522812318.html
RF2NAG4CE–Colorful pie charts. Set of green percentage diagrams. Modern infographic elements
RFGDKJTG–Human body health care infographics, with medical icons, organs, charts, diagarms and copy space
 Illustration of business people making a presentation with the use of a white board showing pie-charts and graphs.business woman and man in the office Stock Vectorhttps://www.alamy.com/image-license-details/?v=1https://www.alamy.com/stock-photo-illustration-of-business-people-making-a-presentation-with-the-use-95038568.html
RFFEHAJG–Illustration of business people making a presentation with the use of a white board showing pie-charts and graphs.business woman and man in the office
 Modern infographic vector elements for business brochures. Use in website, corporate brochure, advertising and marketing. Pie charts, line graphs, bar Stock Vectorhttps://www.alamy.com/image-license-details/?v=1https://www.alamy.com/modern-infographic-vector-elements-for-business-brochures-use-in-website-corporate-brochure-advertising-and-marketing-pie-charts-line-graphs-bar-image344170593.html
RF2AYX92W–Modern infographic vector elements for business brochures. Use in website, corporate brochure, advertising and marketing. Pie charts, line graphs, bar
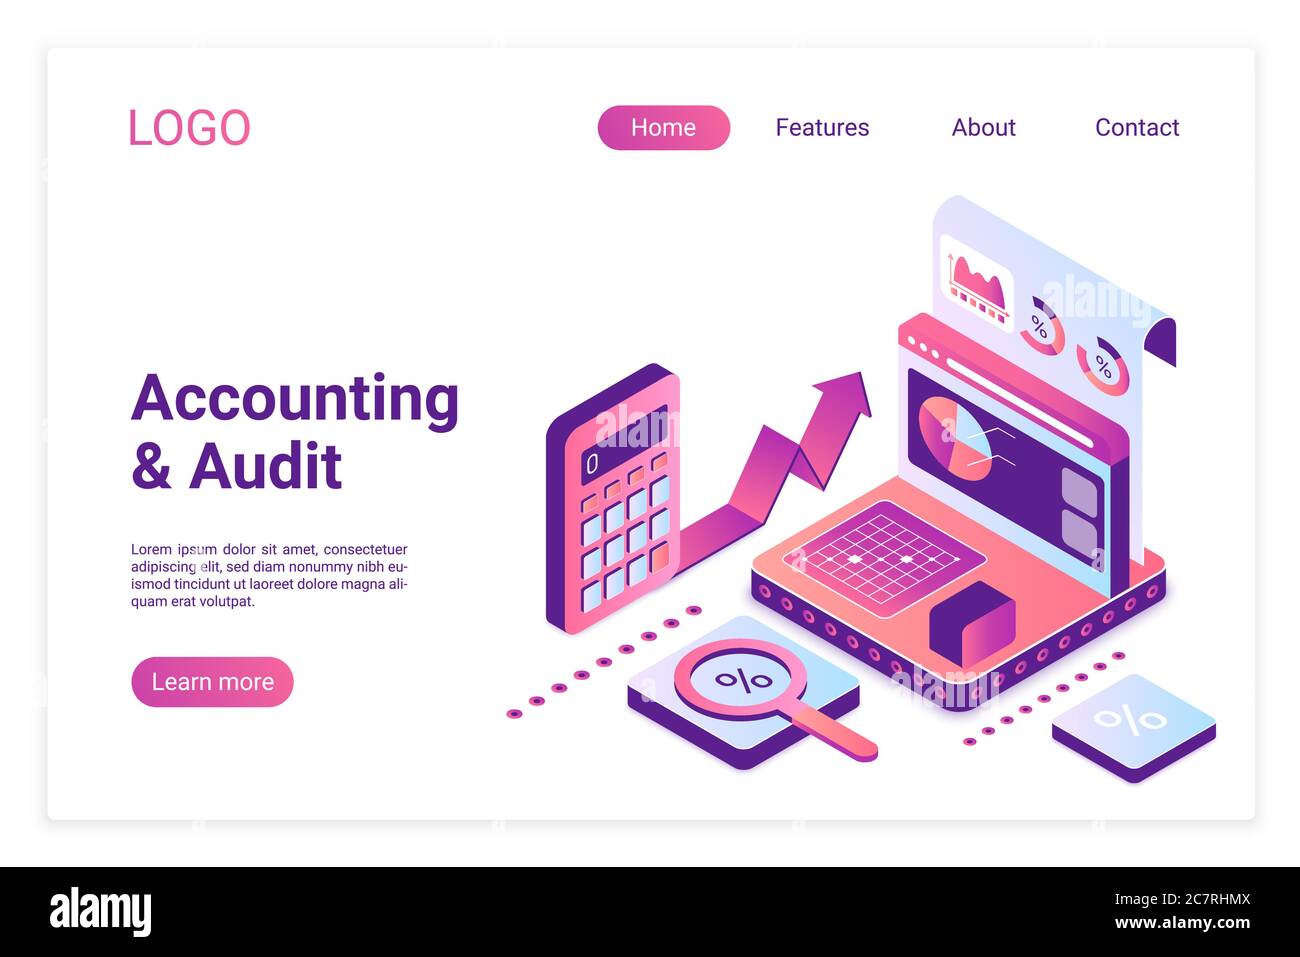 Accounting and audit isometric landing page template. Financial analytics report on 3d screen. Company growth rates statistics in pie charts. Consulting services website page design layout. Stock Vectorhttps://www.alamy.com/image-license-details/?v=1https://www.alamy.com/accounting-and-audit-isometric-landing-page-template-financial-analytics-report-on-3d-screen-company-growth-rates-statistics-in-pie-charts-consulting-services-website-page-design-layout-image366239130.html
RF2C7RHMX–Accounting and audit isometric landing page template. Financial analytics report on 3d screen. Company growth rates statistics in pie charts. Consulting services website page design layout.
RFTX6A4A–Set pie chart icons. Circle diagram vector. Collection Charts graphs logo template. Flat design.
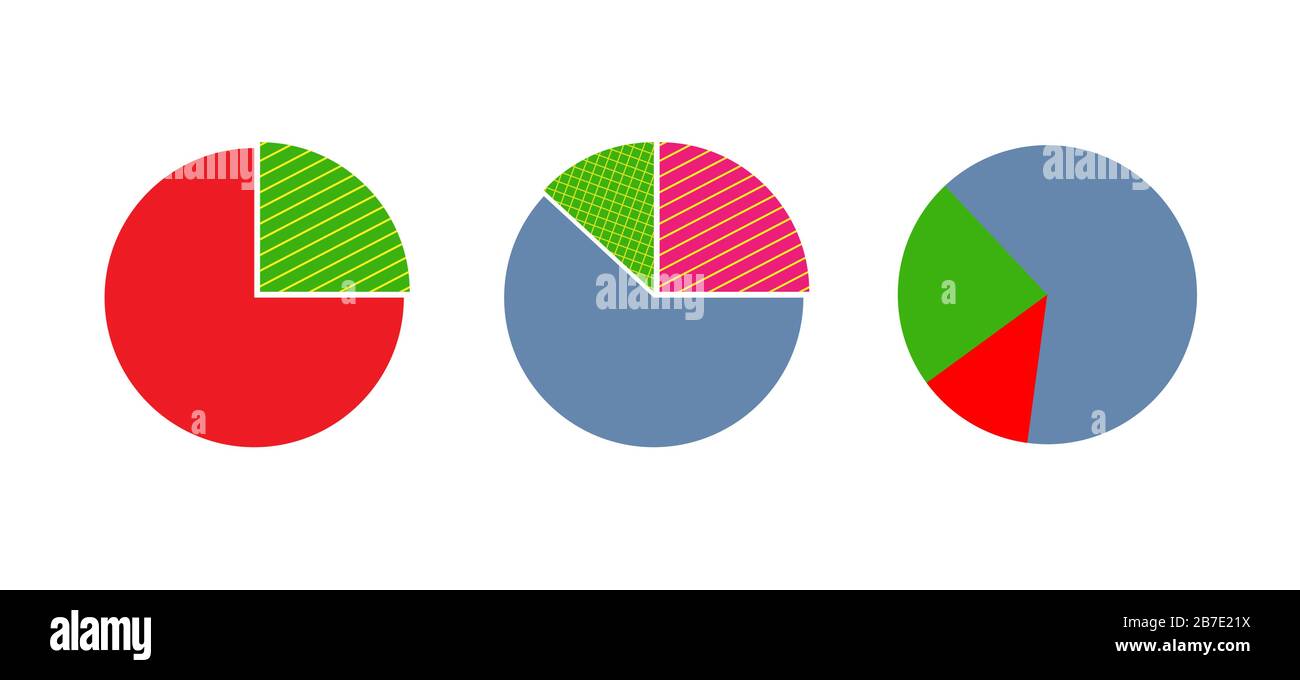 set of pie charts. Simple flat design for infographics, charts and visual display of business or Finance indicators. Stock Vectorhttps://www.alamy.com/image-license-details/?v=1https://www.alamy.com/set-of-pie-charts-simple-flat-design-for-infographics-charts-and-visual-display-of-business-or-finance-indicators-image348818902.html
RF2B7E21X–set of pie charts. Simple flat design for infographics, charts and visual display of business or Finance indicators.
RF2A6DN05–Document with diagrams and pie charts flat color icon.
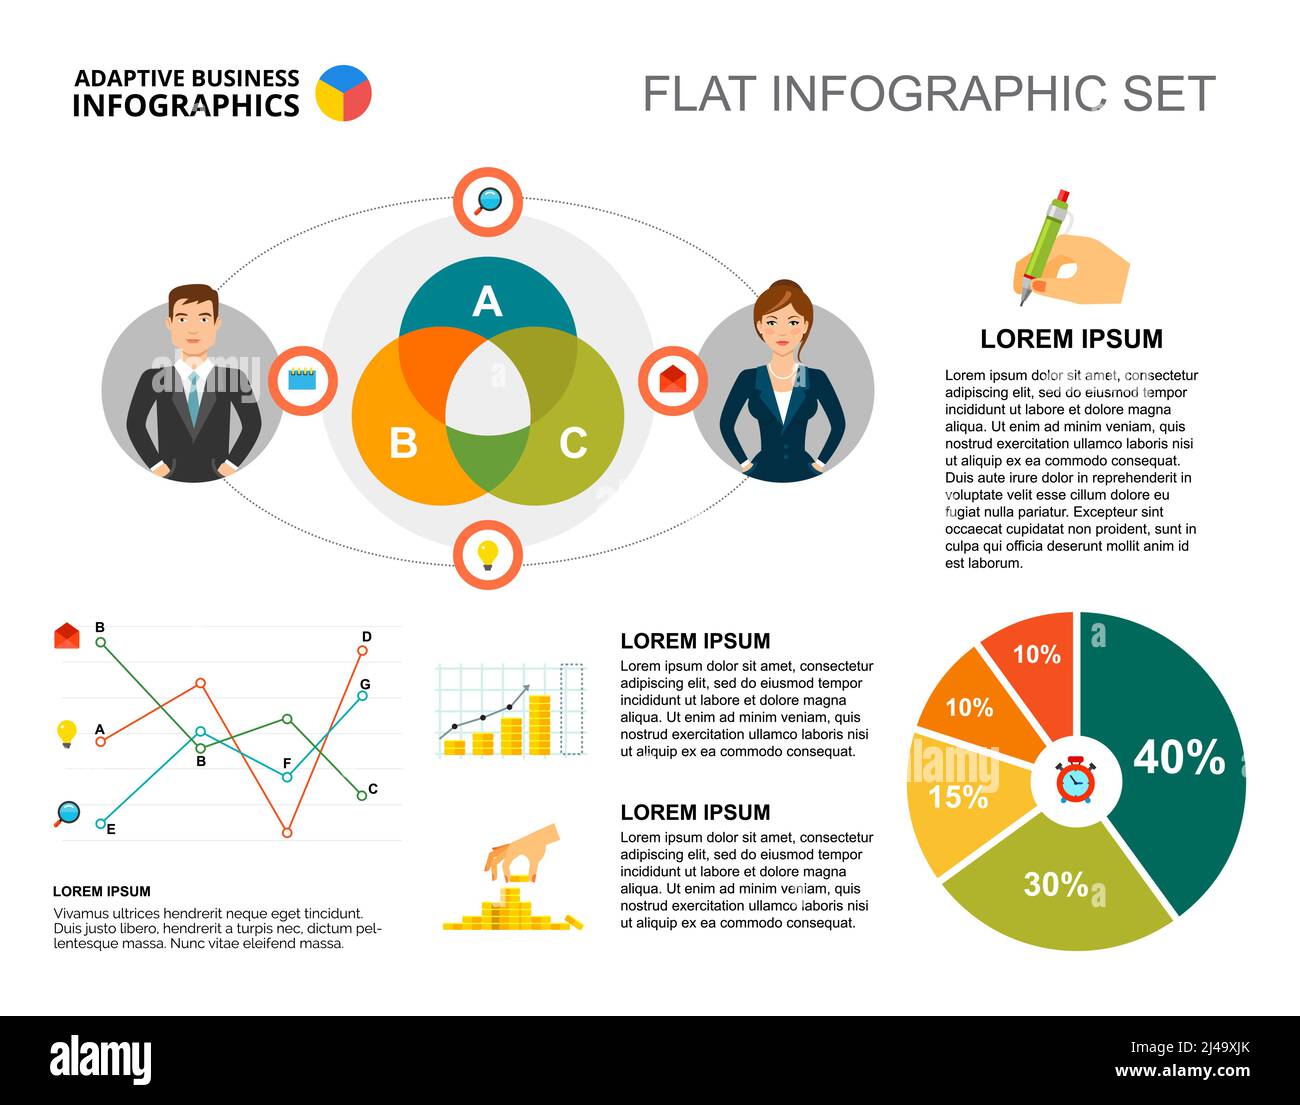 Financial pie and line charts template for presentation. Vector illustration. Diagram, graph, infochart. Vision, research, planning or marketing conce Stock Vectorhttps://www.alamy.com/image-license-details/?v=1https://www.alamy.com/financial-pie-and-line-charts-template-for-presentation-vector-illustration-diagram-graph-infochart-vision-research-planning-or-marketing-conce-image467357035.html
RF2J49XJK–Financial pie and line charts template for presentation. Vector illustration. Diagram, graph, infochart. Vision, research, planning or marketing conce
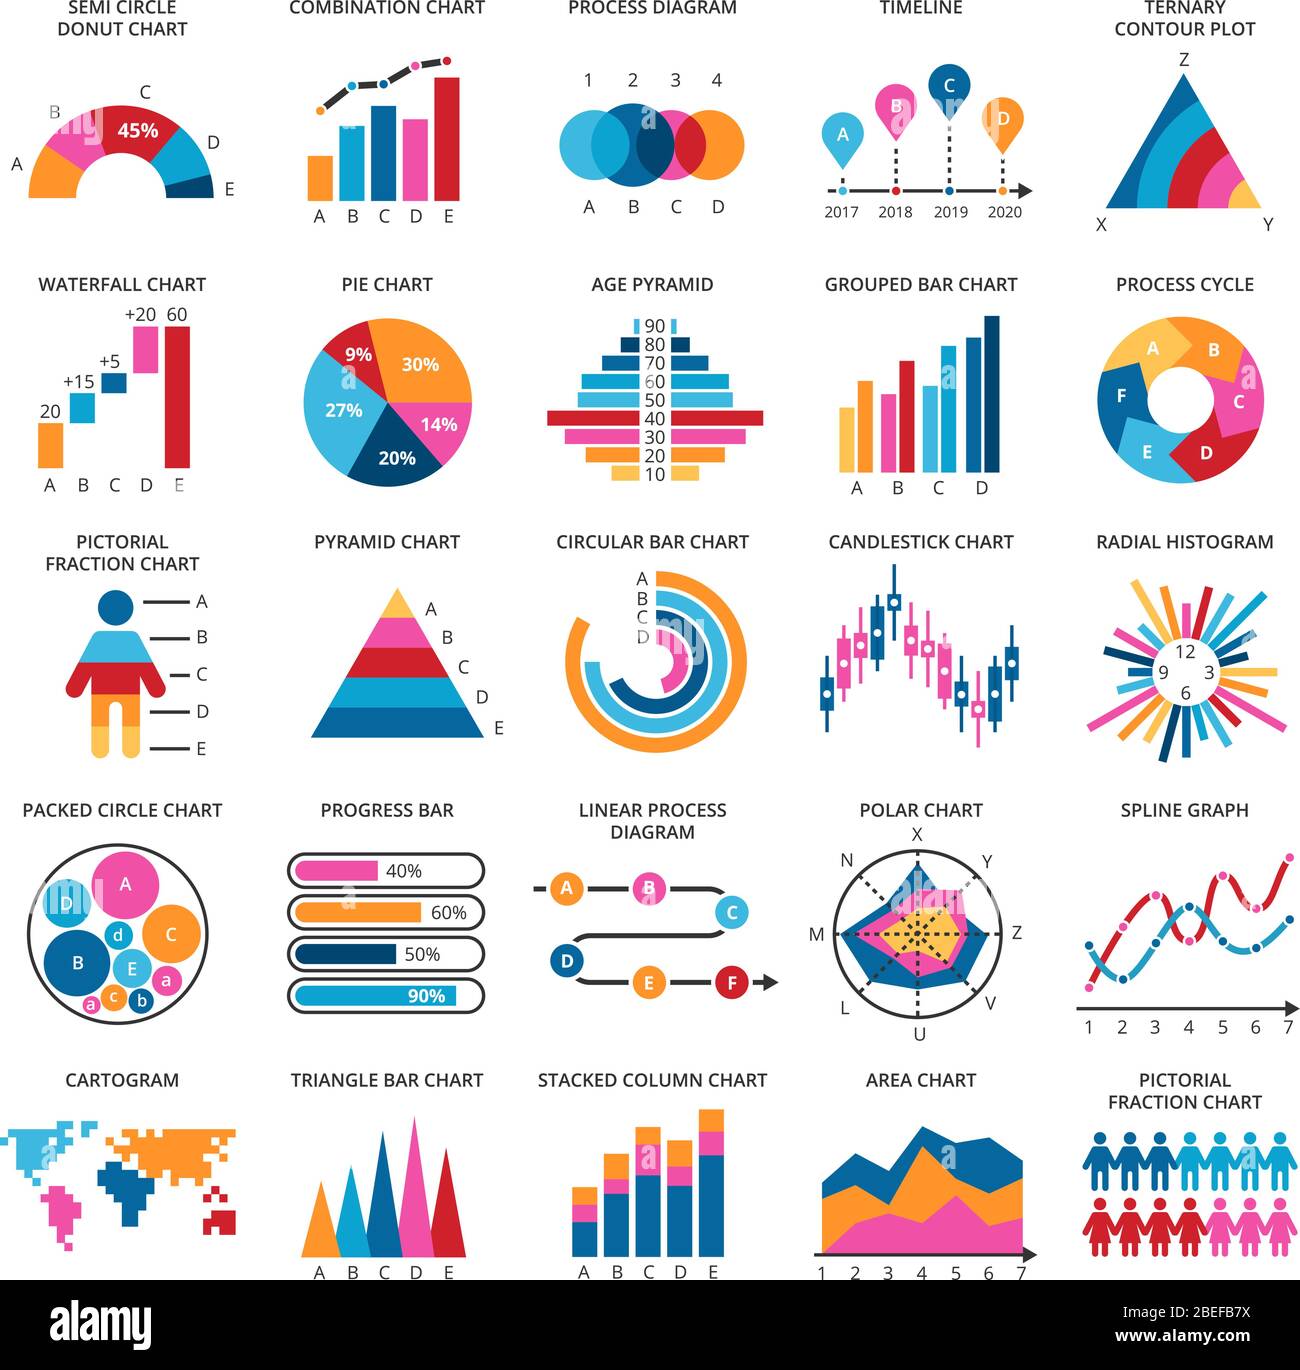 Business data graphs. Vector financial and marketing charts. Illustration of data financial graph and diagram Stock Vectorhttps://www.alamy.com/image-license-details/?v=1https://www.alamy.com/business-data-graphs-vector-financial-and-marketing-charts-illustration-of-data-financial-graph-and-diagram-image353150670.html
RF2BEFB7X–Business data graphs. Vector financial and marketing charts. Illustration of data financial graph and diagram
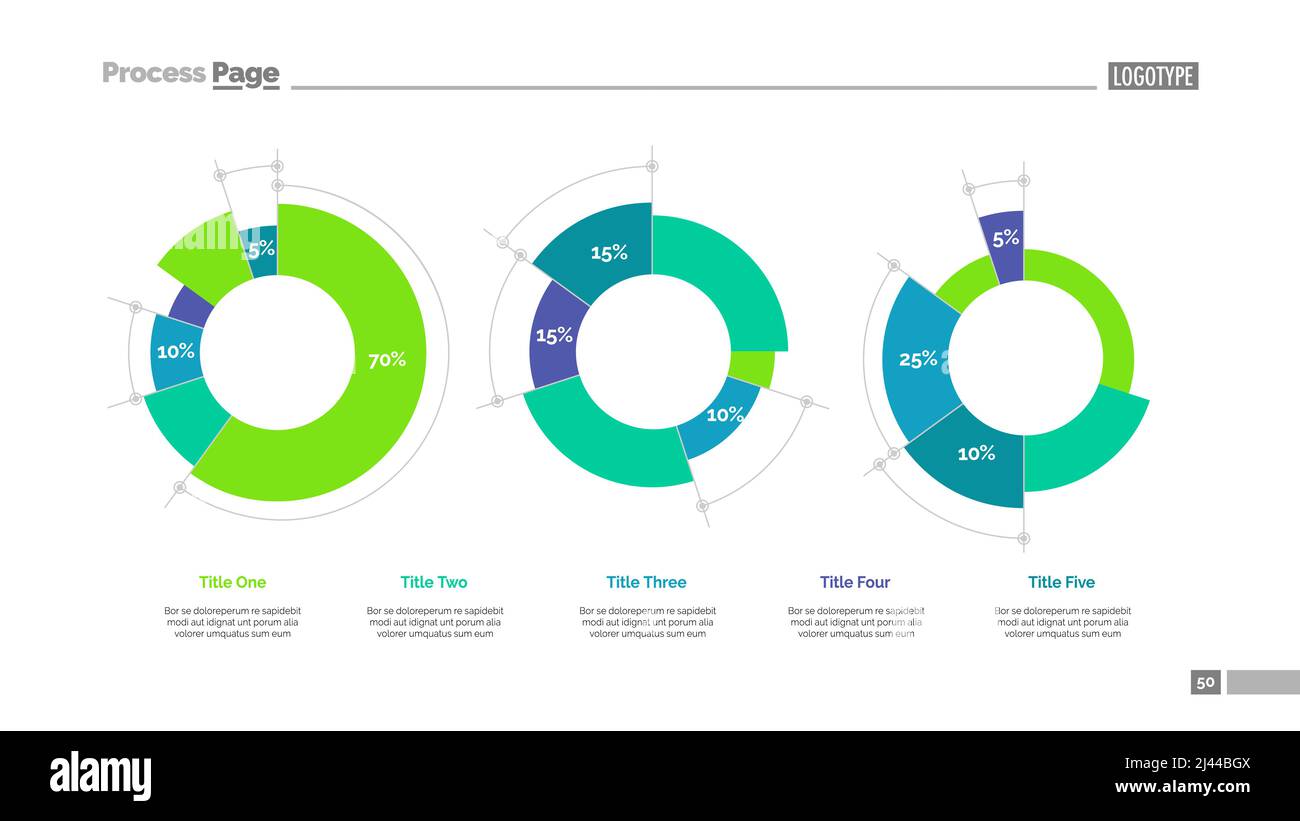 Pie charts slide template. Business data. Graph, diagram, design. Creative concept for infographic, templates, presentation, marketing, report. Can be Stock Vectorhttps://www.alamy.com/image-license-details/?v=1https://www.alamy.com/pie-charts-slide-template-business-data-graph-diagram-design-creative-concept-for-infographic-templates-presentation-marketing-report-can-be-image467235466.html
RF2J44BGX–Pie charts slide template. Business data. Graph, diagram, design. Creative concept for infographic, templates, presentation, marketing, report. Can be
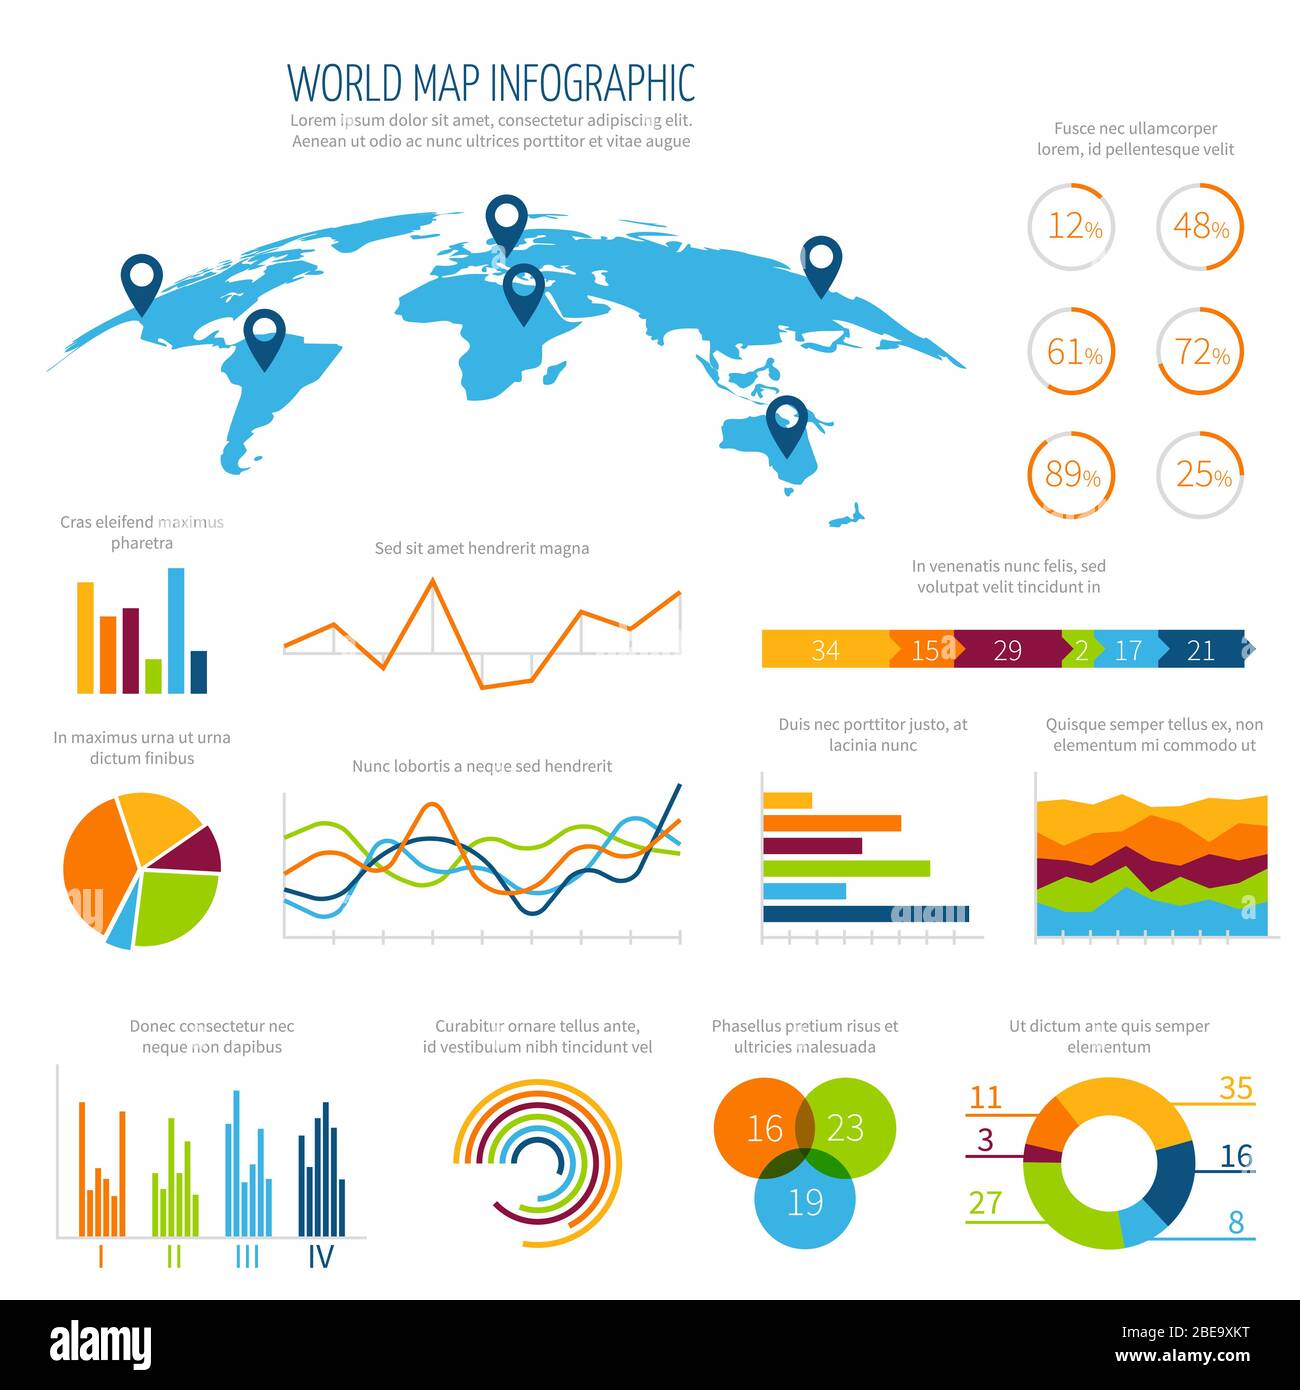 Modern infographic vector template with 3d world map and charts. Business world graphic and chart for presentation illustration Stock Vectorhttps://www.alamy.com/image-license-details/?v=1https://www.alamy.com/modern-infographic-vector-template-with-3d-world-map-and-charts-business-world-graphic-and-chart-for-presentation-illustration-image353031052.html
RF2BE9XKT–Modern infographic vector template with 3d world map and charts. Business world graphic and chart for presentation illustration
 Information technologies concept infographic charts set. Business area and pie charts for presentation slide templates. Can be used for financial repo Stock Vectorhttps://www.alamy.com/image-license-details/?v=1https://www.alamy.com/information-technologies-concept-infographic-charts-set-business-area-and-pie-charts-for-presentation-slide-templates-can-be-used-for-financial-repo-image467364812.html
RF2J4A8GC–Information technologies concept infographic charts set. Business area and pie charts for presentation slide templates. Can be used for financial repo
 Website analysis. SEO reports analytics. Pie charts, diagrams, computer monitor screen. Business and financial analyst annual presentation. Vector iso Stock Vectorhttps://www.alamy.com/image-license-details/?v=1https://www.alamy.com/website-analysis-seo-reports-analytics-pie-charts-diagrams-computer-monitor-screen-business-and-financial-analyst-annual-presentation-vector-iso-image466990545.html
RF2J3N75N–Website analysis. SEO reports analytics. Pie charts, diagrams, computer monitor screen. Business and financial analyst annual presentation. Vector iso
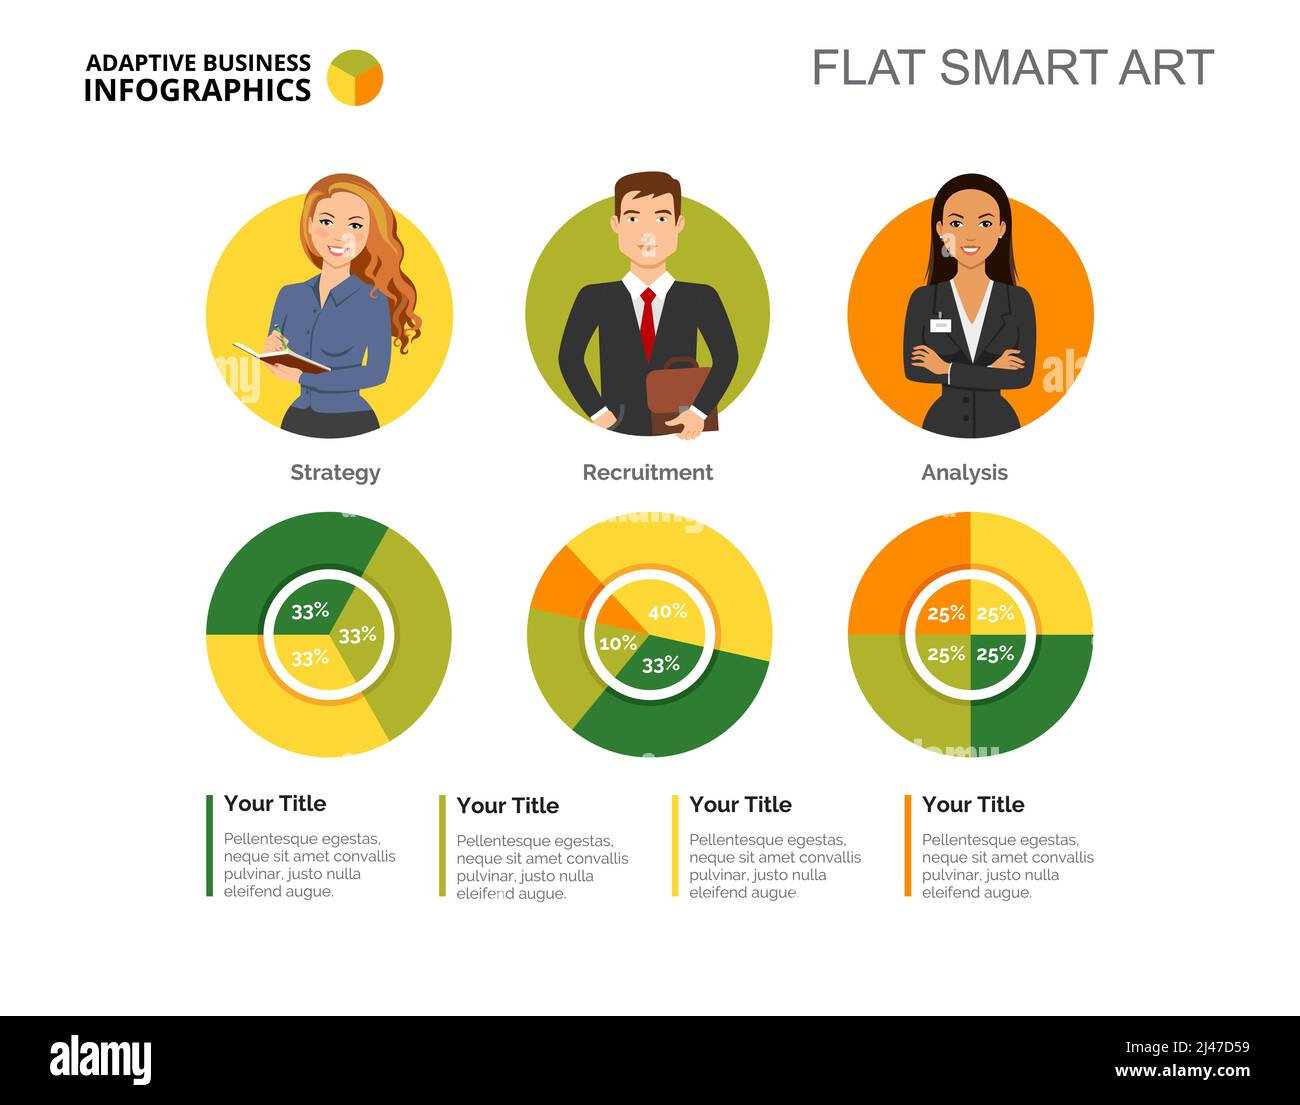 Three businesspeople and pie charts. Business data. Percent, diagram, design. Creative concept for infographic, templates, presentation. Can be used f Stock Vectorhttps://www.alamy.com/image-license-details/?v=1https://www.alamy.com/three-businesspeople-and-pie-charts-business-data-percent-diagram-design-creative-concept-for-infographic-templates-presentation-can-be-used-f-image467302565.html
RF2J47D59–Three businesspeople and pie charts. Business data. Percent, diagram, design. Creative concept for infographic, templates, presentation. Can be used f
 Website analysis. SEO reports analytics. Pie charts, diagrams, computer monitor screen. Business and financial analyst annual presentation. Vector iso Stock Vectorhttps://www.alamy.com/image-license-details/?v=1https://www.alamy.com/website-analysis-seo-reports-analytics-pie-charts-diagrams-computer-monitor-screen-business-and-financial-analyst-annual-presentation-vector-iso-image467069377.html
RF2J3TRN5–Website analysis. SEO reports analytics. Pie charts, diagrams, computer monitor screen. Business and financial analyst annual presentation. Vector iso
 Colorful statistics or marketing infographic charts set. Business bar, pie and line charts for presentation slide templates. For corporate report, adv Stock Vectorhttps://www.alamy.com/image-license-details/?v=1https://www.alamy.com/colorful-statistics-or-marketing-infographic-charts-set-business-bar-pie-and-line-charts-for-presentation-slide-templates-for-corporate-report-adv-image467364695.html
RF2J4A8C7–Colorful statistics or marketing infographic charts set. Business bar, pie and line charts for presentation slide templates. For corporate report, adv
RFKNF1WY–Chart icon bar symbol for web site design, logo, app, UI. Vector illustration.
 Customer managers working with customers pie charts and devices. Customer segmentation, internet marketing tool, target audience collection concept. P Stock Vectorhttps://www.alamy.com/image-license-details/?v=1https://www.alamy.com/customer-managers-working-with-customers-pie-charts-and-devices-customer-segmentation-internet-marketing-tool-target-audience-collection-concept-p-image467054866.html
RF2J3T56X–Customer managers working with customers pie charts and devices. Customer segmentation, internet marketing tool, target audience collection concept. P
RFME1K11–Pie chart information on money company logo design template, Business corporate vector icon
RFGDCP4R–Human body health care infographics, with medical icons, organs, charts, diagarms and copy space
 Illustration of business people making a presentation with the use of a white board showing pie-charts and graphs.business woman and man in the office Stock Vectorhttps://www.alamy.com/image-license-details/?v=1https://www.alamy.com/stock-photo-illustration-of-business-people-making-a-presentation-with-the-use-95038567.html
RFFEHAJF–Illustration of business people making a presentation with the use of a white board showing pie-charts and graphs.business woman and man in the office
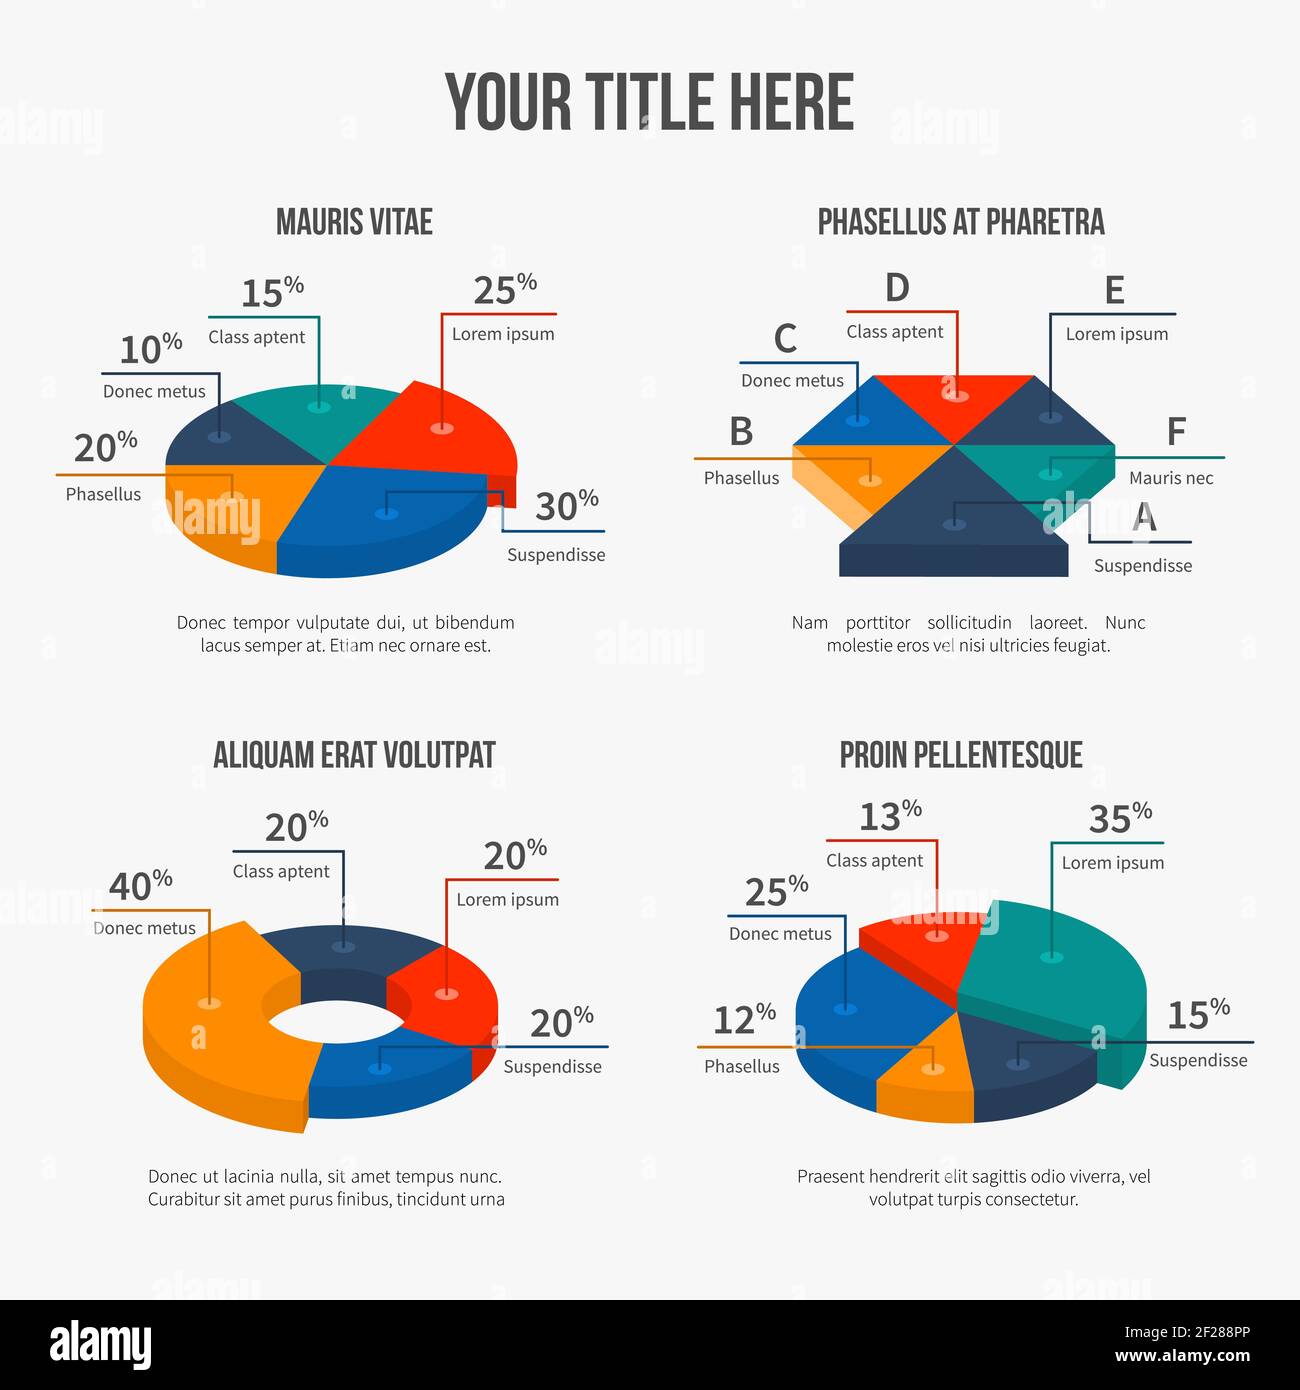 Vector pie charts in modern 3d flat style. Infographic presentation, finance graphic, interest figures Stock Vectorhttps://www.alamy.com/image-license-details/?v=1https://www.alamy.com/vector-pie-charts-in-modern-3d-flat-style-infographic-presentation-finance-graphic-interest-figures-image414460670.html
RF2F288PP–Vector pie charts in modern 3d flat style. Infographic presentation, finance graphic, interest figures
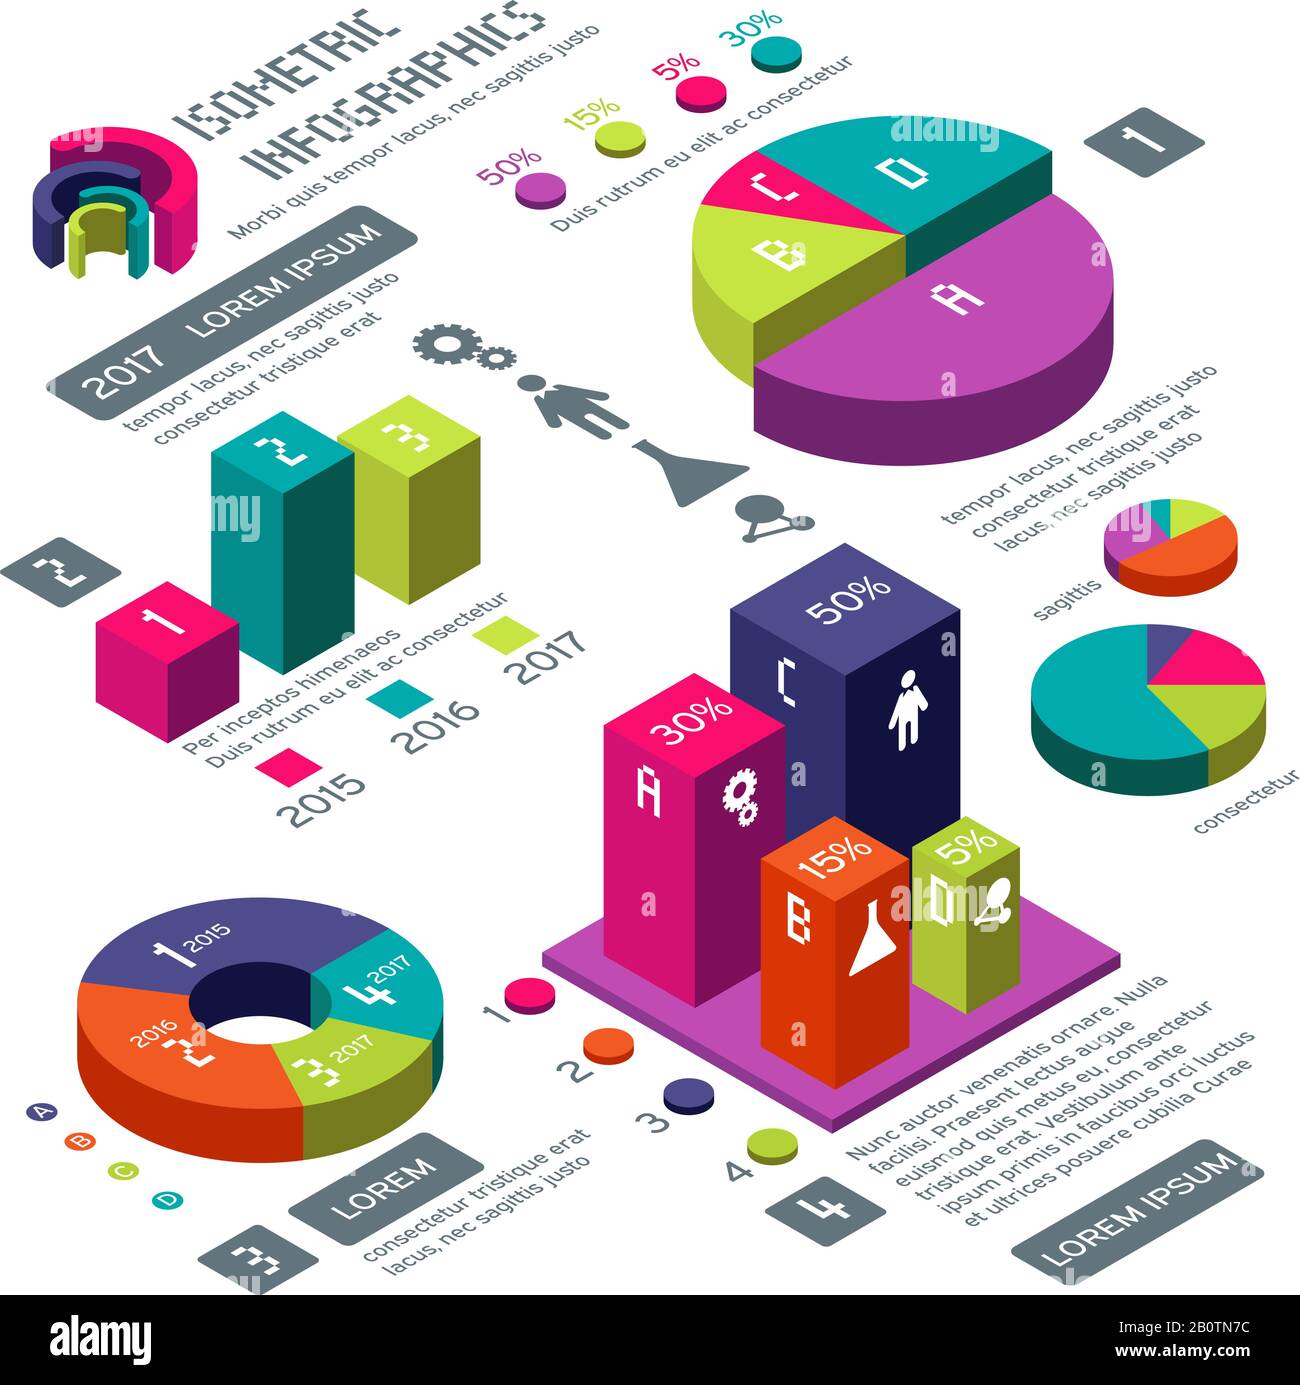 Isometric 3d business vector infographic with color diagrams and charts. Isometric colored infographic and diagram for information web illustration Stock Vectorhttps://www.alamy.com/image-license-details/?v=1https://www.alamy.com/isometric-3d-business-vector-infographic-with-color-diagrams-and-charts-isometric-colored-infographic-and-diagram-for-information-web-illustration-image344750880.html
RF2B0TN7C–Isometric 3d business vector infographic with color diagrams and charts. Isometric colored infographic and diagram for information web illustration
RFTDMKJP–Set pie chart icons. Circle diagram vector. Collection Charts graphs logo template. Flat design.
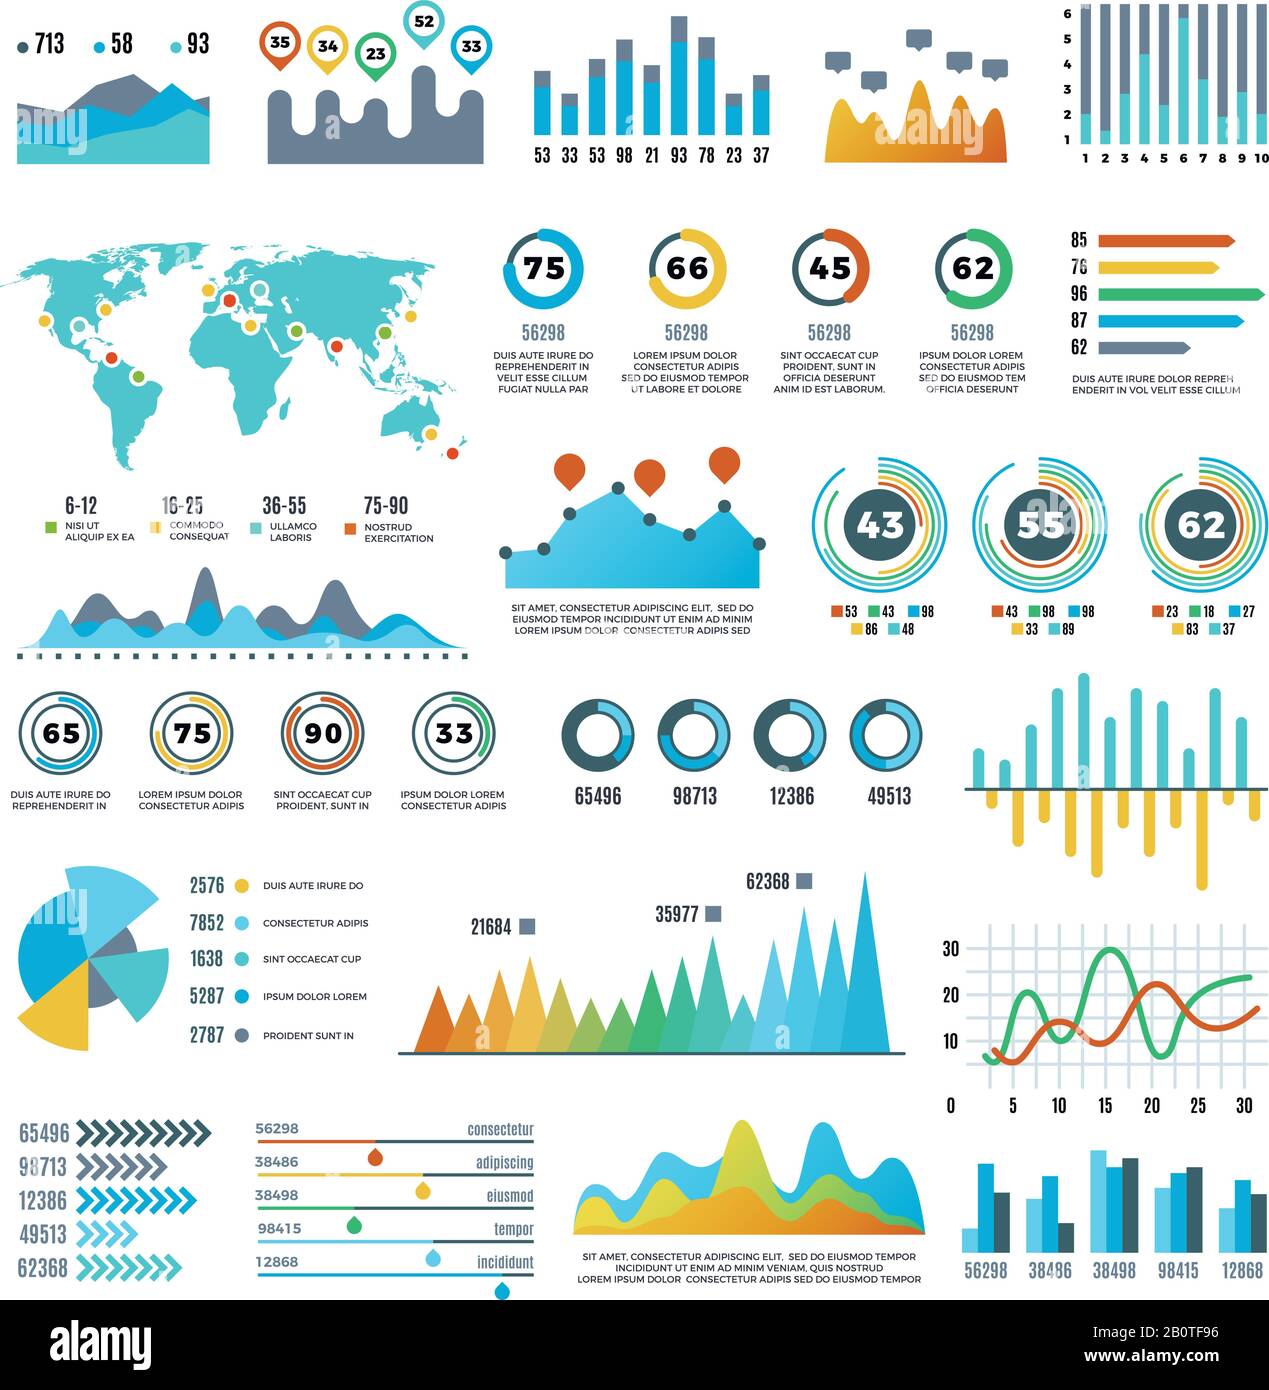 Business demographics and statistics infographic elements with colourful charts, diagrams and graph vector set. Illustration of colored chart and graph report Stock Vectorhttps://www.alamy.com/image-license-details/?v=1https://www.alamy.com/business-demographics-and-statistics-infographic-elements-with-colourful-charts-diagrams-and-graph-vector-set-illustration-of-colored-chart-and-graph-report-image344746226.html
RF2B0TF96–Business demographics and statistics infographic elements with colourful charts, diagrams and graph vector set. Illustration of colored chart and graph report
 Isometric illustrations of bar and pie chart analysis materials Stock Vectorhttps://www.alamy.com/image-license-details/?v=1https://www.alamy.com/isometric-illustrations-of-bar-and-pie-chart-analysis-materials-image478045551.html
RF2JNMRYB–Isometric illustrations of bar and pie chart analysis materials
RF2BGA38A–Statistics business graphs and charts outline vector icons. Financial diagrams line pictograms. Diagram and chart, business graph finance illustration
RF2EHHXAK–Euro pie chart icon. Beautiful design and fully editable vector for commercial use, printed files and presentations, Promotional Materials, web or any