Quick filters:
Pie diagrams Stock Photos and Images
 3D vector charts. Bar and pie diagrams. Set of different colors. Stock Vectorhttps://www.alamy.com/image-license-details/?v=1https://www.alamy.com/3d-vector-charts-bar-and-pie-diagrams-set-of-different-colors-image64742154.html
RFDN977P–3D vector charts. Bar and pie diagrams. Set of different colors.
 Multiple exposure of glowing circle and pie diagrams with dna pattern, copy space Stock Photohttps://www.alamy.com/image-license-details/?v=1https://www.alamy.com/multiple-exposure-of-glowing-circle-and-pie-diagrams-with-dna-pattern-copy-space-image479271551.html
RF2JRMKN3–Multiple exposure of glowing circle and pie diagrams with dna pattern, copy space
RF2GPM4MF–Four circle pie diagrams icon, outline style
RF2BGK20D–Circle graphic, pie diagrams, round charts with icons, options, parts, steps, process sectors vector set. Circular step and pie round order sector connected illustration
 Business coach speaking in front of audience, Using Pie Diagrams and Column Charts, doing presentation and professional training about marketing, sale Stock Vectorhttps://www.alamy.com/image-license-details/?v=1https://www.alamy.com/business-coach-speaking-in-front-of-audience-using-pie-diagrams-and-column-charts-doing-presentation-and-professional-training-about-marketing-sale-image560439720.html
RF2RFP6G8–Business coach speaking in front of audience, Using Pie Diagrams and Column Charts, doing presentation and professional training about marketing, sale
 Set of different color circles pie charts diagrams. Various sectors divide the circle into equal parts. Stock Vectorhttps://www.alamy.com/image-license-details/?v=1https://www.alamy.com/set-of-different-color-circles-pie-charts-diagrams-various-sectors-divide-the-circle-into-equal-parts-image596450097.html
RF2WJAJ55–Set of different color circles pie charts diagrams. Various sectors divide the circle into equal parts.
 Trader sitting and working at laptop. Bar charts, pie diagrams in background flat vector illustration. Workplace, stock market, communication concept Stock Vectorhttps://www.alamy.com/image-license-details/?v=1https://www.alamy.com/trader-sitting-and-working-at-laptop-bar-charts-pie-diagrams-in-background-flat-vector-illustration-workplace-stock-market-communication-concept-image466212245.html
RF2J2DPD9–Trader sitting and working at laptop. Bar charts, pie diagrams in background flat vector illustration. Workplace, stock market, communication concept
 top view of finance inscription near multicolor pie diagrams on white background Stock Photohttps://www.alamy.com/image-license-details/?v=1https://www.alamy.com/top-view-of-finance-inscription-near-multicolor-pie-diagrams-on-white-background-image337101421.html
RF2AGC88D–top view of finance inscription near multicolor pie diagrams on white background
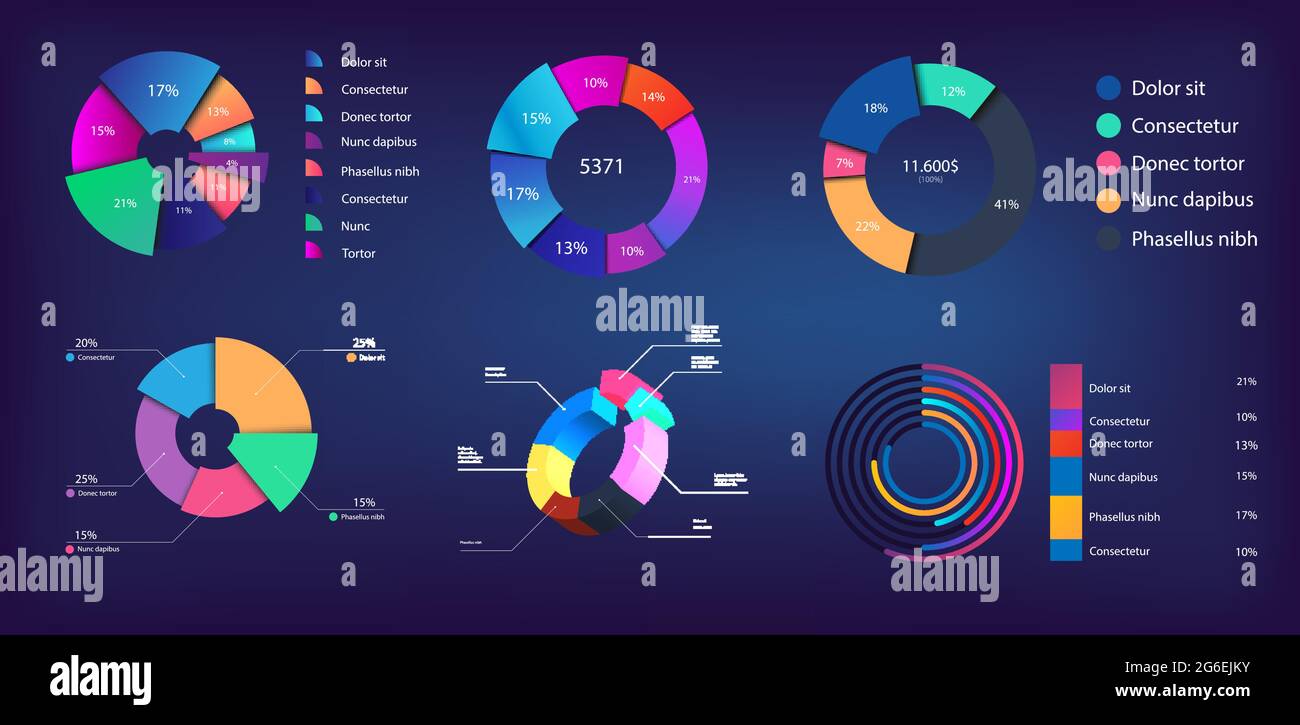 Neon gradient pie chart, infographic collection for reports and presentations, UI, WEB. Mockups circle infochart and Pie charts. 3D, and flat Stock Vectorhttps://www.alamy.com/image-license-details/?v=1https://www.alamy.com/neon-gradient-pie-chart-infographic-collection-for-reports-and-presentations-ui-web-mockups-circle-infochart-and-pie-charts-3d-and-flat-image434269135.html
RF2G6EJKY–Neon gradient pie chart, infographic collection for reports and presentations, UI, WEB. Mockups circle infochart and Pie charts. 3D, and flat
RFT1XMEG–Set of 15 line icons of charts and graphs representing data and information in various shapes
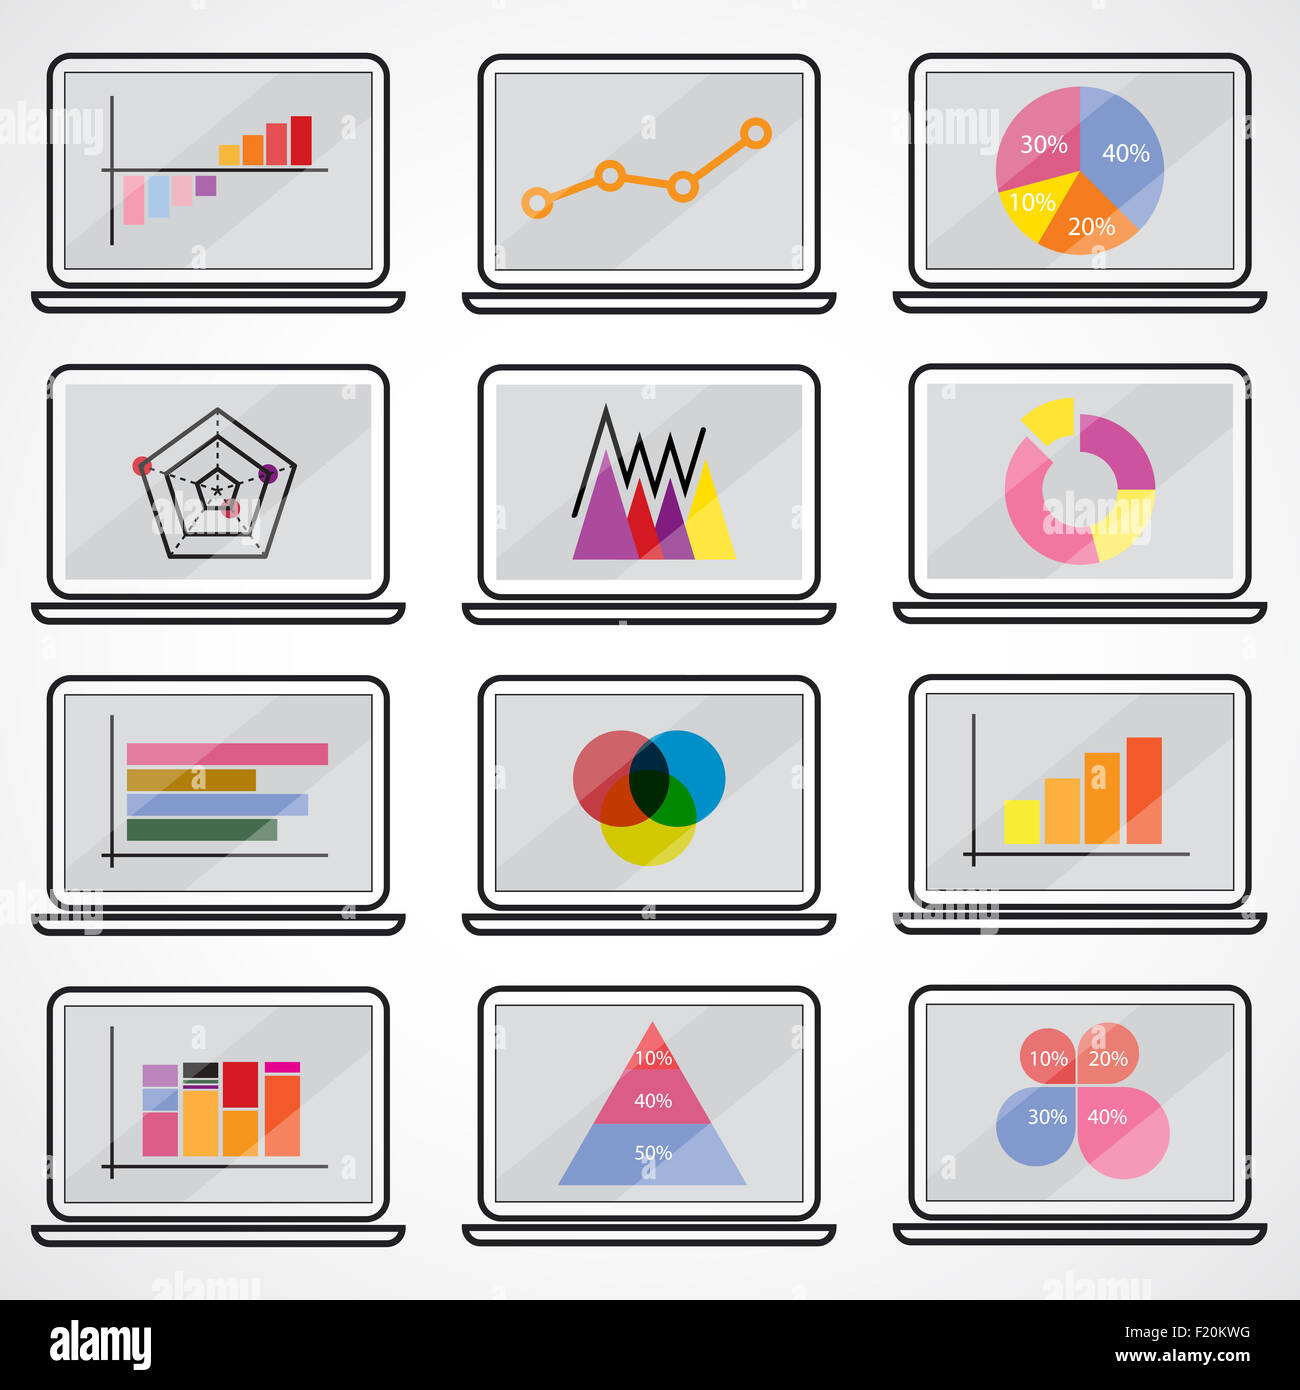 Business data market elements dot bar pie charts diagrams.Graphs flat icons set on notebook. Stock Photohttps://www.alamy.com/image-license-details/?v=1https://www.alamy.com/stock-photo-business-data-market-elements-dot-bar-pie-charts-diagramsgraphs-flat-87296764.html
RFF20KWG–Business data market elements dot bar pie charts diagrams.Graphs flat icons set on notebook.
 Set of pie chart diagrams. Circles cut on 4, 6, 8, 10 and 14 slices. Shades of green and blue gradient on white background, simple flat design vector Stock Vectorhttps://www.alamy.com/image-license-details/?v=1https://www.alamy.com/set-of-pie-chart-diagrams-circles-cut-on-4-6-8-10-and-14-slices-shades-of-green-and-blue-gradient-on-white-background-simple-flat-design-vector-image471990896.html
RF2JBW15M–Set of pie chart diagrams. Circles cut on 4, 6, 8, 10 and 14 slices. Shades of green and blue gradient on white background, simple flat design vector
RF2JA88TA–Business graph 3D icon. Business data market elements dot bar pie charts diagrams and graphs. 3D Rendered Illustration.
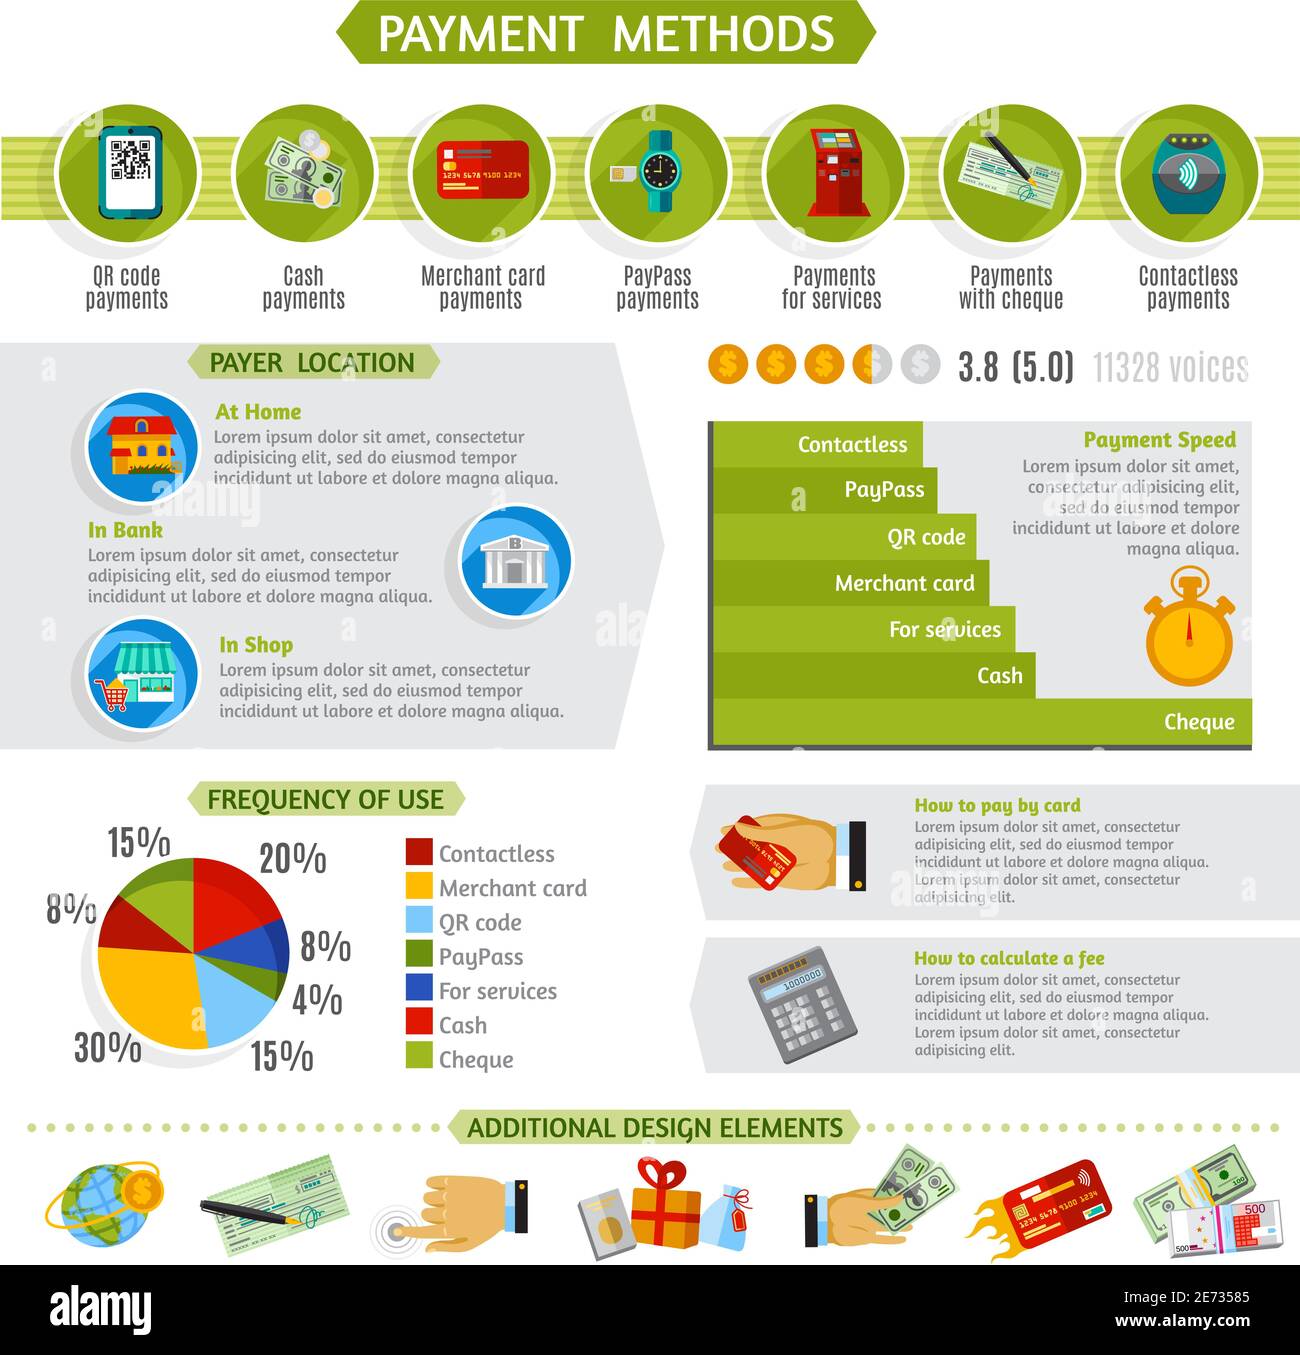 Payments methods infographic presentation layout with percentage pie diagrams timeline and additional design elements abstract vector illustration Stock Vectorhttps://www.alamy.com/image-license-details/?v=1https://www.alamy.com/payments-methods-infographic-presentation-layout-with-percentage-pie-diagrams-timeline-and-additional-design-elements-abstract-vector-illustration-image400211061.html
RF2E73585–Payments methods infographic presentation layout with percentage pie diagrams timeline and additional design elements abstract vector illustration
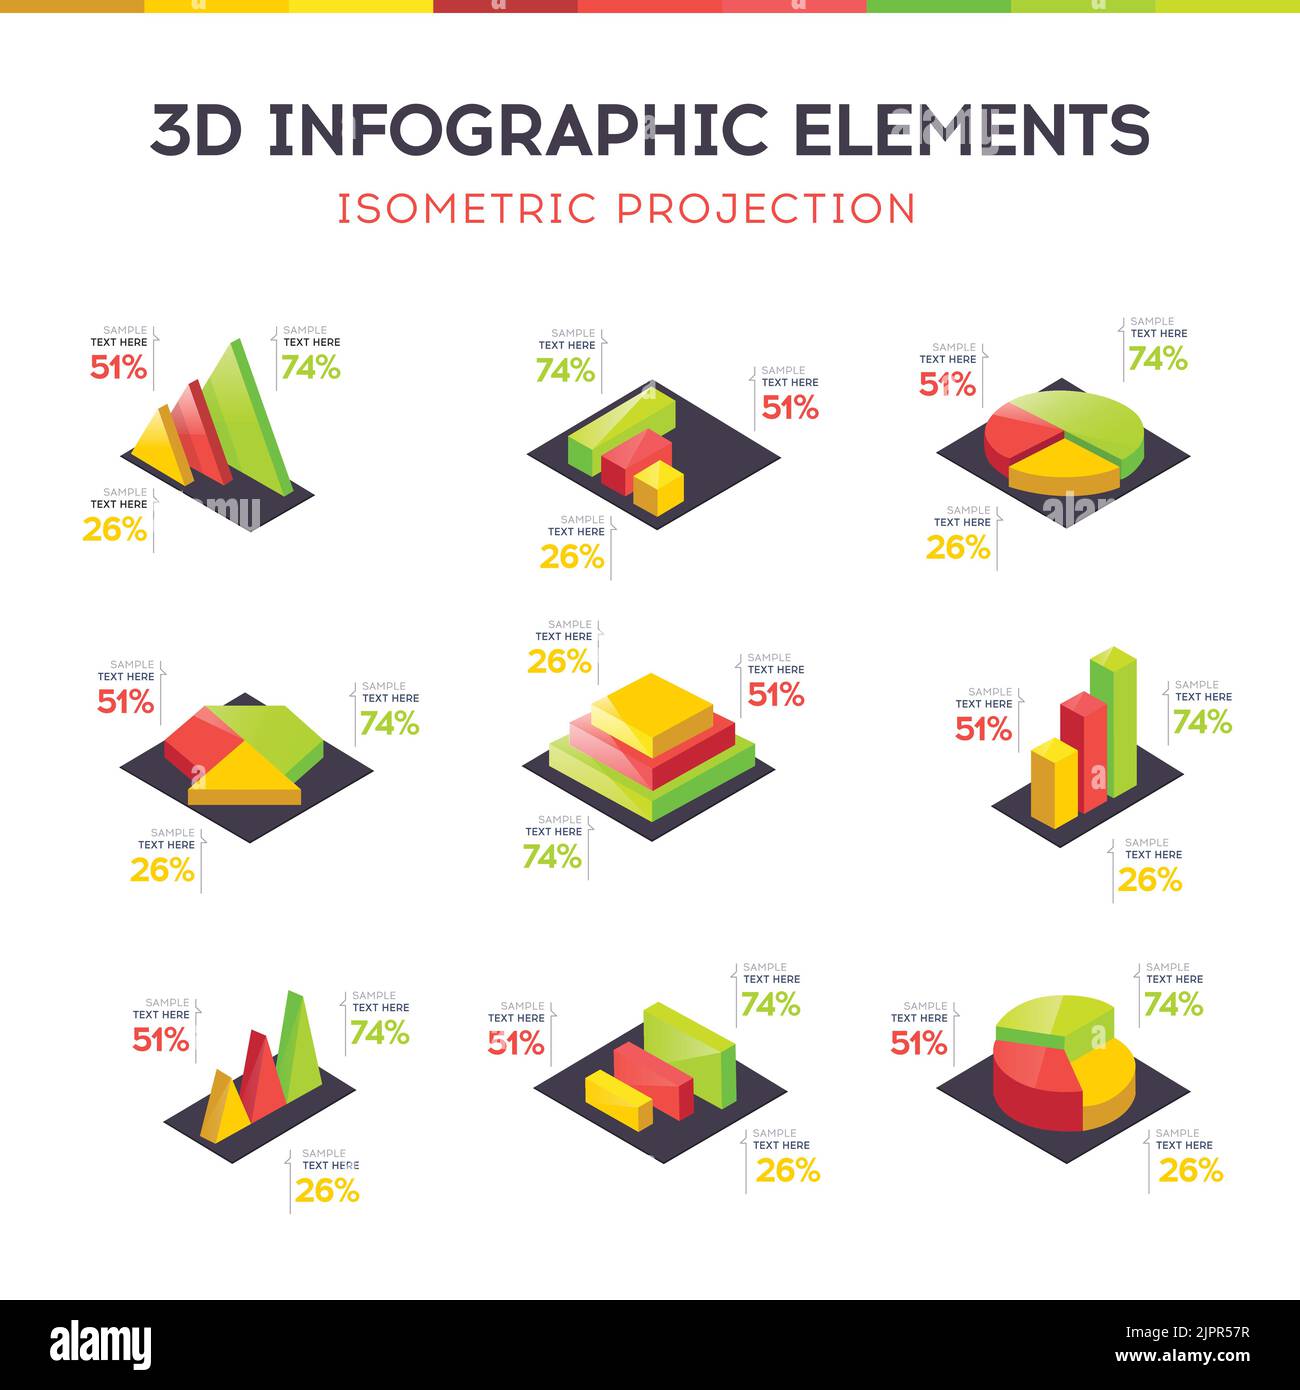 Isometric 3D vector graphs and charts. Isometric infographic elements with graphs, pie charts and pyramid diagrams. Infographic vector presentation Stock Vectorhttps://www.alamy.com/image-license-details/?v=1https://www.alamy.com/isometric-3d-vector-graphs-and-charts-isometric-infographic-elements-with-graphs-pie-charts-and-pyramid-diagrams-infographic-vector-presentation-image478711403.html
RF2JPR57R–Isometric 3D vector graphs and charts. Isometric infographic elements with graphs, pie charts and pyramid diagrams. Infographic vector presentation
 Set of Donut charts. 3D circular diagrams for infographics concept and business templates. Vector illustration Stock Vectorhttps://www.alamy.com/image-license-details/?v=1https://www.alamy.com/set-of-donut-charts-3d-circular-diagrams-for-infographics-concept-and-business-templates-vector-illustration-image540209614.html
RF2PATJTE–Set of Donut charts. 3D circular diagrams for infographics concept and business templates. Vector illustration
 Infographic Elements. business diagrams and graphics Stock Photohttps://www.alamy.com/image-license-details/?v=1https://www.alamy.com/infographic-elements-business-diagrams-and-graphics-image244829624.html
RMT68XK4–Infographic Elements. business diagrams and graphics
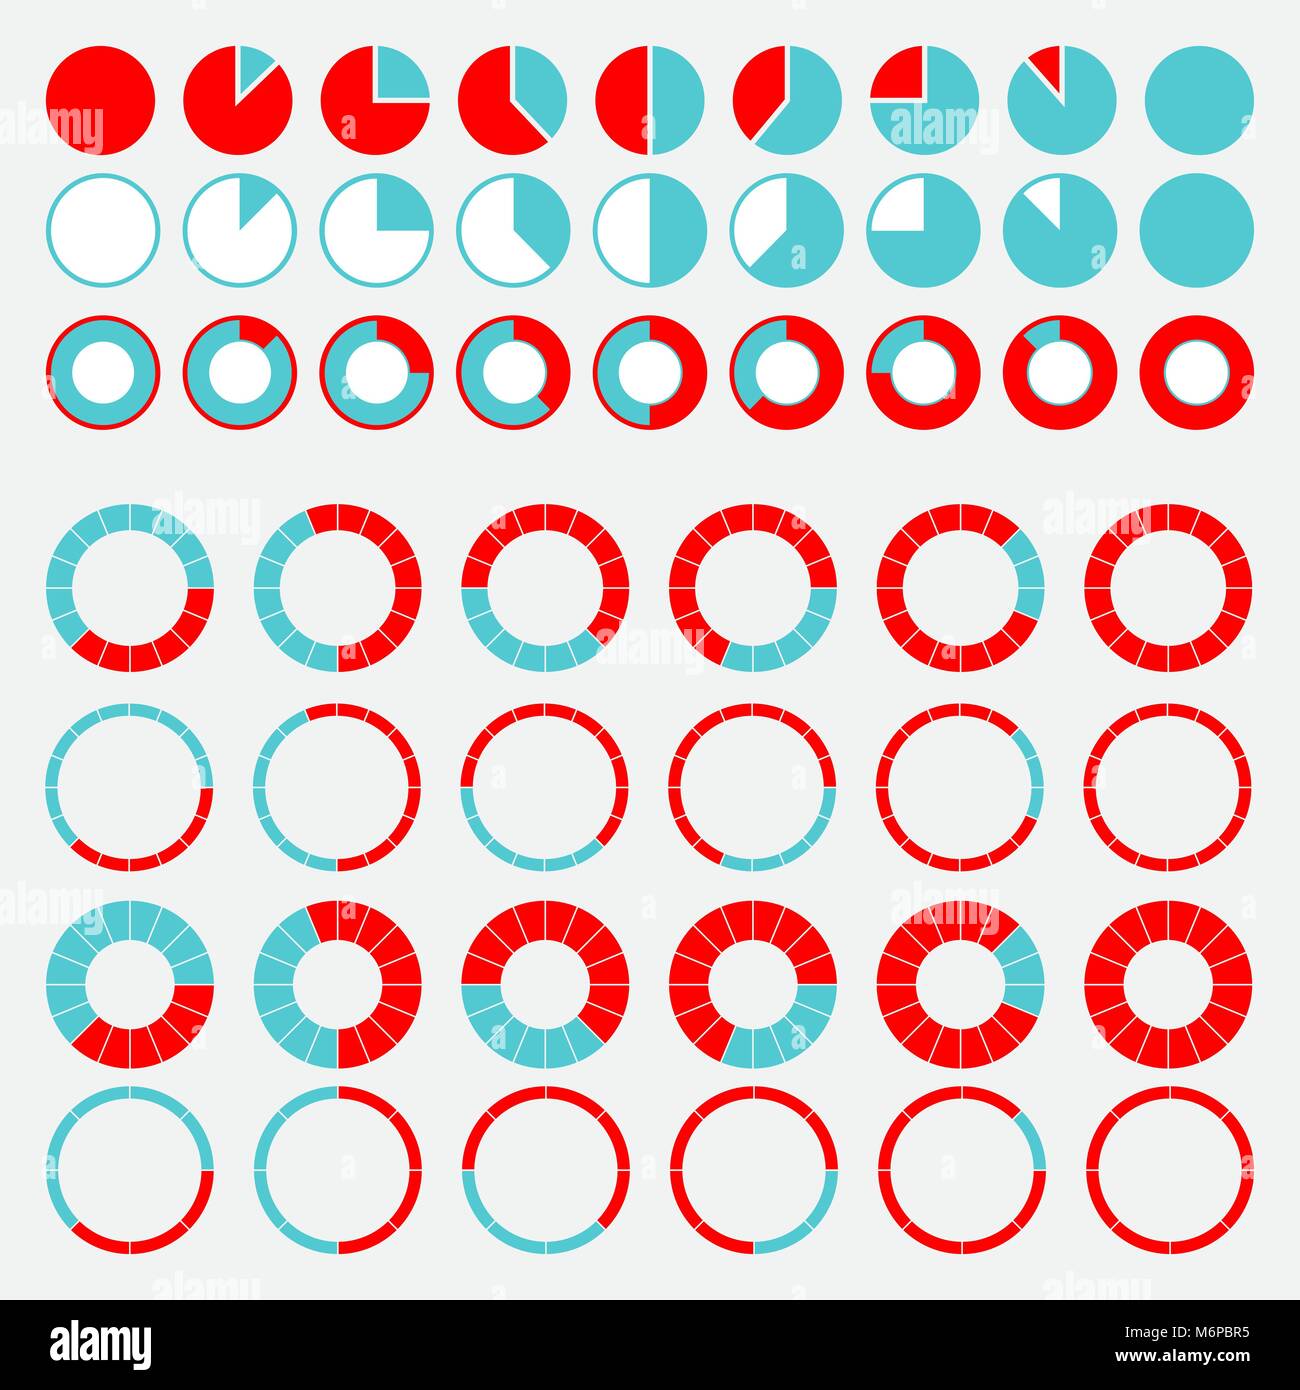 Set of brightly colored pie charts Stock Vectorhttps://www.alamy.com/image-license-details/?v=1https://www.alamy.com/stock-photo-set-of-brightly-colored-pie-charts-176283833.html
RFM6PBR5–Set of brightly colored pie charts
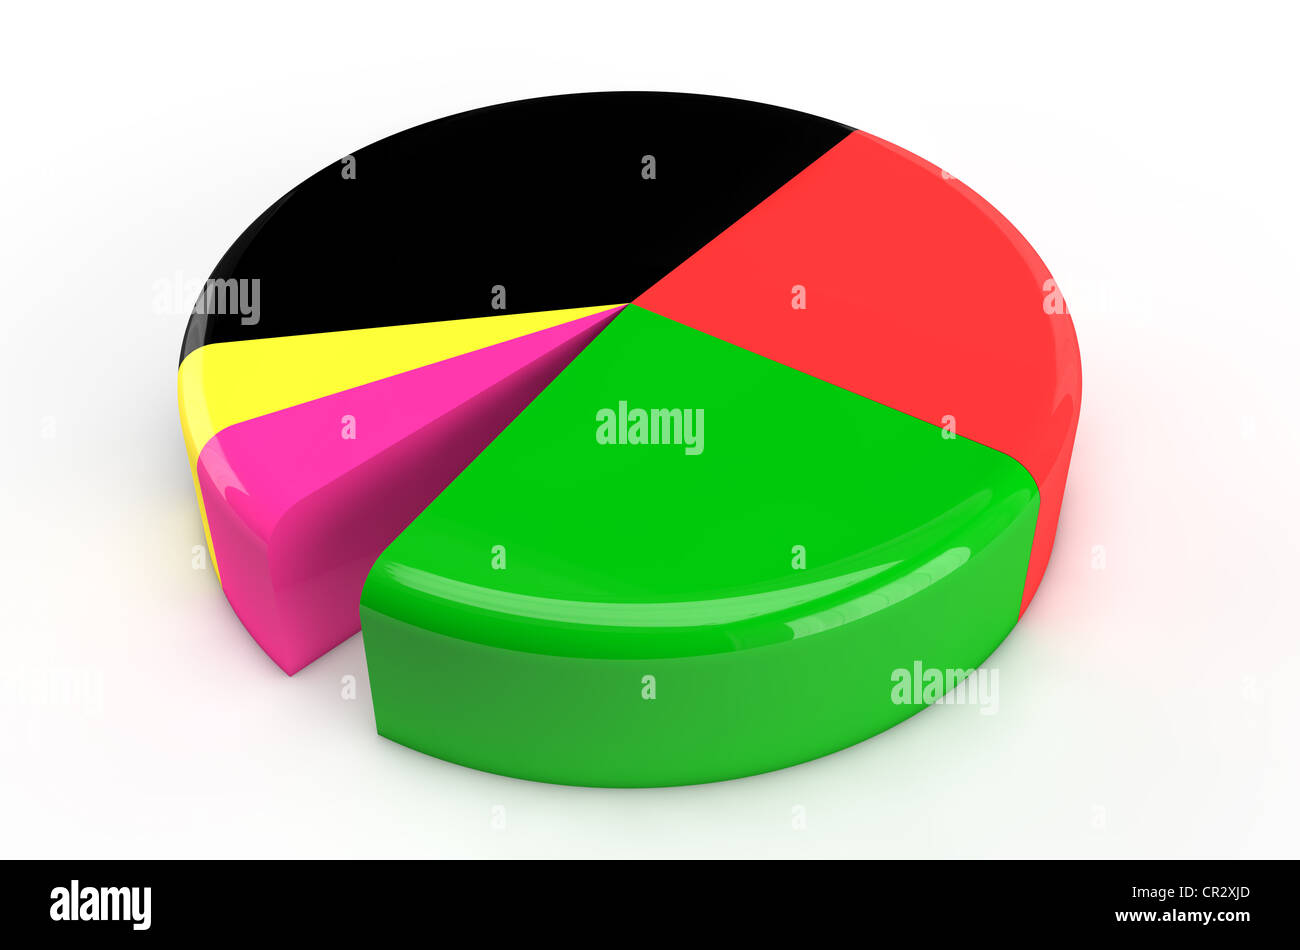 Pie chart, parties and coalition, symbolic image for voting results, 3D illustration Stock Photohttps://www.alamy.com/image-license-details/?v=1https://www.alamy.com/stock-photo-pie-chart-parties-and-coalition-symbolic-image-for-voting-results-48622629.html
RMCR2XJD–Pie chart, parties and coalition, symbolic image for voting results, 3D illustration
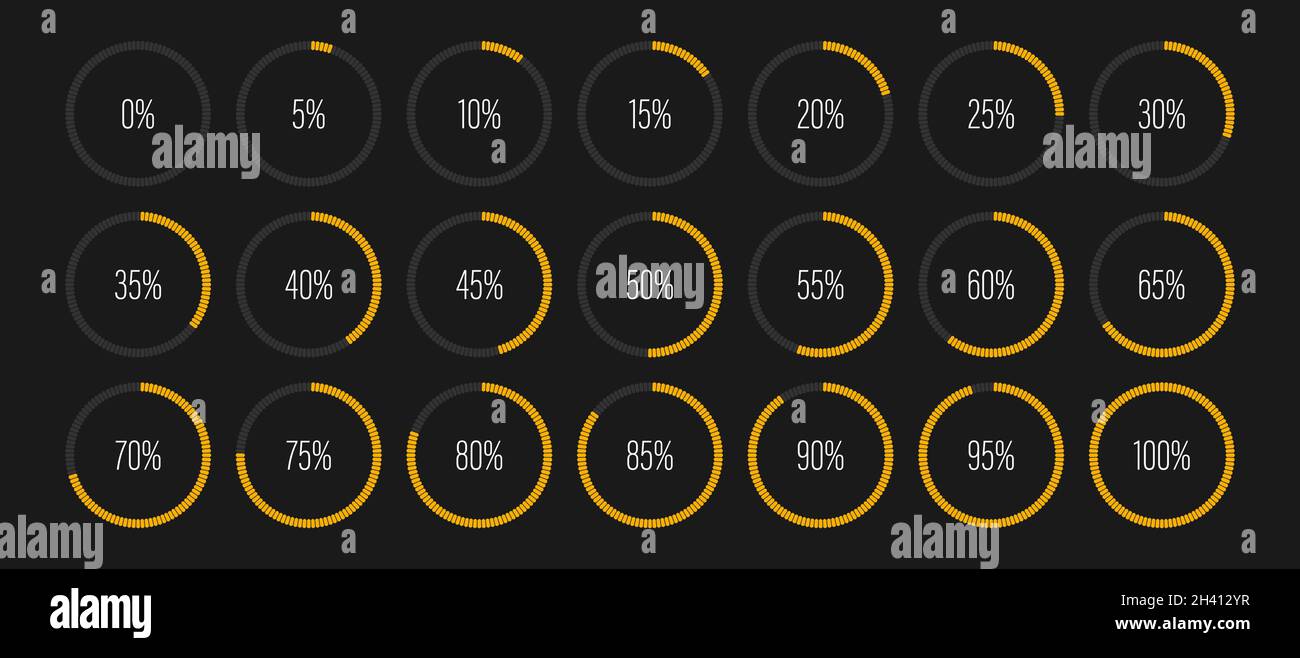 Set of circle percentage diagrams meters for web design, user interface UI or infographic - indicator with yellow Stock Vectorhttps://www.alamy.com/image-license-details/?v=1https://www.alamy.com/set-of-circle-percentage-diagrams-meters-for-web-design-user-interface-ui-or-infographic-indicator-with-yellow-image449952491.html
RF2H412YR–Set of circle percentage diagrams meters for web design, user interface UI or infographic - indicator with yellow
 Vector image of digital circular patterns with pie diagrams and graphs, copy space Stock Photohttps://www.alamy.com/image-license-details/?v=1https://www.alamy.com/vector-image-of-digital-circular-patterns-with-pie-diagrams-and-graphs-copy-space-image479271506.html
RF2JRMKKE–Vector image of digital circular patterns with pie diagrams and graphs, copy space
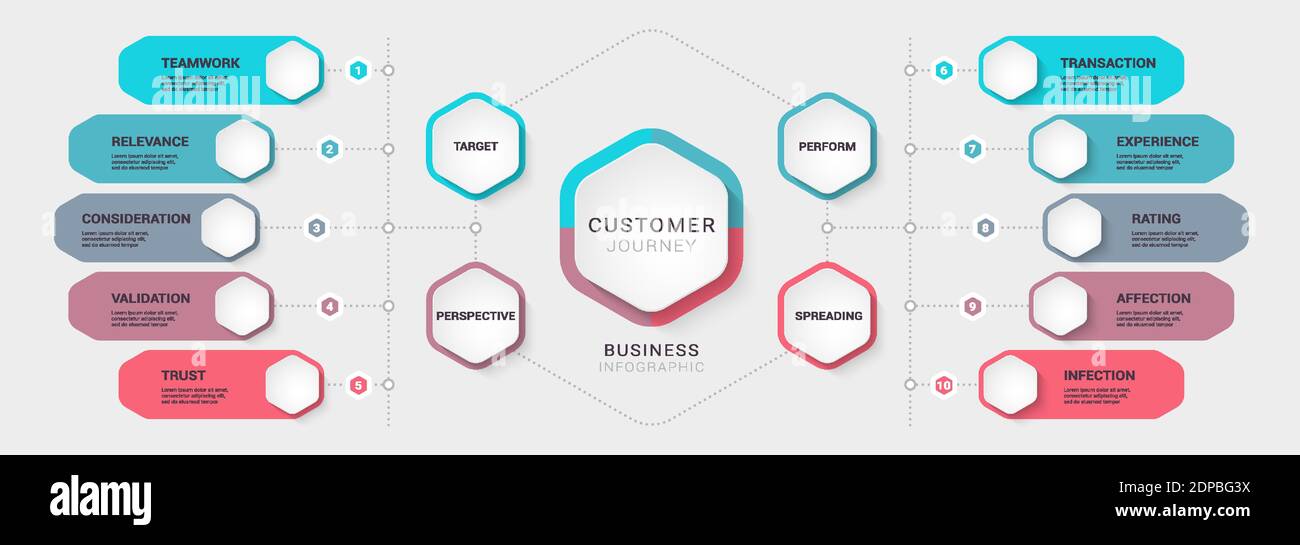 Business customer journey diagrams. Modern 3D Infographic Template. Business Process Chart with Options for Brochure, Diagram, Workflow, Timeline, Num Stock Vectorhttps://www.alamy.com/image-license-details/?v=1https://www.alamy.com/business-customer-journey-diagrams-modern-3d-infographic-template-business-process-chart-with-options-for-brochure-diagram-workflow-timeline-num-image392404654.html
RF2DPBG3X–Business customer journey diagrams. Modern 3D Infographic Template. Business Process Chart with Options for Brochure, Diagram, Workflow, Timeline, Num
RF2BG7GM4–Circle graphic, pie diagrams, round charts with icons, options, parts, steps, process sectors vector set. Circular step and pie round order sector con
 Prospective Experienced Office Supervisor, Responsible for Support of Trainees, Giving Presentation Within Business Seminar, Using Pie Diagrams and Co Stock Vectorhttps://www.alamy.com/image-license-details/?v=1https://www.alamy.com/prospective-experienced-office-supervisor-responsible-for-support-of-trainees-giving-presentation-within-business-seminar-using-pie-diagrams-and-co-image600154691.html
RF2WTBBC3–Prospective Experienced Office Supervisor, Responsible for Support of Trainees, Giving Presentation Within Business Seminar, Using Pie Diagrams and Co
 Set of different color circles pie charts diagrams. Various sectors divide the circle into equal parts. Stock Vectorhttps://www.alamy.com/image-license-details/?v=1https://www.alamy.com/set-of-different-color-circles-pie-charts-diagrams-various-sectors-divide-the-circle-into-equal-parts-image596450958.html
RF2WJAK7X–Set of different color circles pie charts diagrams. Various sectors divide the circle into equal parts.
 diagrams Stock Photohttps://www.alamy.com/image-license-details/?v=1https://www.alamy.com/stock-photo-diagrams-26719413.html
RMBFD4TN–diagrams
 Diagrams Stock Vectorhttps://www.alamy.com/image-license-details/?v=1https://www.alamy.com/diagrams-image64422273.html
RFDMPK7D–Diagrams
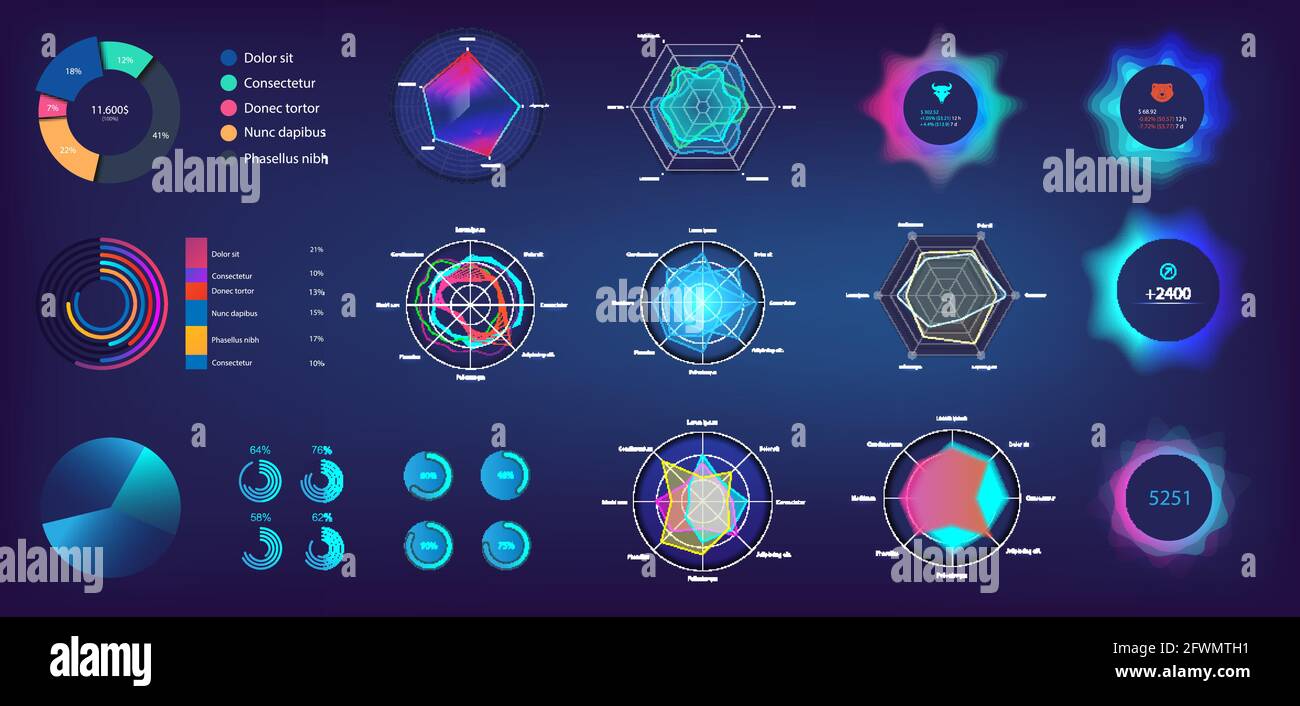 Circle infographic and Pie chart in futuristic style for Web, UI, UX, KIT and Mobile App. Infochart elements online statistics and data analytics Stock Vectorhttps://www.alamy.com/image-license-details/?v=1https://www.alamy.com/circle-infographic-and-pie-chart-in-futuristic-style-for-web-ui-ux-kit-and-mobile-app-infochart-elements-online-statistics-and-data-analytics-image428873565.html
RF2FWMTH1–Circle infographic and Pie chart in futuristic style for Web, UI, UX, KIT and Mobile App. Infochart elements online statistics and data analytics
 Set templates Infographics business conceptual cyclic processes for six positions text area, possible to use for pie chart Stock Vectorhttps://www.alamy.com/image-license-details/?v=1https://www.alamy.com/stock-photo-set-templates-infographics-business-conceptual-cyclic-processes-for-124449817.html
RFH6D509–Set templates Infographics business conceptual cyclic processes for six positions text area, possible to use for pie chart
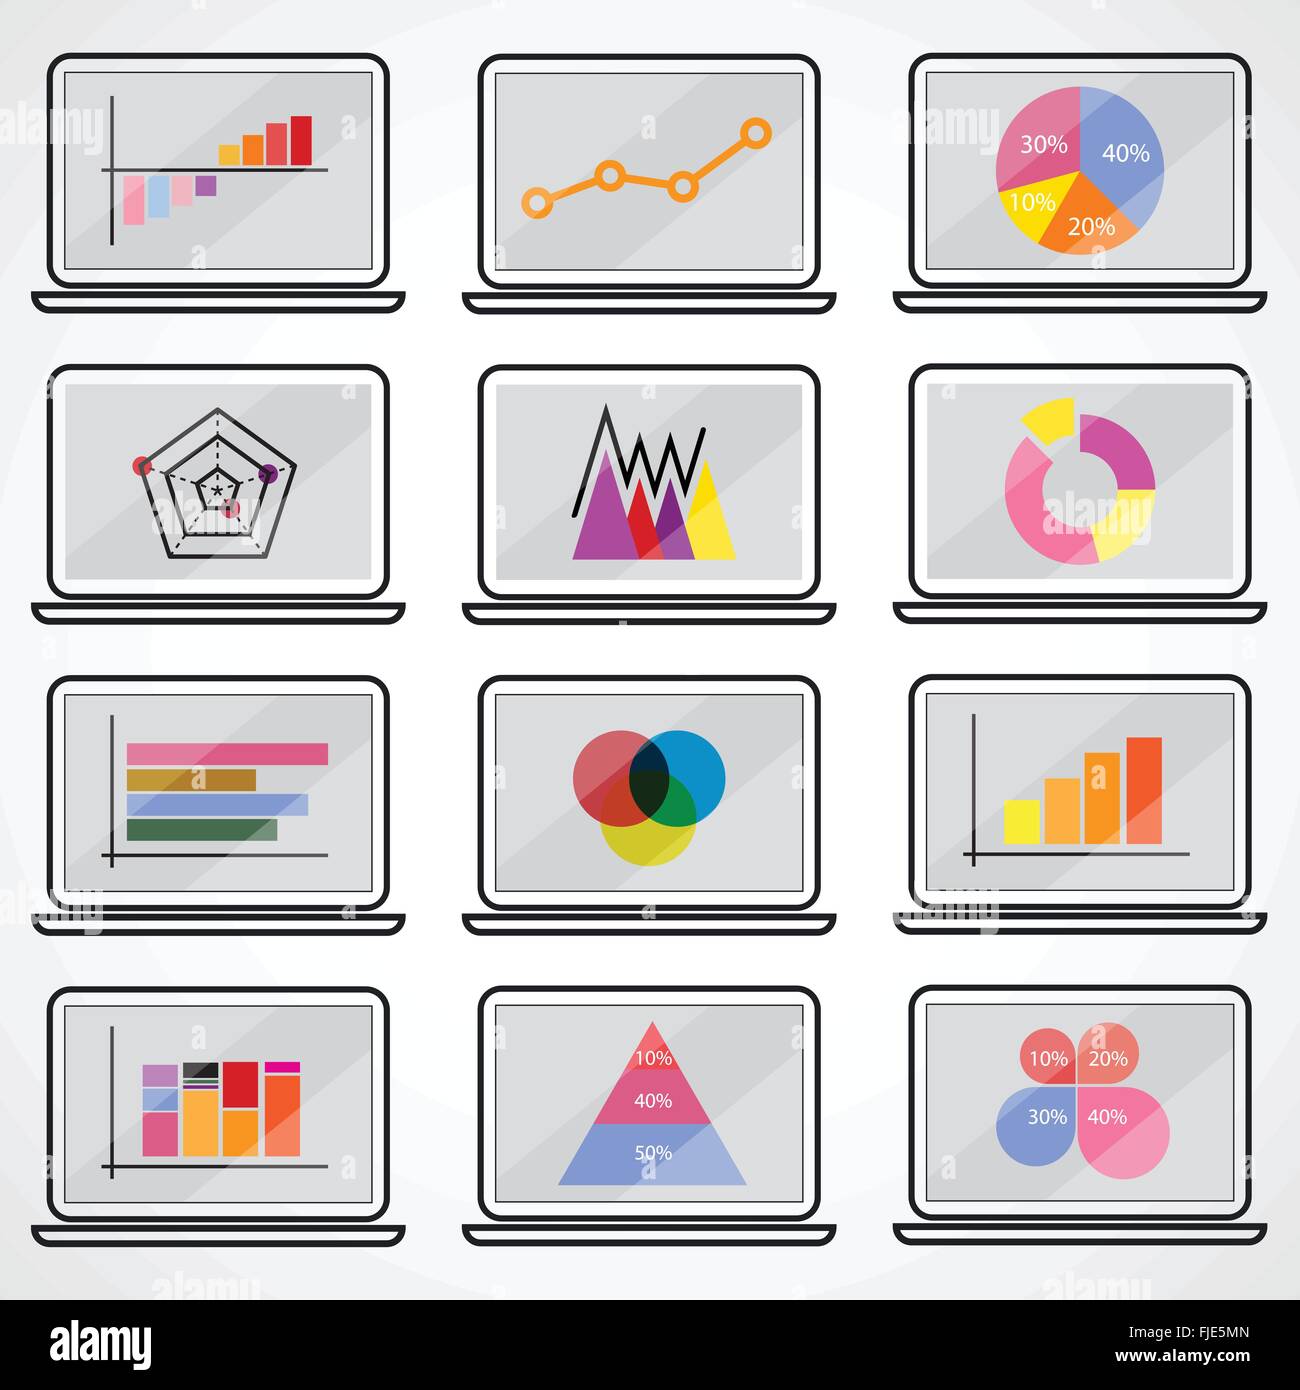 Business data market elements dot bar pie charts diagrams.Graphs flat icons set on notebook. Vector illustration. Stock Vectorhttps://www.alamy.com/image-license-details/?v=1https://www.alamy.com/stock-photo-business-data-market-elements-dot-bar-pie-charts-diagramsgraphs-flat-97427477.html
RFFJE5MN–Business data market elements dot bar pie charts diagrams.Graphs flat icons set on notebook. Vector illustration.
 Set of pie chart diagrams. Circles cut on 4, 6, 8, 10 and 14 slices with empty middle. Shades of green and blue gradient on white background, simple f Stock Vectorhttps://www.alamy.com/image-license-details/?v=1https://www.alamy.com/set-of-pie-chart-diagrams-circles-cut-on-4-6-8-10-and-14-slices-with-empty-middle-shades-of-green-and-blue-gradient-on-white-background-simple-f-image472102630.html
RF2JC23M6–Set of pie chart diagrams. Circles cut on 4, 6, 8, 10 and 14 slices with empty middle. Shades of green and blue gradient on white background, simple f
RF2JA88TH–Business graph with computer mug and tree 3D icon. Business data market elements dot bar pie charts diagrams and graphs.
 Business development analysis flat character flat vector illustration concept with radial plot. Team works with statistics and diagrams. Business analytics, financial activity, marketing consulting Stock Vectorhttps://www.alamy.com/image-license-details/?v=1https://www.alamy.com/business-development-analysis-flat-character-flat-vector-illustration-concept-with-radial-plot-team-works-with-statistics-and-diagrams-business-analytics-financial-activity-marketing-consulting-image368379857.html
RF2CB947D–Business development analysis flat character flat vector illustration concept with radial plot. Team works with statistics and diagrams. Business analytics, financial activity, marketing consulting
 Global Finance, World Map and Pie Charts Stock Photohttps://www.alamy.com/image-license-details/?v=1https://www.alamy.com/stock-photo-global-finance-world-map-and-pie-charts-176889191.html
RFM7NYY3–Global Finance, World Map and Pie Charts
 Colourful pie chart and bar graph business diagrams over white background, financial growth, statistics or investment graph concept, 3D illustration Stock Photohttps://www.alamy.com/image-license-details/?v=1https://www.alamy.com/colourful-pie-chart-and-bar-graph-business-diagrams-over-white-background-financial-growth-statistics-or-investment-graph-concept-3d-illustration-image606920972.html
RF2X7BHW0–Colourful pie chart and bar graph business diagrams over white background, financial growth, statistics or investment graph concept, 3D illustration
 Infographic Elements. business diagrams and graphics Stock Photohttps://www.alamy.com/image-license-details/?v=1https://www.alamy.com/infographic-elements-business-diagrams-and-graphics-image244829630.html
RMT68XKA–Infographic Elements. business diagrams and graphics
RF2REPH97–Set of icon for infographic. Big percent collection for user interface UI or business infographic. Percentage circle diagrams from 0 to 100. White and
 Outline donut charts or pies separated on 9 equal parts. Set of infographic wheels segmented in nine fractions. Round diagrams isolated on transparent background. Vector graphic illustration Stock Vectorhttps://www.alamy.com/image-license-details/?v=1https://www.alamy.com/outline-donut-charts-or-pies-separated-on-9-equal-parts-set-of-infographic-wheels-segmented-in-nine-fractions-round-diagrams-isolated-on-transparent-background-vector-graphic-illustration-image477034598.html
RF2JM2PDX–Outline donut charts or pies separated on 9 equal parts. Set of infographic wheels segmented in nine fractions. Round diagrams isolated on transparent background. Vector graphic illustration
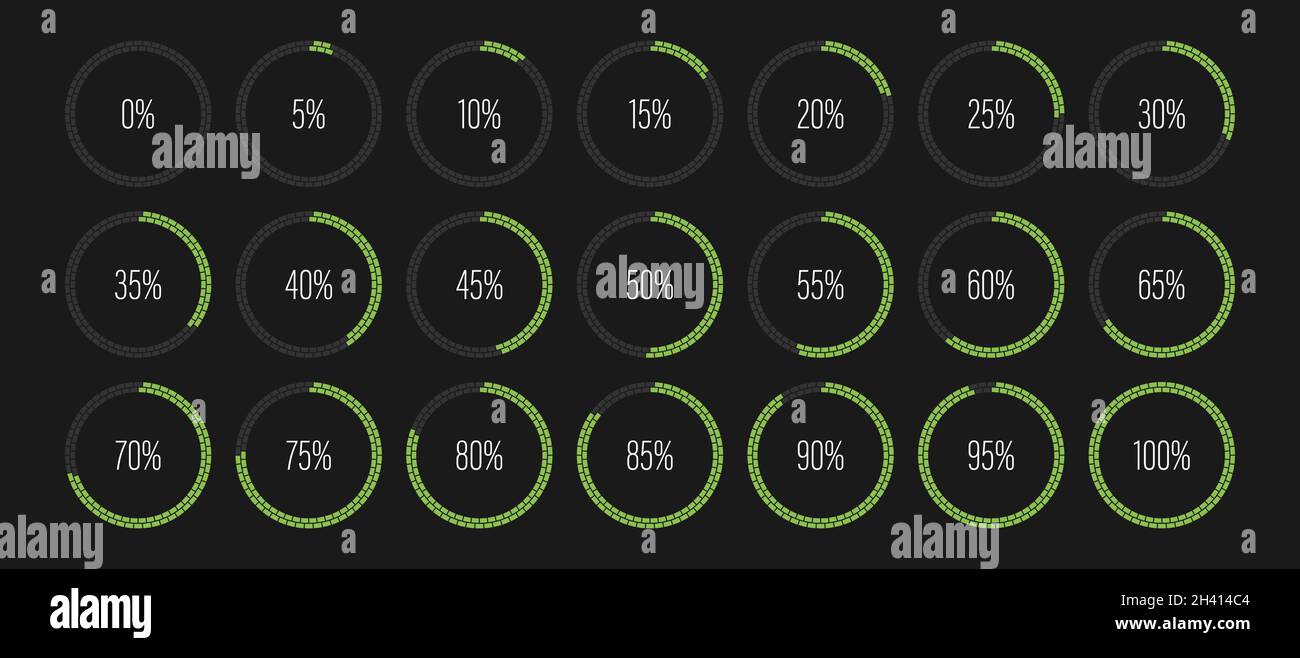 Set of circle percentage diagrams meters for web design, user interface UI or infographic - indicator with green Stock Vectorhttps://www.alamy.com/image-license-details/?v=1https://www.alamy.com/set-of-circle-percentage-diagrams-meters-for-web-design-user-interface-ui-or-infographic-indicator-with-green-image449953620.html
RF2H414C4–Set of circle percentage diagrams meters for web design, user interface UI or infographic - indicator with green
 Serious mature businessman studying diagrams Stock Photohttps://www.alamy.com/image-license-details/?v=1https://www.alamy.com/serious-mature-businessman-studying-diagrams-image62890906.html
RFDJ8WYP–Serious mature businessman studying diagrams
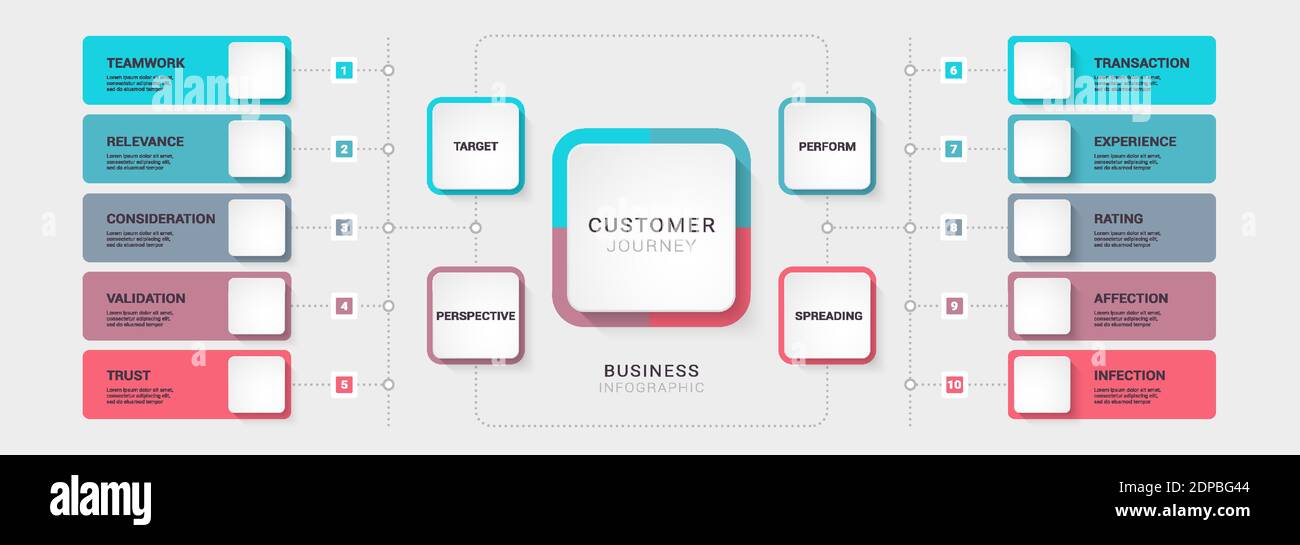 Business customer journey diagrams. Modern 3D Infographic Template. Business Process Chart with Options for Brochure, Diagram, Workflow, Timeline, Num Stock Vectorhttps://www.alamy.com/image-license-details/?v=1https://www.alamy.com/business-customer-journey-diagrams-modern-3d-infographic-template-business-process-chart-with-options-for-brochure-diagram-workflow-timeline-num-image392404660.html
RF2DPBG44–Business customer journey diagrams. Modern 3D Infographic Template. Business Process Chart with Options for Brochure, Diagram, Workflow, Timeline, Num
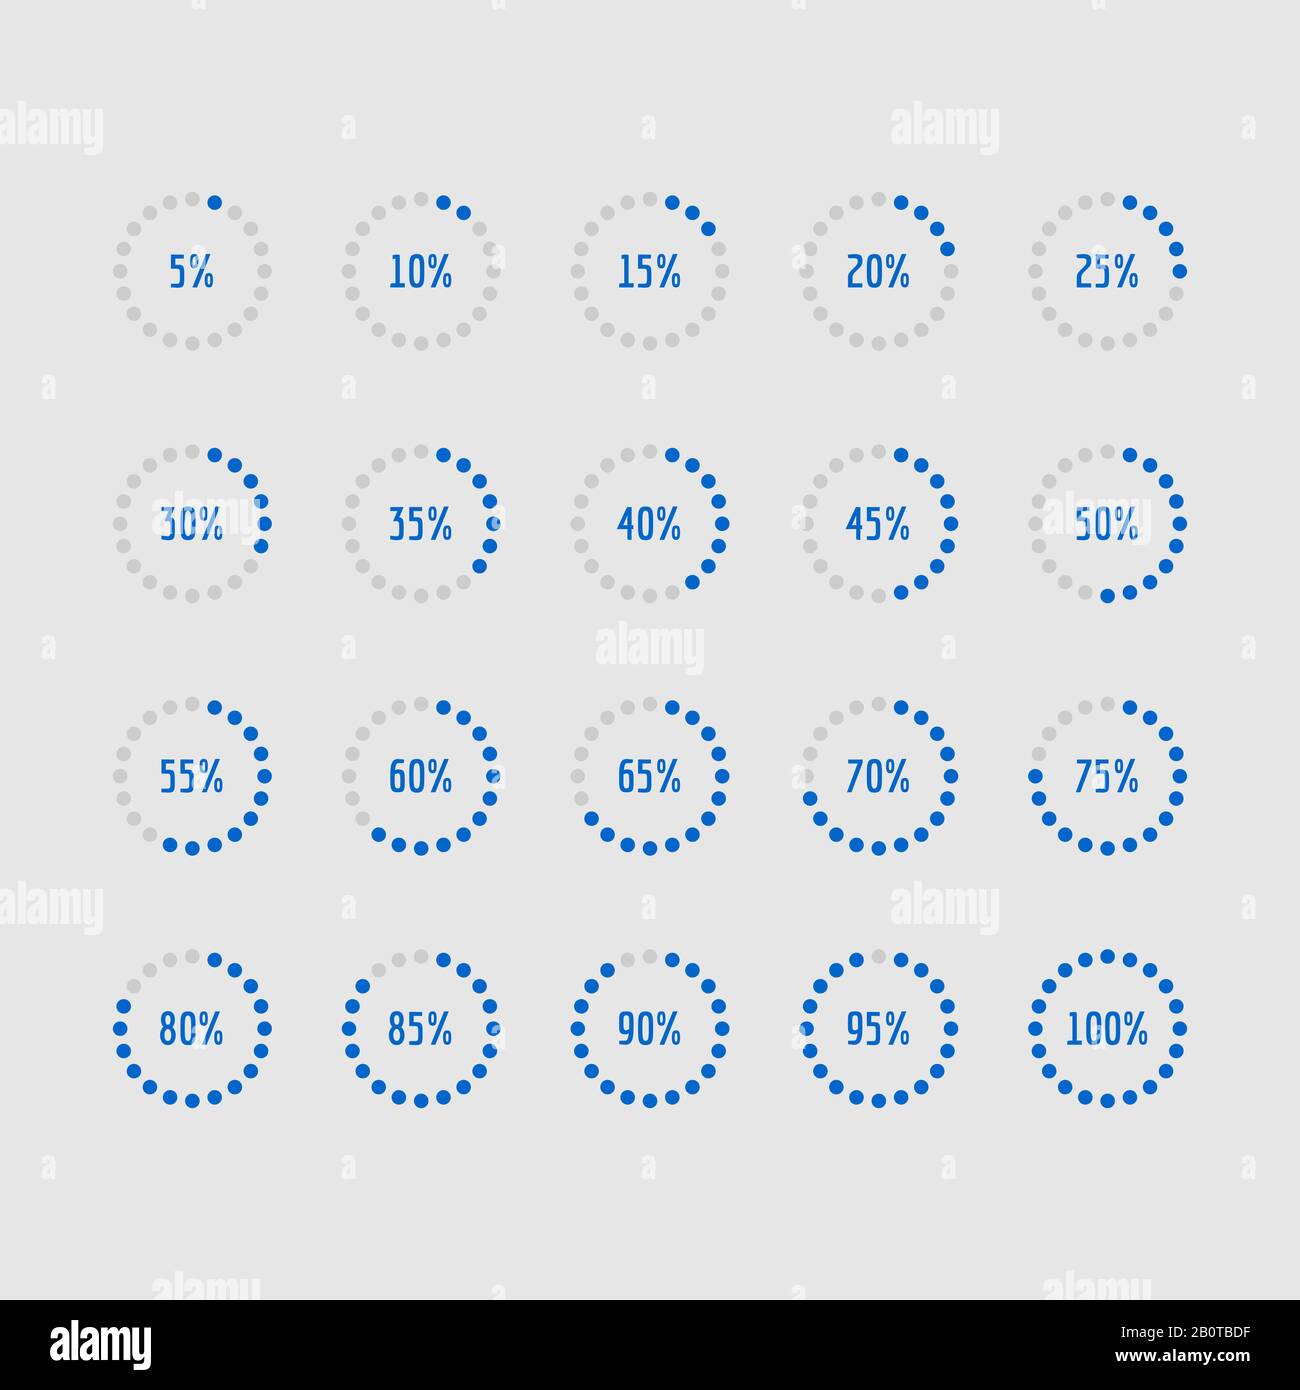 Pie charts, circle percentage diagrams of loading. Progress chart percentage, illustration of download chart round design Stock Vectorhttps://www.alamy.com/image-license-details/?v=1https://www.alamy.com/pie-charts-circle-percentage-diagrams-of-loading-progress-chart-percentage-illustration-of-download-chart-round-design-image344743211.html
RF2B0TBDF–Pie charts, circle percentage diagrams of loading. Progress chart percentage, illustration of download chart round design
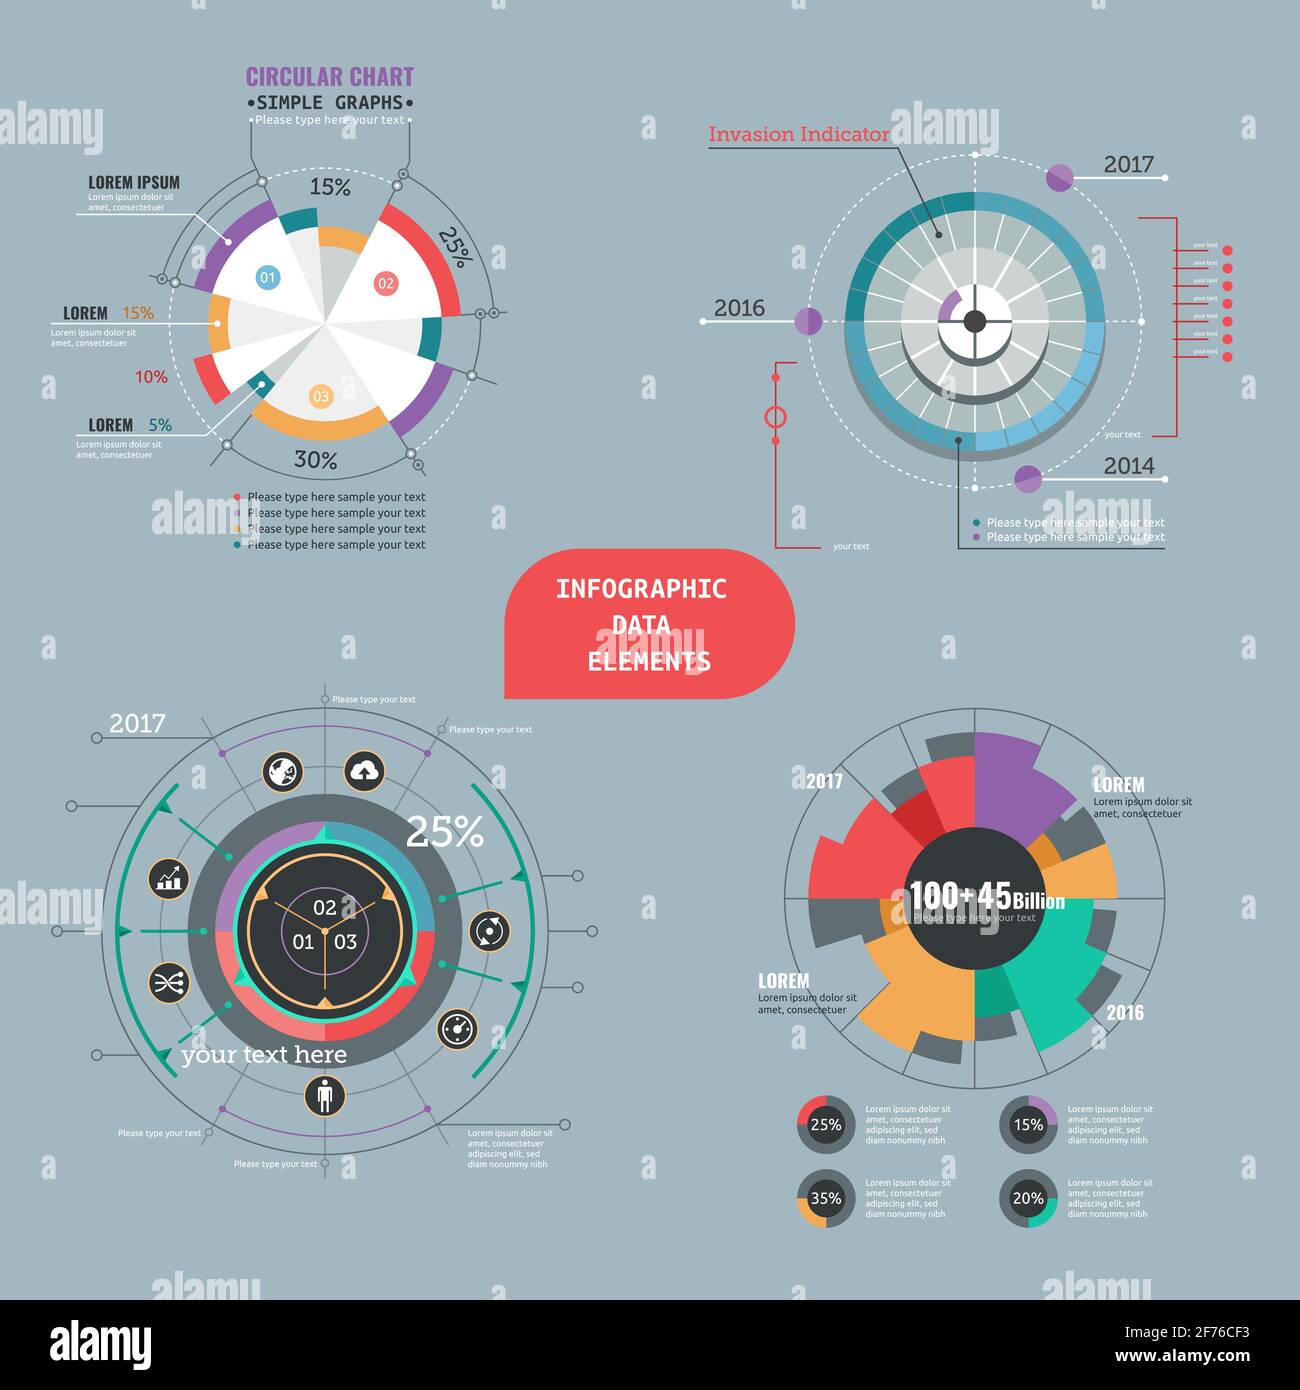 Infographic data elements with Vector set of pie chart template for graphs, charts, diagrams Stock Vectorhttps://www.alamy.com/image-license-details/?v=1https://www.alamy.com/infographic-data-elements-with-vector-set-of-pie-chart-template-for-graphs-charts-diagrams-image417492967.html
RF2F76CF3–Infographic data elements with Vector set of pie chart template for graphs, charts, diagrams
 Set of different color circles pie charts diagrams. Various sectors divide the circle into equal parts. Stock Vectorhttps://www.alamy.com/image-license-details/?v=1https://www.alamy.com/set-of-different-color-circles-pie-charts-diagrams-various-sectors-divide-the-circle-into-equal-parts-image596451983.html
RF2WJAMGF–Set of different color circles pie charts diagrams. Various sectors divide the circle into equal parts.
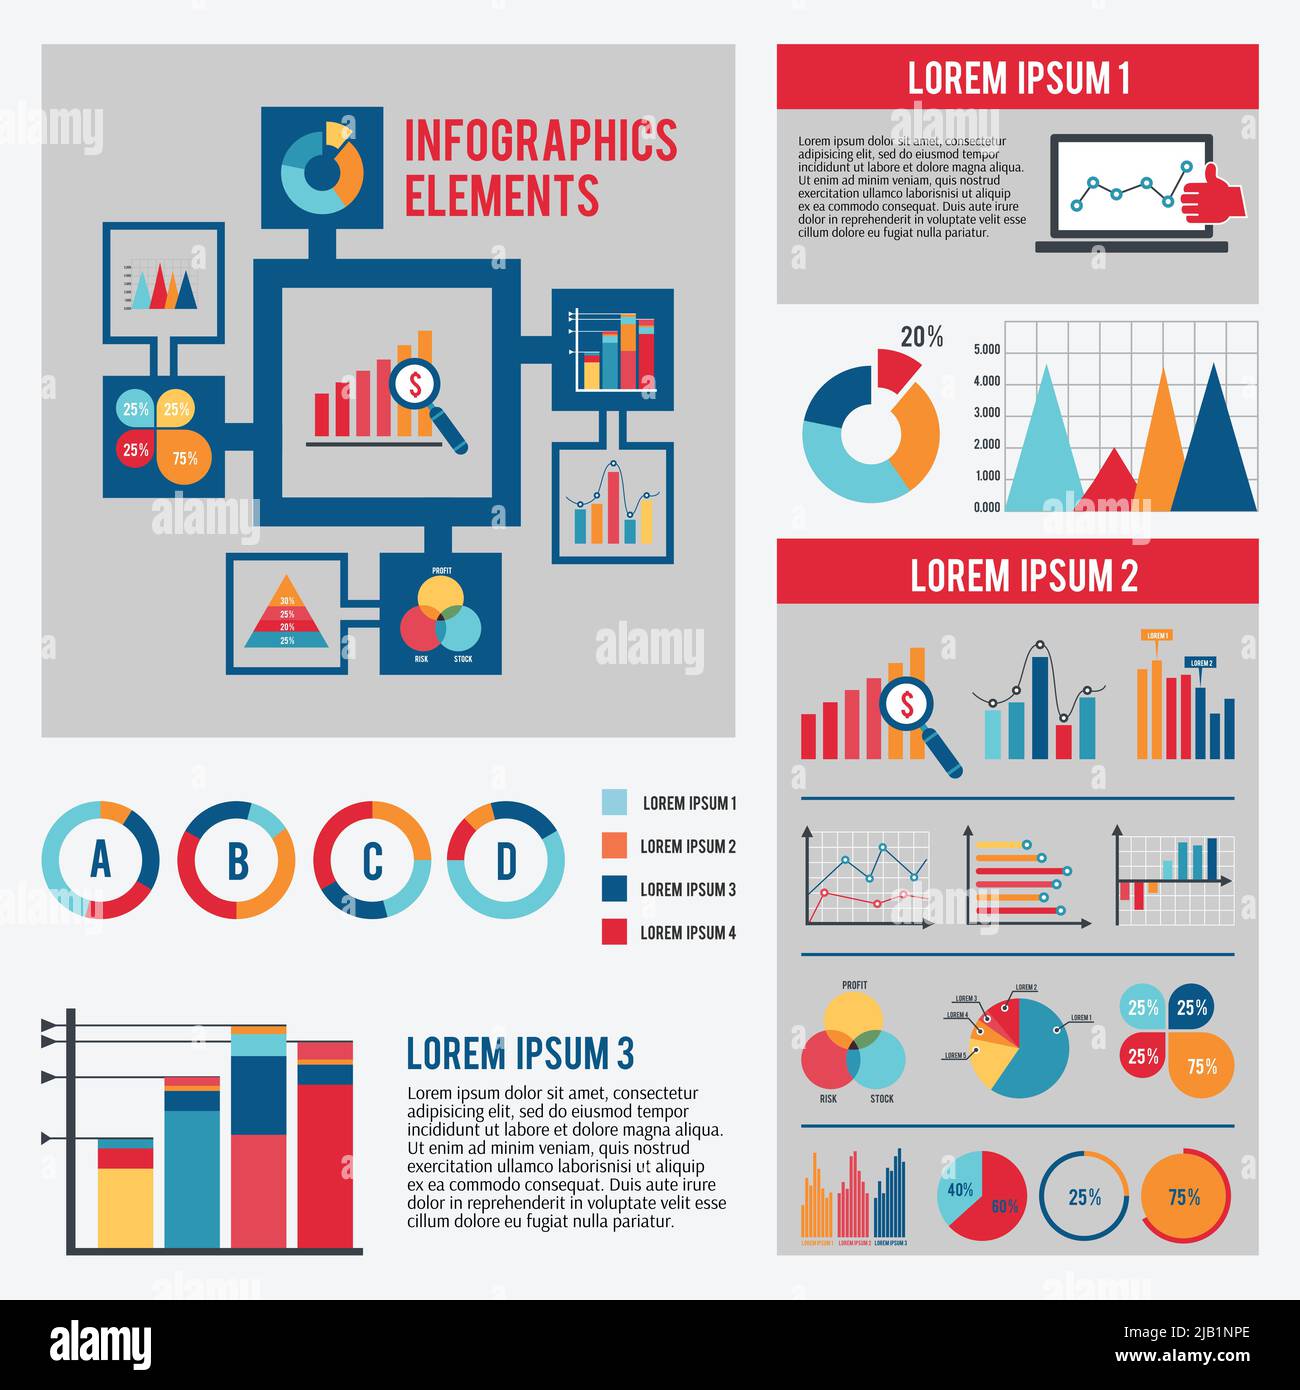 Business data financial report infographics elements set with dot bar pie charts diagrams and graphs isolated vector illustration Stock Vectorhttps://www.alamy.com/image-license-details/?v=1https://www.alamy.com/business-data-financial-report-infographics-elements-set-with-dot-bar-pie-charts-diagrams-and-graphs-isolated-vector-illustration-image471480198.html
RF2JB1NPE–Business data financial report infographics elements set with dot bar pie charts diagrams and graphs isolated vector illustration
 set of shiny graphics and diagrams Stock Vectorhttps://www.alamy.com/image-license-details/?v=1https://www.alamy.com/set-of-shiny-graphics-and-diagrams-image64153584.html
RFDMACFC–set of shiny graphics and diagrams
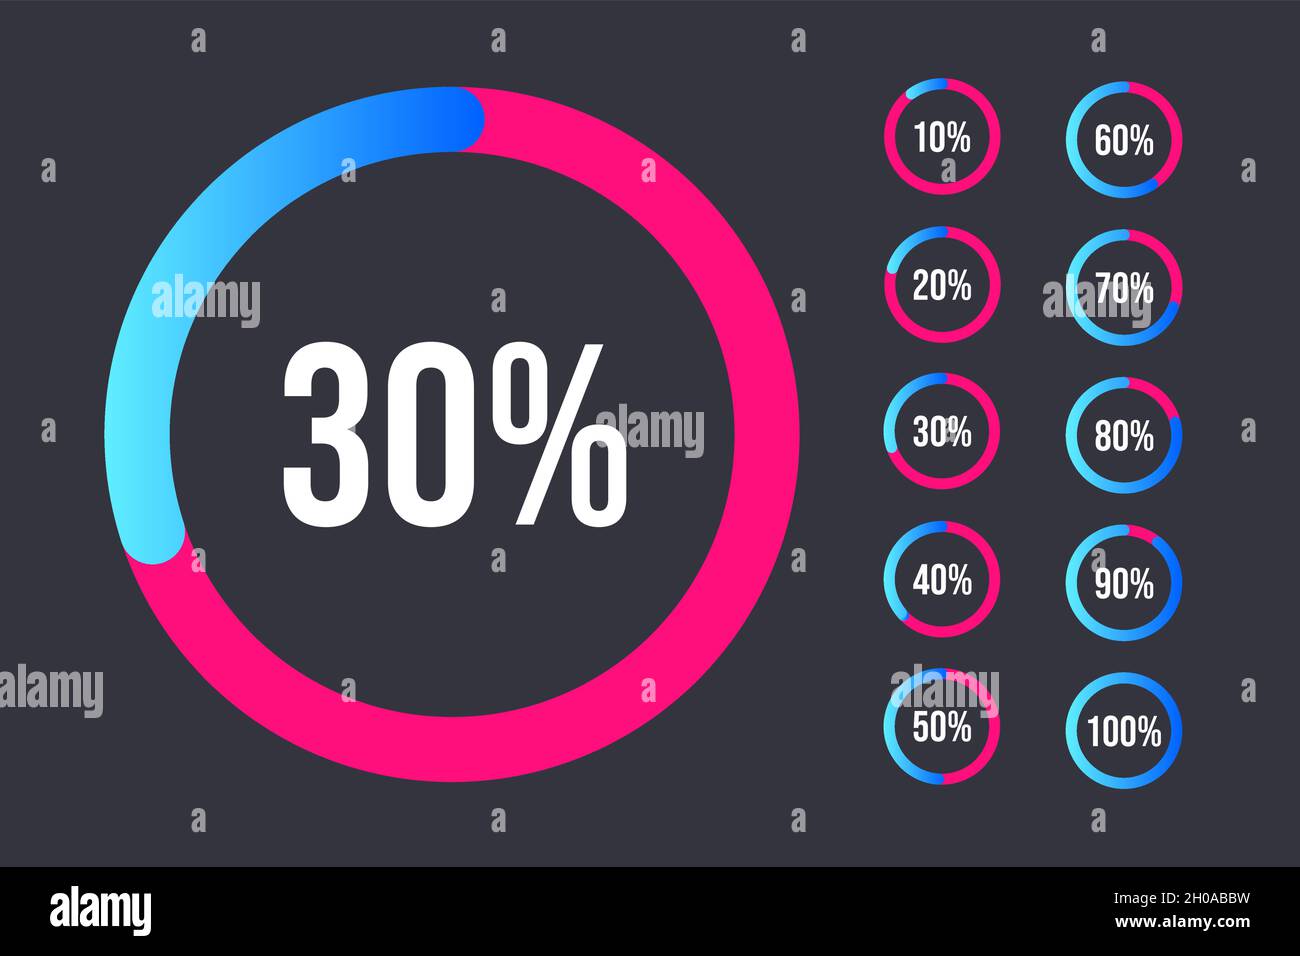 Set of Performance Indicators Percentage Circle from 0 to 100. Circle diagrams meter for web design. Pie Chart with Percentage Values for UX, user int Stock Vectorhttps://www.alamy.com/image-license-details/?v=1https://www.alamy.com/set-of-performance-indicators-percentage-circle-from-0-to-100-circle-diagrams-meter-for-web-design-pie-chart-with-percentage-values-for-ux-user-int-image447698045.html
RF2H0ABBW–Set of Performance Indicators Percentage Circle from 0 to 100. Circle diagrams meter for web design. Pie Chart with Percentage Values for UX, user int
 Set templates Infographics business conceptual cyclic processes for eight positions text area, possible to use for pie chart Stock Vectorhttps://www.alamy.com/image-license-details/?v=1https://www.alamy.com/stock-photo-set-templates-infographics-business-conceptual-cyclic-processes-for-124449899.html
RFH6D537–Set templates Infographics business conceptual cyclic processes for eight positions text area, possible to use for pie chart
 abstract 3d illustration of business diagrams paper and pie chart Stock Photohttps://www.alamy.com/image-license-details/?v=1https://www.alamy.com/stock-photo-abstract-3d-illustration-of-business-diagrams-paper-and-pie-chart-136422933.html
RFHWXGRH–abstract 3d illustration of business diagrams paper and pie chart
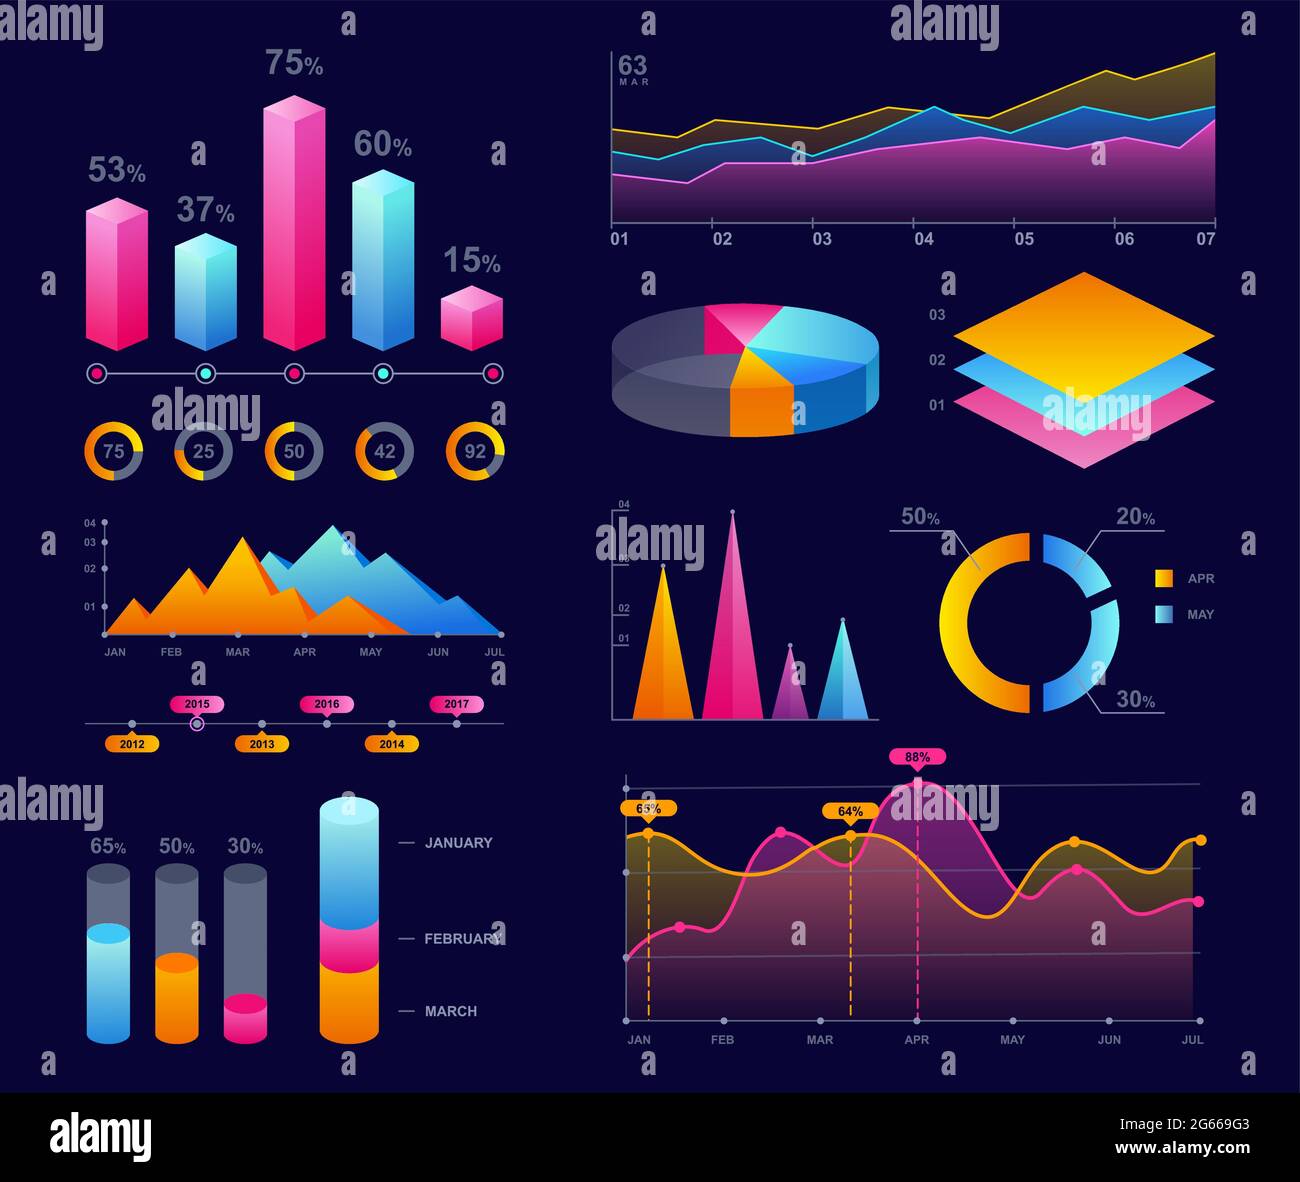 Charts, diagrams and graphs colorful vector illustrations set. Dot, pie and dots bright neon charts collection. Infographics pack. Business marketing Stock Vectorhttps://www.alamy.com/image-license-details/?v=1https://www.alamy.com/charts-diagrams-and-graphs-colorful-vector-illustrations-set-dot-pie-and-dots-bright-neon-charts-collection-infographics-pack-business-marketing-image434086355.html
RF2G669G3–Charts, diagrams and graphs colorful vector illustrations set. Dot, pie and dots bright neon charts collection. Infographics pack. Business marketing
RF2JCX36G–Business graph setting with smartphone 3D icon. Business data market elements dot bar pie charts diagrams and graphs. 3D Rendered Illustration.
 Business analytics flat vector illustration. Marketing metrics, data analysis, financial audit concept. Pie charts and diagrams analyzing. flat vector Stock Vectorhttps://www.alamy.com/image-license-details/?v=1https://www.alamy.com/business-analytics-flat-vector-illustration-marketing-metrics-data-analysis-financial-audit-concept-pie-charts-and-diagrams-analyzing-flat-vector-image491748678.html
RF2KG12CP–Business analytics flat vector illustration. Marketing metrics, data analysis, financial audit concept. Pie charts and diagrams analyzing. flat vector
 Global Finance, World Map and Pie Charts Stock Photohttps://www.alamy.com/image-license-details/?v=1https://www.alamy.com/stock-photo-global-finance-world-map-and-pie-charts-176889192.html
RFM7NYY4–Global Finance, World Map and Pie Charts
 Blue transparent pie chart and bar graph business diagrams with magnifier loupe over white background, financial growth, statistics or investment grap Stock Photohttps://www.alamy.com/image-license-details/?v=1https://www.alamy.com/blue-transparent-pie-chart-and-bar-graph-business-diagrams-with-magnifier-loupe-over-white-background-financial-growth-statistics-or-investment-grap-image606921013.html
RF2X7BHXD–Blue transparent pie chart and bar graph business diagrams with magnifier loupe over white background, financial growth, statistics or investment grap
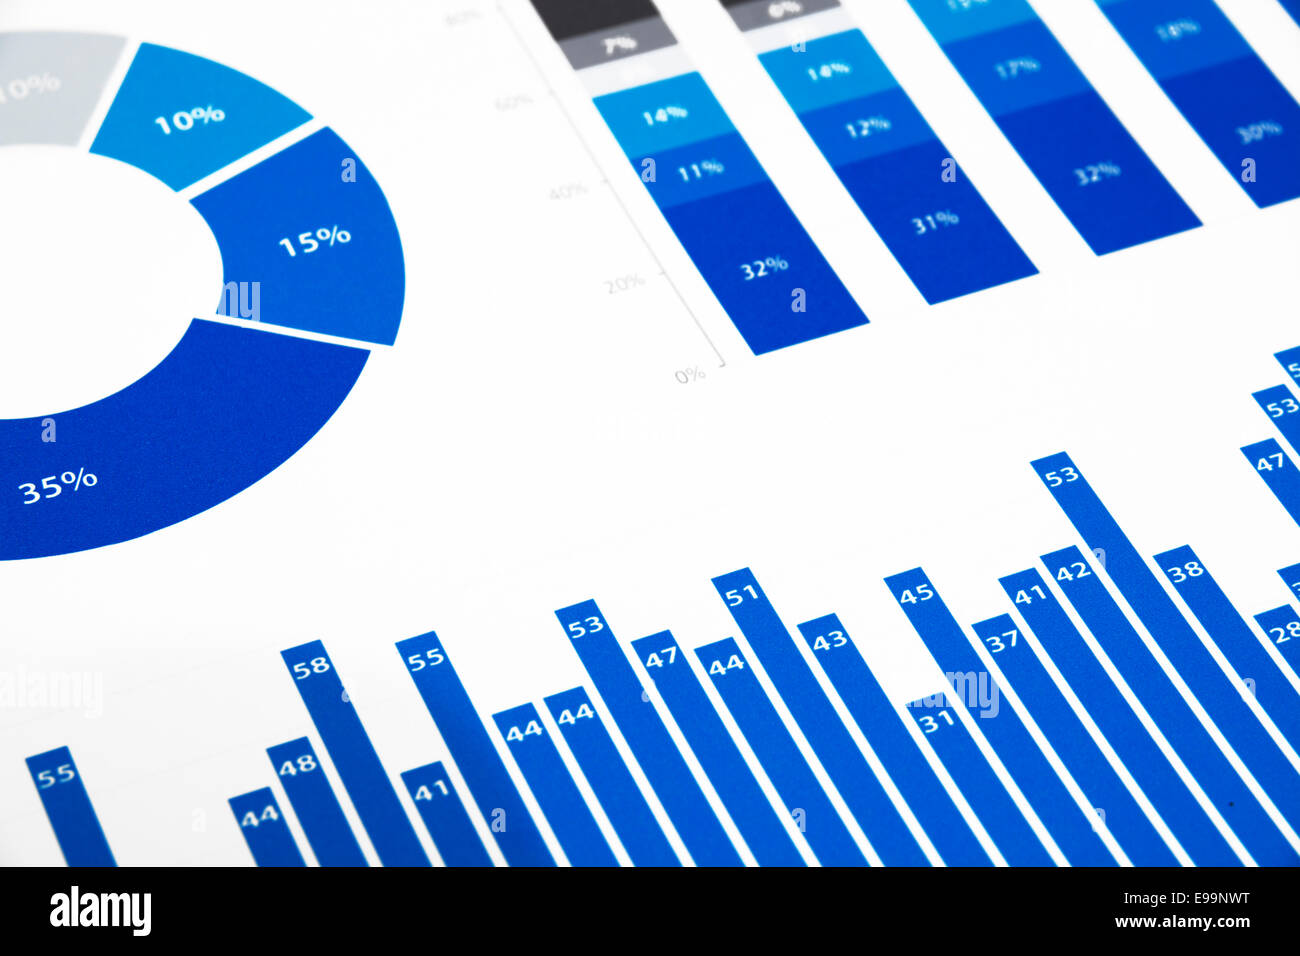 Business charts and diagrams on paper. Stock Photohttps://www.alamy.com/image-license-details/?v=1https://www.alamy.com/stock-photo-business-charts-and-diagrams-on-paper-74588132.html
RFE99NWT–Business charts and diagrams on paper.
RF2WDXNNC–Big percent collection for user interface UI or business infographic. Set of icon for infographic. Percentage circle diagrams from 0 to 100. Black and
 Set of outline donut charts or pies divided on 10 equal parts. Infographic wheels separated on ten segments. Circle diagrams isolated on transparent background. Vector outline illustration Stock Vectorhttps://www.alamy.com/image-license-details/?v=1https://www.alamy.com/set-of-outline-donut-charts-or-pies-divided-on-10-equal-parts-infographic-wheels-separated-on-ten-segments-circle-diagrams-isolated-on-transparent-background-vector-outline-illustration-image472368241.html
RF2JCE6E9–Set of outline donut charts or pies divided on 10 equal parts. Infographic wheels separated on ten segments. Circle diagrams isolated on transparent background. Vector outline illustration
 Set of circle percentage diagrams meters for web design, user interface UI or infographic - indicator with red Stock Vectorhttps://www.alamy.com/image-license-details/?v=1https://www.alamy.com/set-of-circle-percentage-diagrams-meters-for-web-design-user-interface-ui-or-infographic-indicator-with-red-image449952669.html
RF2H41365–Set of circle percentage diagrams meters for web design, user interface UI or infographic - indicator with red
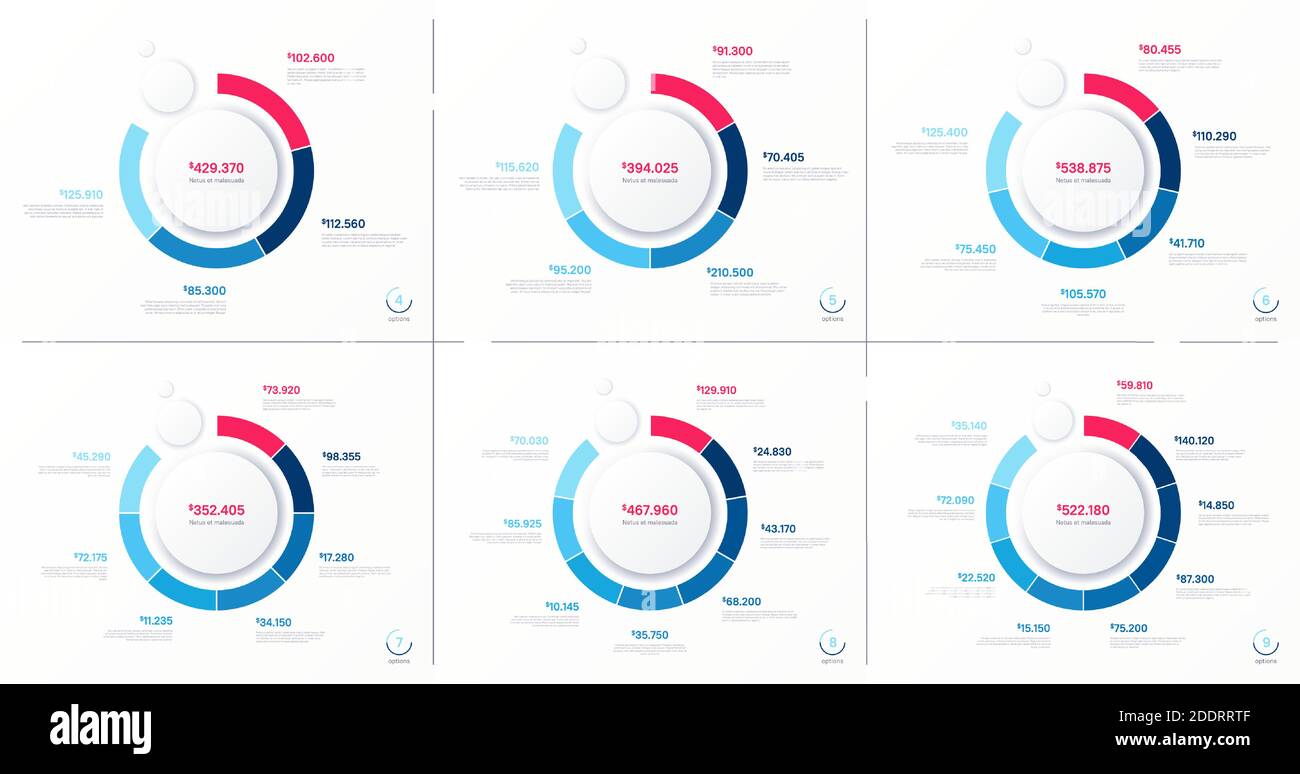 Set of vector round chart diagrams. Infographic, presentation, report, visualization templates Stock Vectorhttps://www.alamy.com/image-license-details/?v=1https://www.alamy.com/set-of-vector-round-chart-diagrams-infographic-presentation-report-visualization-templates-image387142239.html
RF2DDRRTF–Set of vector round chart diagrams. Infographic, presentation, report, visualization templates
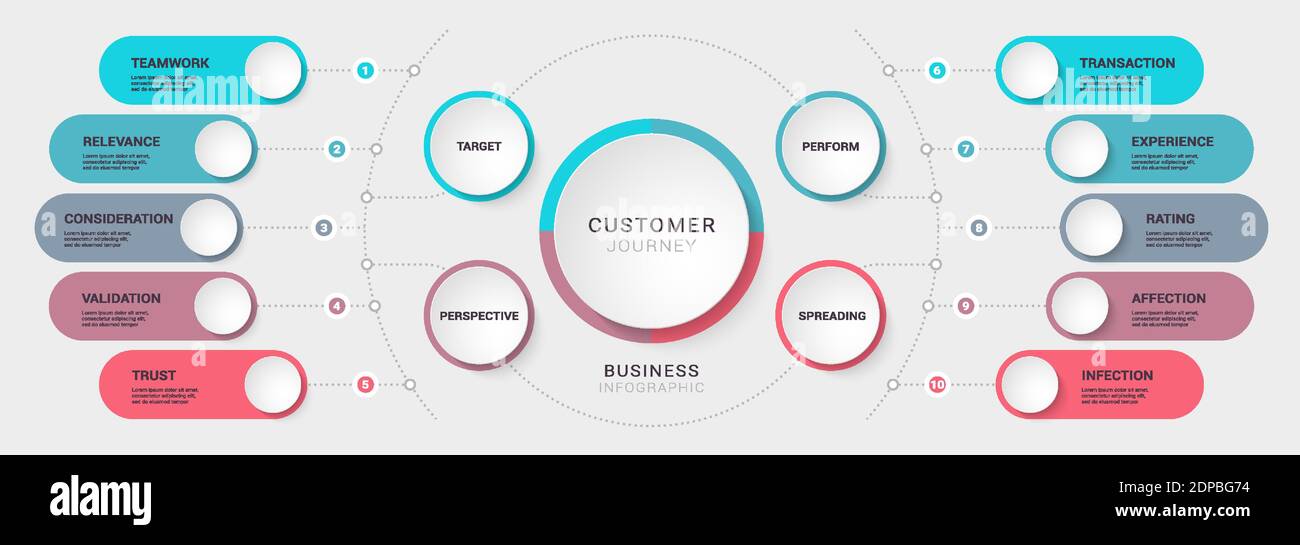 Business customer journey diagrams. Modern 3D Infographic Template. Business Process Chart with Options for Brochure, Diagram, Workflow, Timeline, Num Stock Vectorhttps://www.alamy.com/image-license-details/?v=1https://www.alamy.com/business-customer-journey-diagrams-modern-3d-infographic-template-business-process-chart-with-options-for-brochure-diagram-workflow-timeline-num-image392404744.html
RF2DPBG74–Business customer journey diagrams. Modern 3D Infographic Template. Business Process Chart with Options for Brochure, Diagram, Workflow, Timeline, Num
RF2BEFAJX–Color finance data chart vector icons. Statistics colorful presentation graphics and diagrams. Chart and diagram data, finance graphic pie and bar illustration
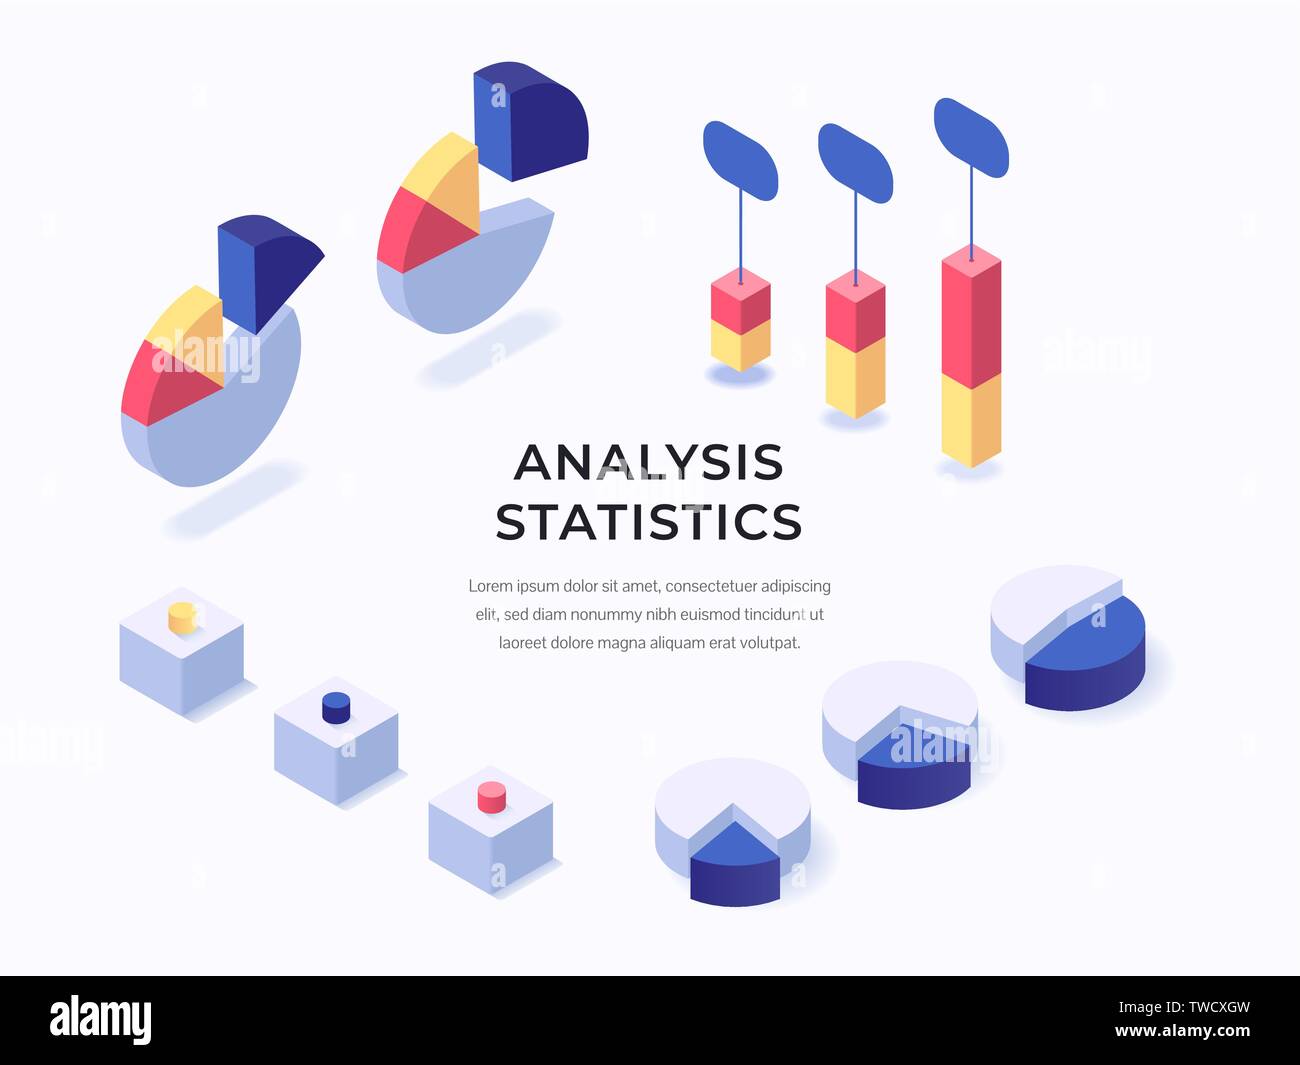 Different diagrams and charts isometric vector illustration. Business charts, infographic elements Stock Vectorhttps://www.alamy.com/image-license-details/?v=1https://www.alamy.com/different-diagrams-and-charts-isometric-vector-illustration-business-charts-infographic-elements-image256595833.html
RFTWCXGW–Different diagrams and charts isometric vector illustration. Business charts, infographic elements
 Set of different color circles pie charts diagrams. Various sectors divide the circle into equal parts. Stock Vectorhttps://www.alamy.com/image-license-details/?v=1https://www.alamy.com/set-of-different-color-circles-pie-charts-diagrams-various-sectors-divide-the-circle-into-equal-parts-image596450961.html
RF2WJAK81–Set of different color circles pie charts diagrams. Various sectors divide the circle into equal parts.
 multicolor diagrams and pie charts on white background Stock Photohttps://www.alamy.com/image-license-details/?v=1https://www.alamy.com/multicolor-diagrams-and-pie-charts-on-white-background-image337101477.html
RF2AGC8AD–multicolor diagrams and pie charts on white background
 Bar and Pie Charts Stock Vectorhttps://www.alamy.com/image-license-details/?v=1https://www.alamy.com/bar-and-pie-charts-image64061153.html
RFDM66J9–Bar and Pie Charts
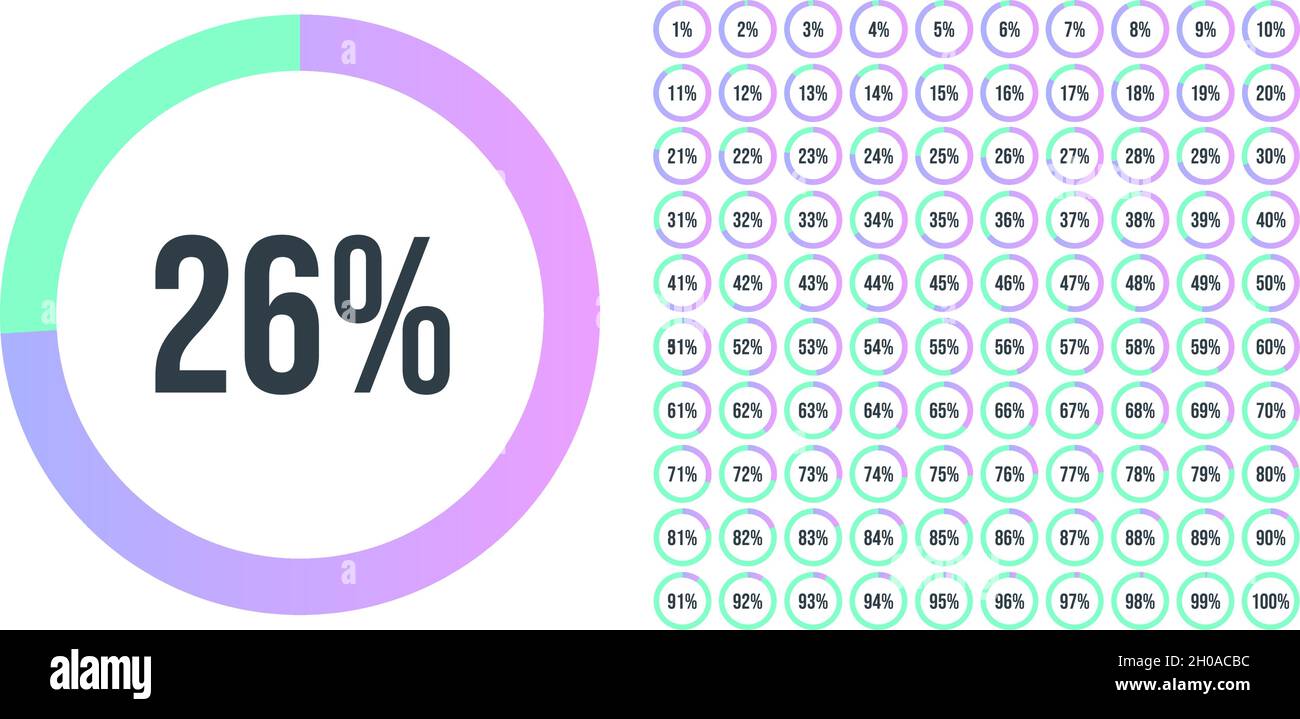 Set of Performance Indicators Percentage Circle from 0 to 100. Circle diagrams meter for web design. Pie Chart with Percentage Values for UX, user int Stock Vectorhttps://www.alamy.com/image-license-details/?v=1https://www.alamy.com/set-of-performance-indicators-percentage-circle-from-0-to-100-circle-diagrams-meter-for-web-design-pie-chart-with-percentage-values-for-ux-user-int-image447698816.html
RF2H0ACBC–Set of Performance Indicators Percentage Circle from 0 to 100. Circle diagrams meter for web design. Pie Chart with Percentage Values for UX, user int
 Diagrams and pie Charts and other infographics drawings as design elements collection. Stock Photohttps://www.alamy.com/image-license-details/?v=1https://www.alamy.com/diagrams-and-pie-charts-and-other-infographics-drawings-as-design-image67212202.html
RFDW9NRP–Diagrams and pie Charts and other infographics drawings as design elements collection.
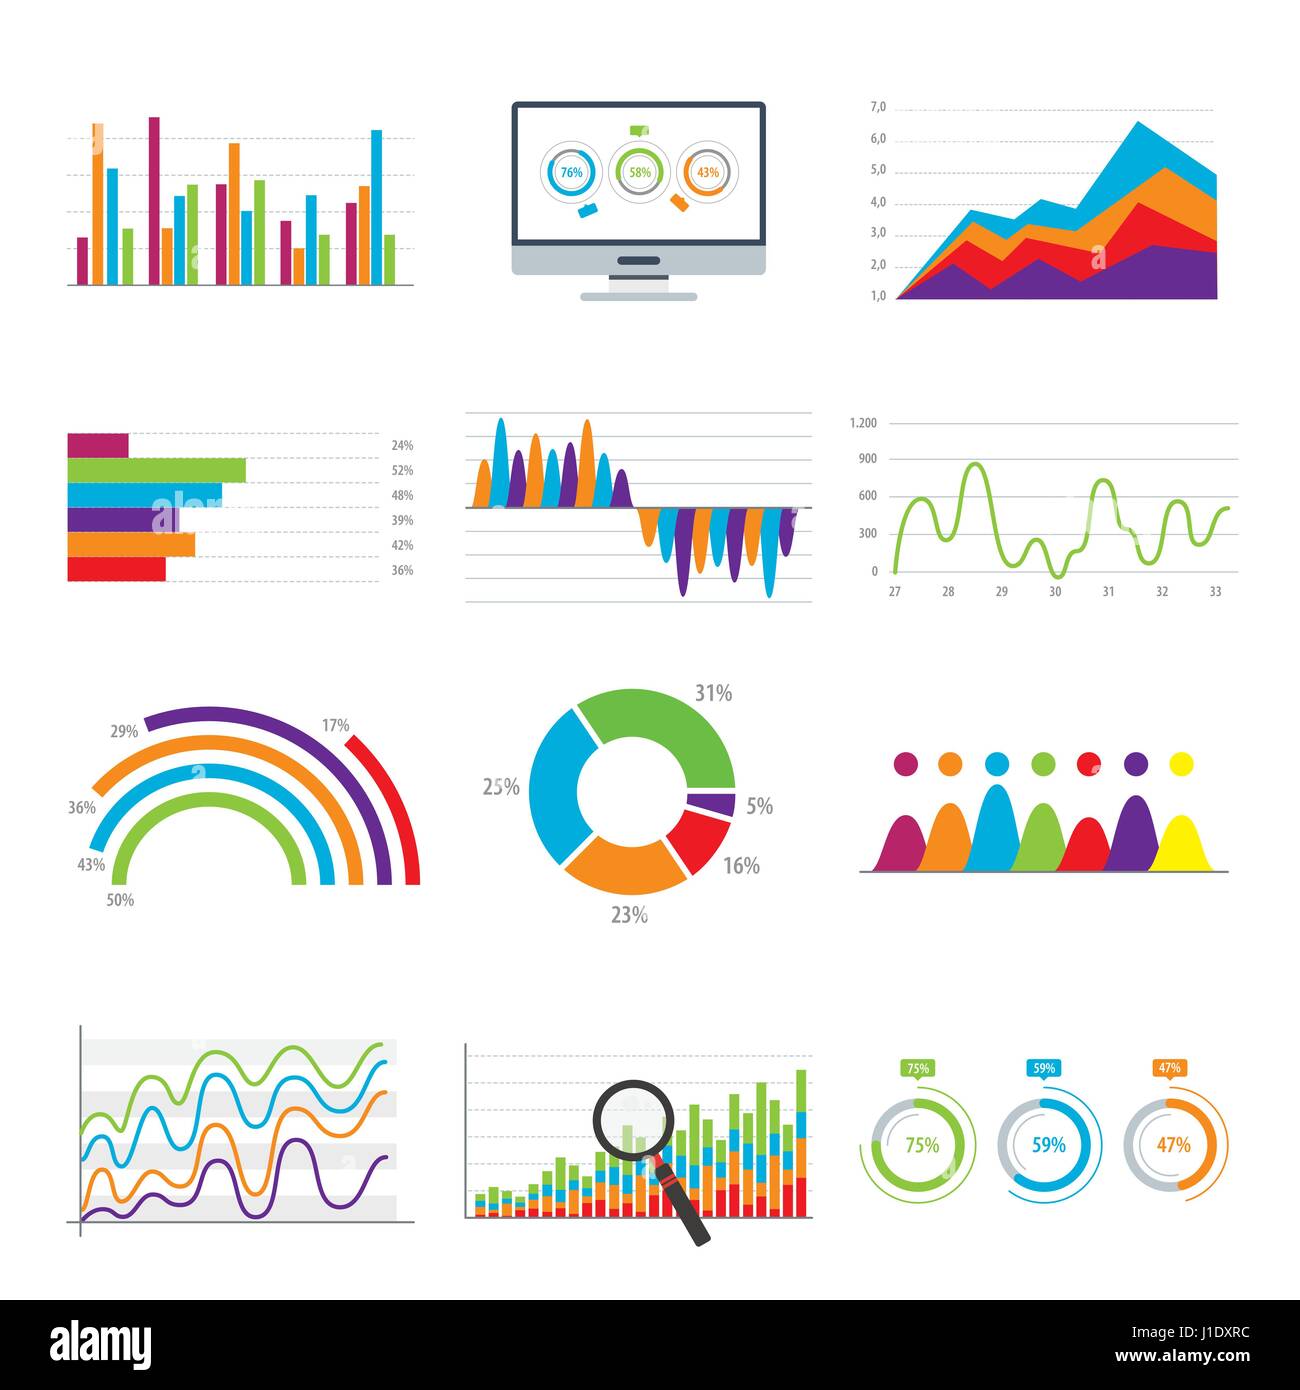 Business data market elements bar pie charts diagrams and graphs flat icons in vector illustration. Stock Vectorhttps://www.alamy.com/image-license-details/?v=1https://www.alamy.com/stock-photo-business-data-market-elements-bar-pie-charts-diagrams-and-graphs-flat-138604016.html
RFJ1DXRC–Business data market elements bar pie charts diagrams and graphs flat icons in vector illustration.
 Infographic dashboard mockups with pie charts, information, diagrams and graphs. Presentation slides online statistics and data analytics. Template Stock Vectorhttps://www.alamy.com/image-license-details/?v=1https://www.alamy.com/infographic-dashboard-mockups-with-pie-charts-information-diagrams-and-graphs-presentation-slides-online-statistics-and-data-analytics-template-image432314306.html
RF2G39H8J–Infographic dashboard mockups with pie charts, information, diagrams and graphs. Presentation slides online statistics and data analytics. Template
RF2JA88RR–Business graph setting with smartphone 3D icon. Business data market elements dot bar pie charts diagrams and graphs. 3D Rendered Illustration.
 Puzzle pie diagrams. Modern people infographics. Flat illustration isolated on violet background. Stock Photohttps://www.alamy.com/image-license-details/?v=1https://www.alamy.com/puzzle-pie-diagrams-modern-people-infographics-flat-illustration-isolated-on-violet-background-image612936242.html
RM2XH5JC2–Puzzle pie diagrams. Modern people infographics. Flat illustration isolated on violet background.
 Financial Economic Statistics, Capital Expansion, World Map and Pie Chart Currency Symbols Stock Photohttps://www.alamy.com/image-license-details/?v=1https://www.alamy.com/stock-photo-financial-economic-statistics-capital-expansion-world-map-and-pie-176830511.html
RFM7K93B–Financial Economic Statistics, Capital Expansion, World Map and Pie Chart Currency Symbols
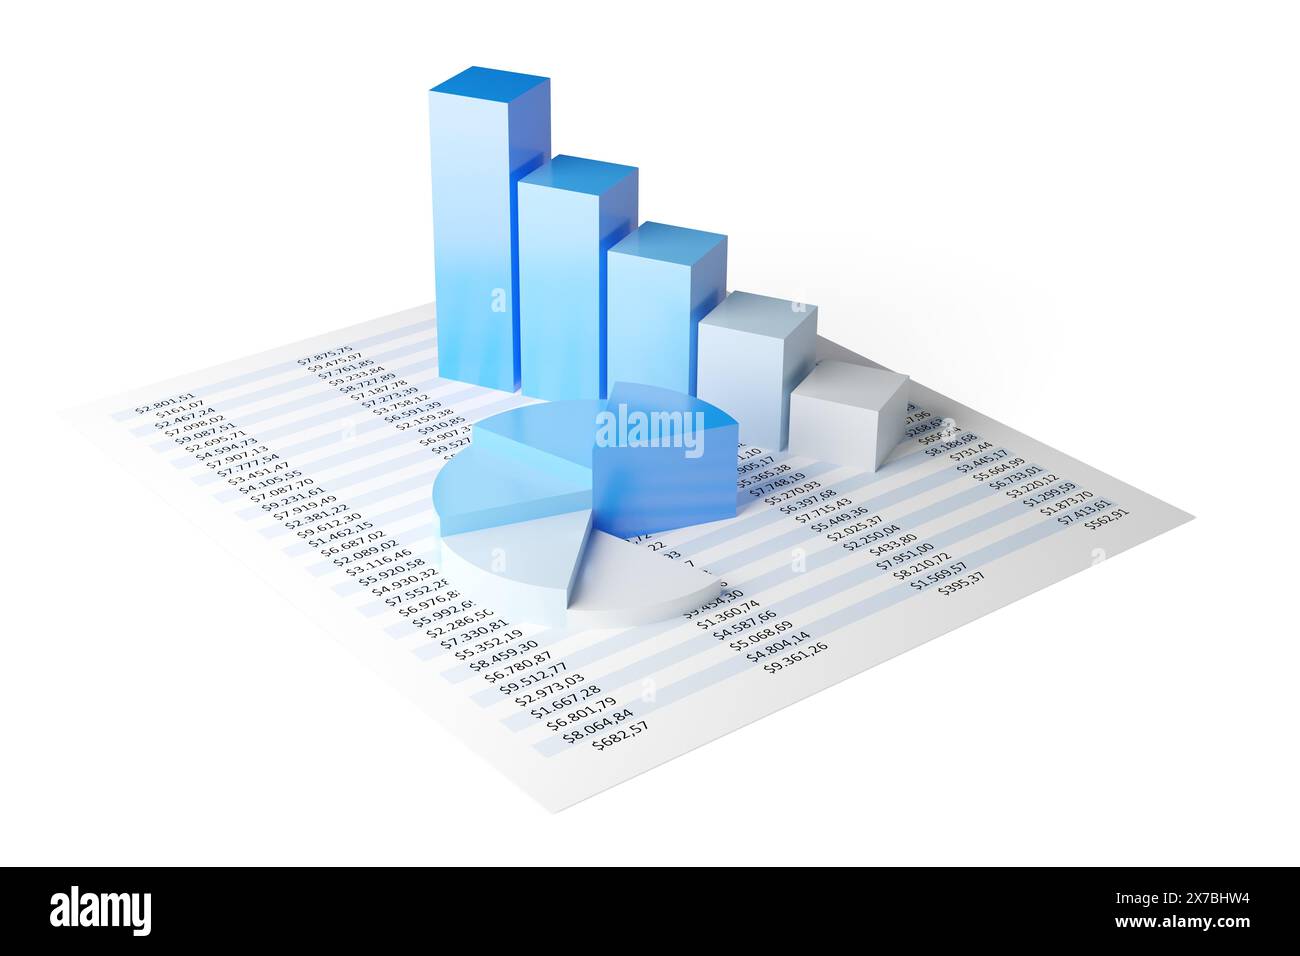 Blue pie chart and bar graph business diagrams on numbers spreadsheet over white background, financial growth, statistics or investment graph concept, Stock Photohttps://www.alamy.com/image-license-details/?v=1https://www.alamy.com/blue-pie-chart-and-bar-graph-business-diagrams-on-numbers-spreadsheet-over-white-background-financial-growth-statistics-or-investment-graph-concept-image606920976.html
RF2X7BHW4–Blue pie chart and bar graph business diagrams on numbers spreadsheet over white background, financial growth, statistics or investment graph concept,
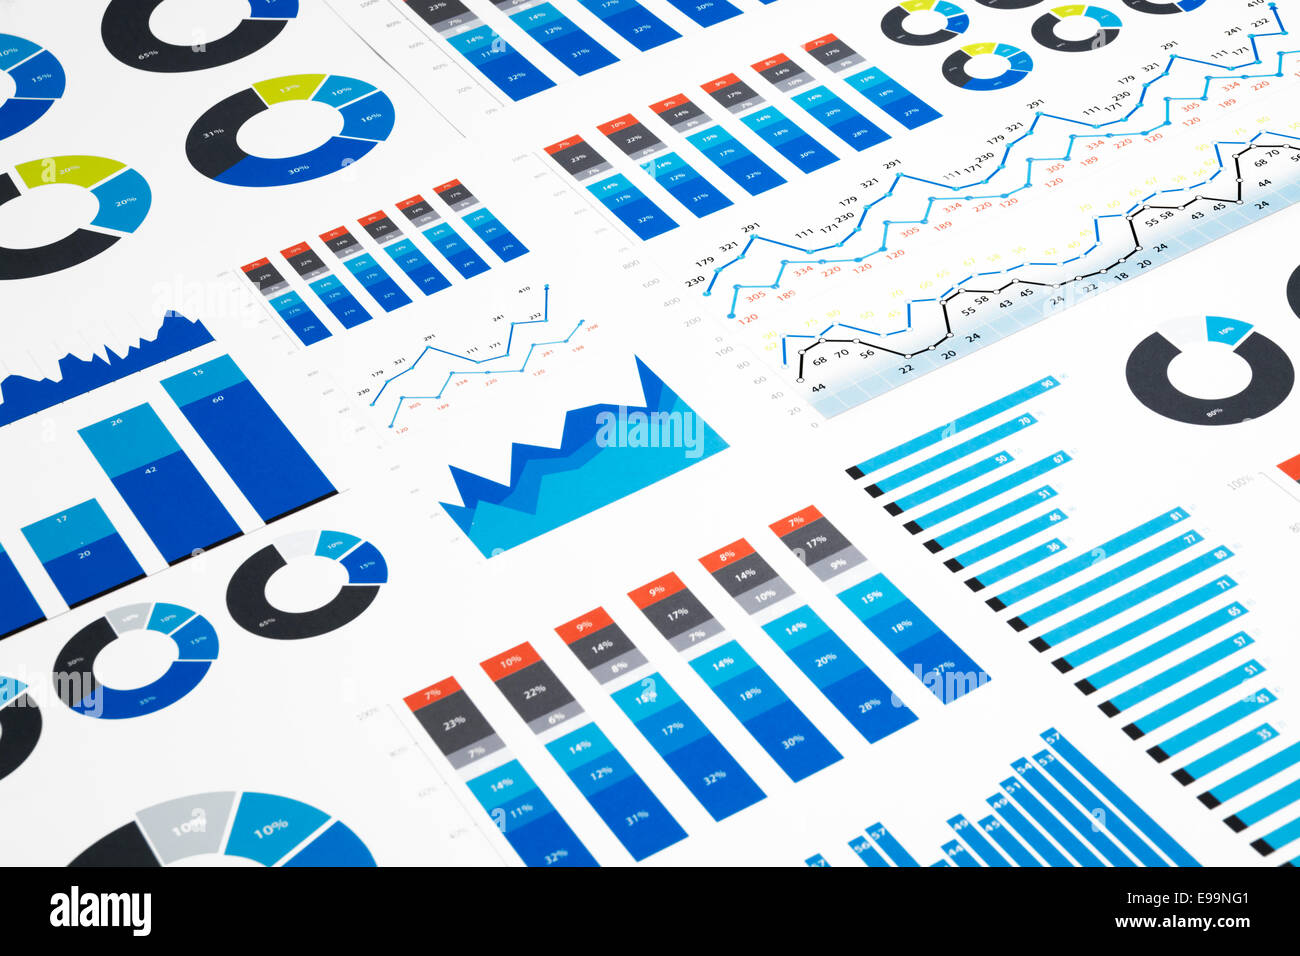 Business charts and diagrams on paper. Stock Photohttps://www.alamy.com/image-license-details/?v=1https://www.alamy.com/stock-photo-business-charts-and-diagrams-on-paper-74587857.html
RFE99NG1–Business charts and diagrams on paper.
RF2XMXK9C–Set of icon for infographic. Big percent collection for user interface UI or business infographic. Percentage circle diagrams from 0 to 100. Black and
 Outline donut charts or pies segmented on 12 equal parts. Set of infographic wheels divided in twelve sections. Circle diagrams or loading bars on transparent background. Vector graphic illustration Stock Vectorhttps://www.alamy.com/image-license-details/?v=1https://www.alamy.com/outline-donut-charts-or-pies-segmented-on-12-equal-parts-set-of-infographic-wheels-divided-in-twelve-sections-circle-diagrams-or-loading-bars-on-transparent-background-vector-graphic-illustration-image484298693.html
RF2K3WKWW–Outline donut charts or pies segmented on 12 equal parts. Set of infographic wheels divided in twelve sections. Circle diagrams or loading bars on transparent background. Vector graphic illustration
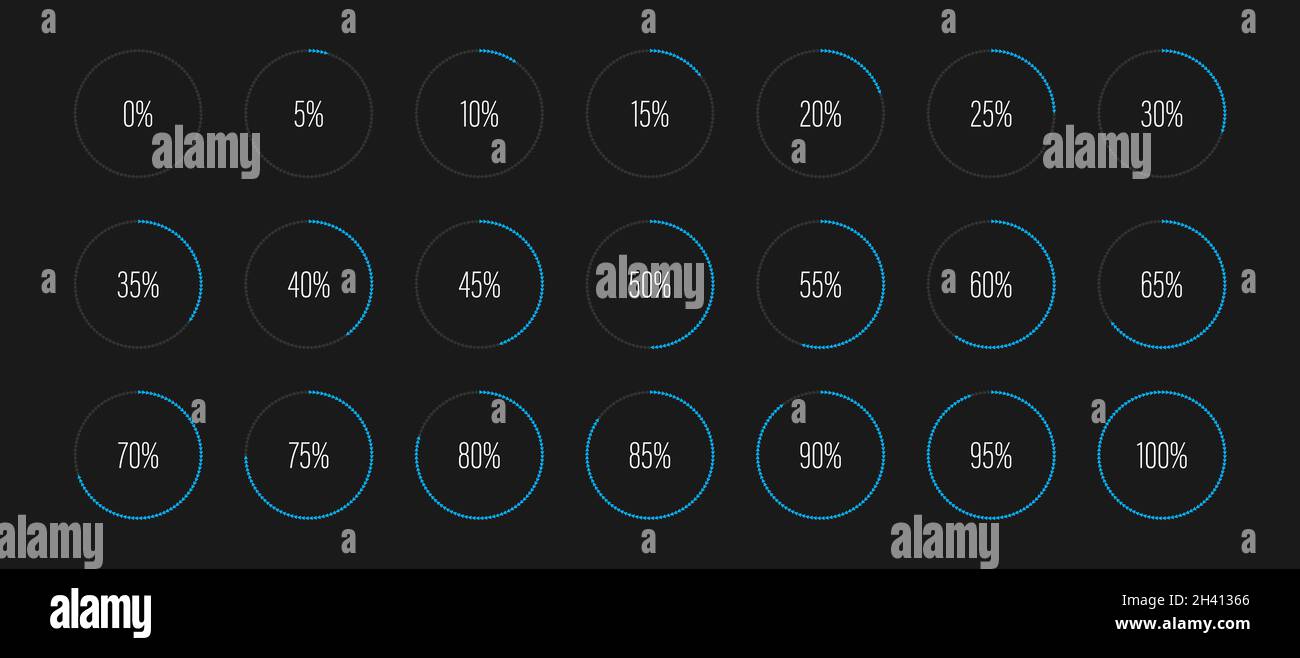 Set of circle percentage diagrams meters for web design, user interface UI or infographic - indicator with blue Stock Vectorhttps://www.alamy.com/image-license-details/?v=1https://www.alamy.com/set-of-circle-percentage-diagrams-meters-for-web-design-user-interface-ui-or-infographic-indicator-with-blue-image449952670.html
RF2H41366–Set of circle percentage diagrams meters for web design, user interface UI or infographic - indicator with blue
 Pie charts-diagrams and graphs for design; Eps8 Stock Vectorhttps://www.alamy.com/image-license-details/?v=1https://www.alamy.com/pie-charts-diagrams-and-graphs-for-design-eps8-image341418702.html
RF2ARCY12–Pie charts-diagrams and graphs for design; Eps8
 Business customer journey diagrams. Modern 3D Infographic Template. Business Process Chart with Options for Brochure, Diagram, Workflow, Timeline, Num Stock Vectorhttps://www.alamy.com/image-license-details/?v=1https://www.alamy.com/business-customer-journey-diagrams-modern-3d-infographic-template-business-process-chart-with-options-for-brochure-diagram-workflow-timeline-num-image392404454.html
RF2DPBFTP–Business customer journey diagrams. Modern 3D Infographic Template. Business Process Chart with Options for Brochure, Diagram, Workflow, Timeline, Num
RF2B0THKP–Elements of infographic with flowchart. Vector statistics diagrams website layout template. Color diagram and graph, icon of business chart illustration
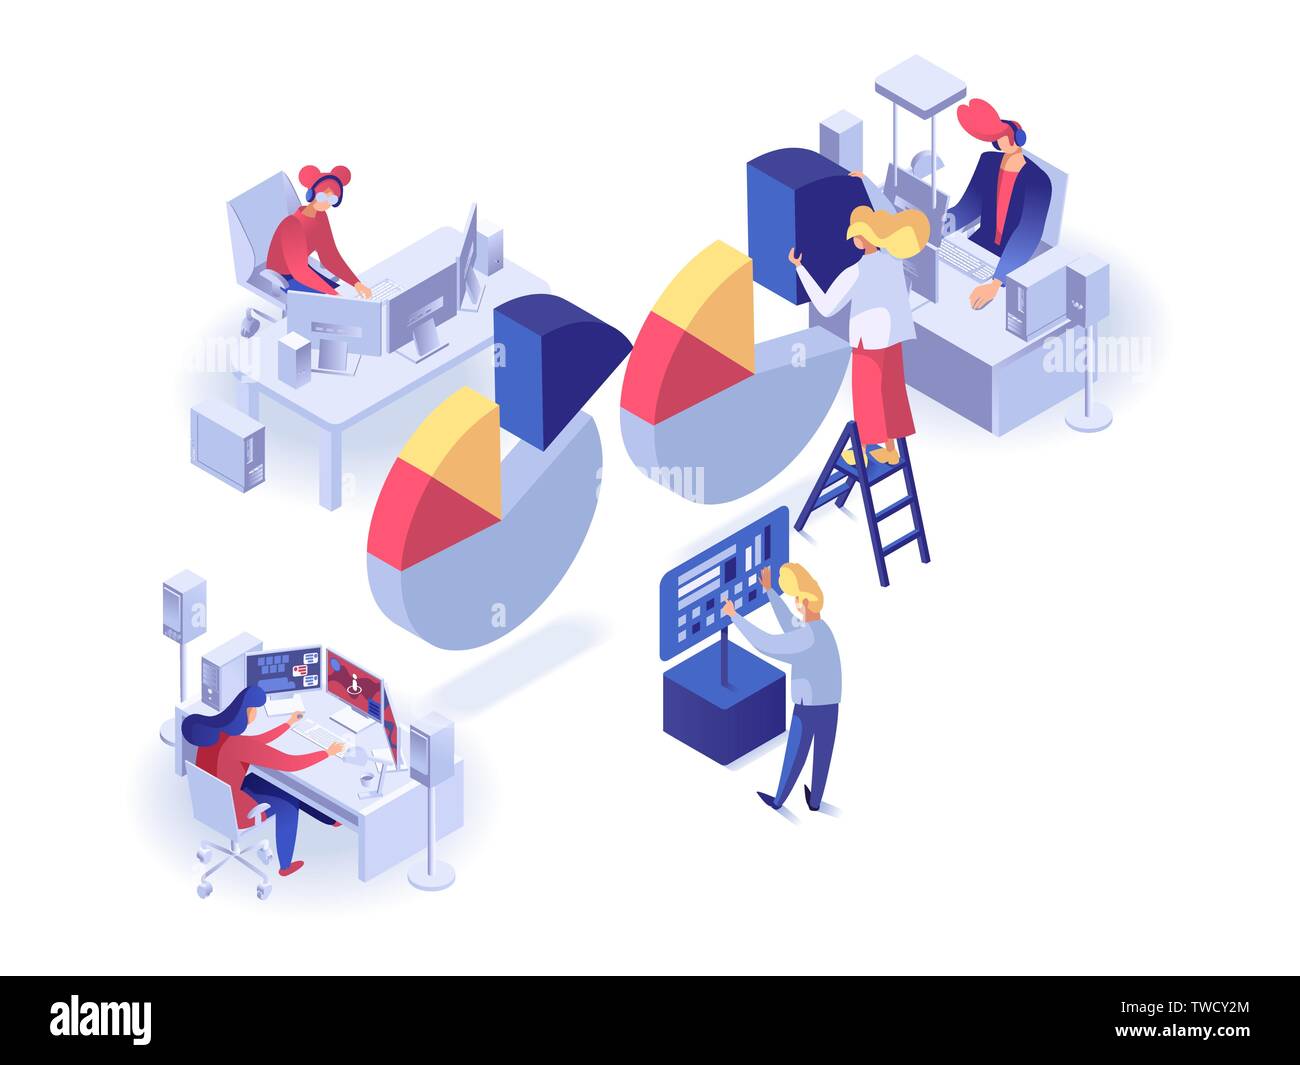 People working at computers around pie chart isometric vector illustration. Workers sitting in the workplace analyze statistics Stock Vectorhttps://www.alamy.com/image-license-details/?v=1https://www.alamy.com/people-working-at-computers-around-pie-chart-isometric-vector-illustration-workers-sitting-in-the-workplace-analyze-statistics-image256596220.html
RFTWCY2M–People working at computers around pie chart isometric vector illustration. Workers sitting in the workplace analyze statistics
 Set of different color circles pie charts diagrams. Various sectors divide the circle into equal parts. Stock Vectorhttps://www.alamy.com/image-license-details/?v=1https://www.alamy.com/set-of-different-color-circles-pie-charts-diagrams-various-sectors-divide-the-circle-into-equal-parts-image596450634.html
RF2WJAJTA–Set of different color circles pie charts diagrams. Various sectors divide the circle into equal parts.
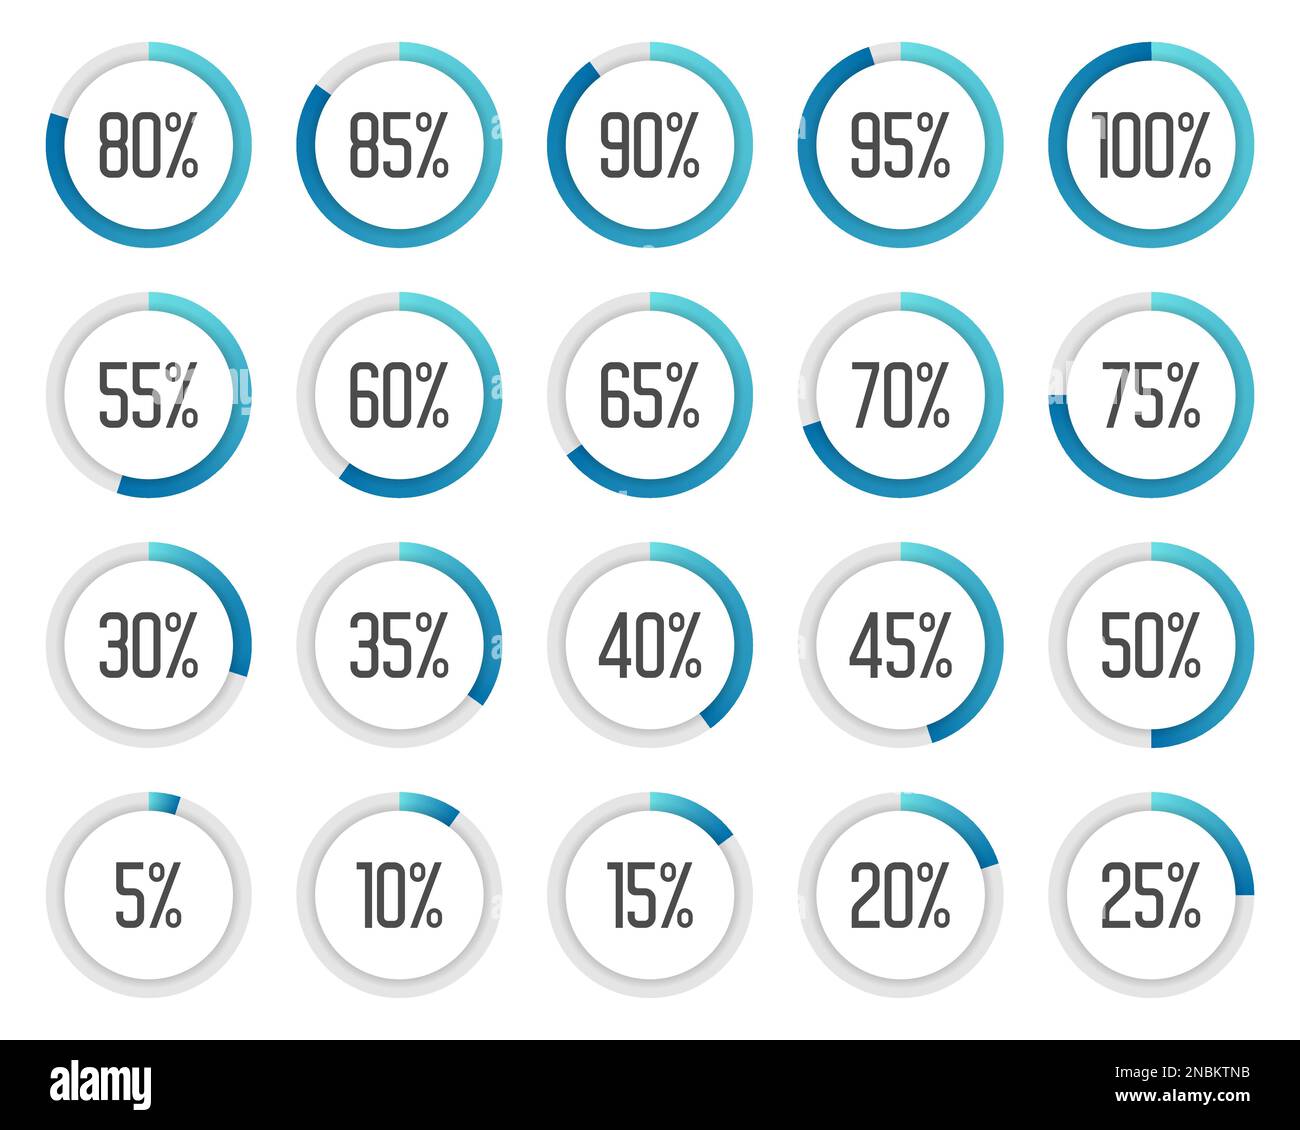 Set of colorful pie charts. Collection of blue percentage diagrams Stock Vectorhttps://www.alamy.com/image-license-details/?v=1https://www.alamy.com/set-of-colorful-pie-charts-collection-of-blue-percentage-diagrams-image523508759.html
RF2NBKTNB–Set of colorful pie charts. Collection of blue percentage diagrams
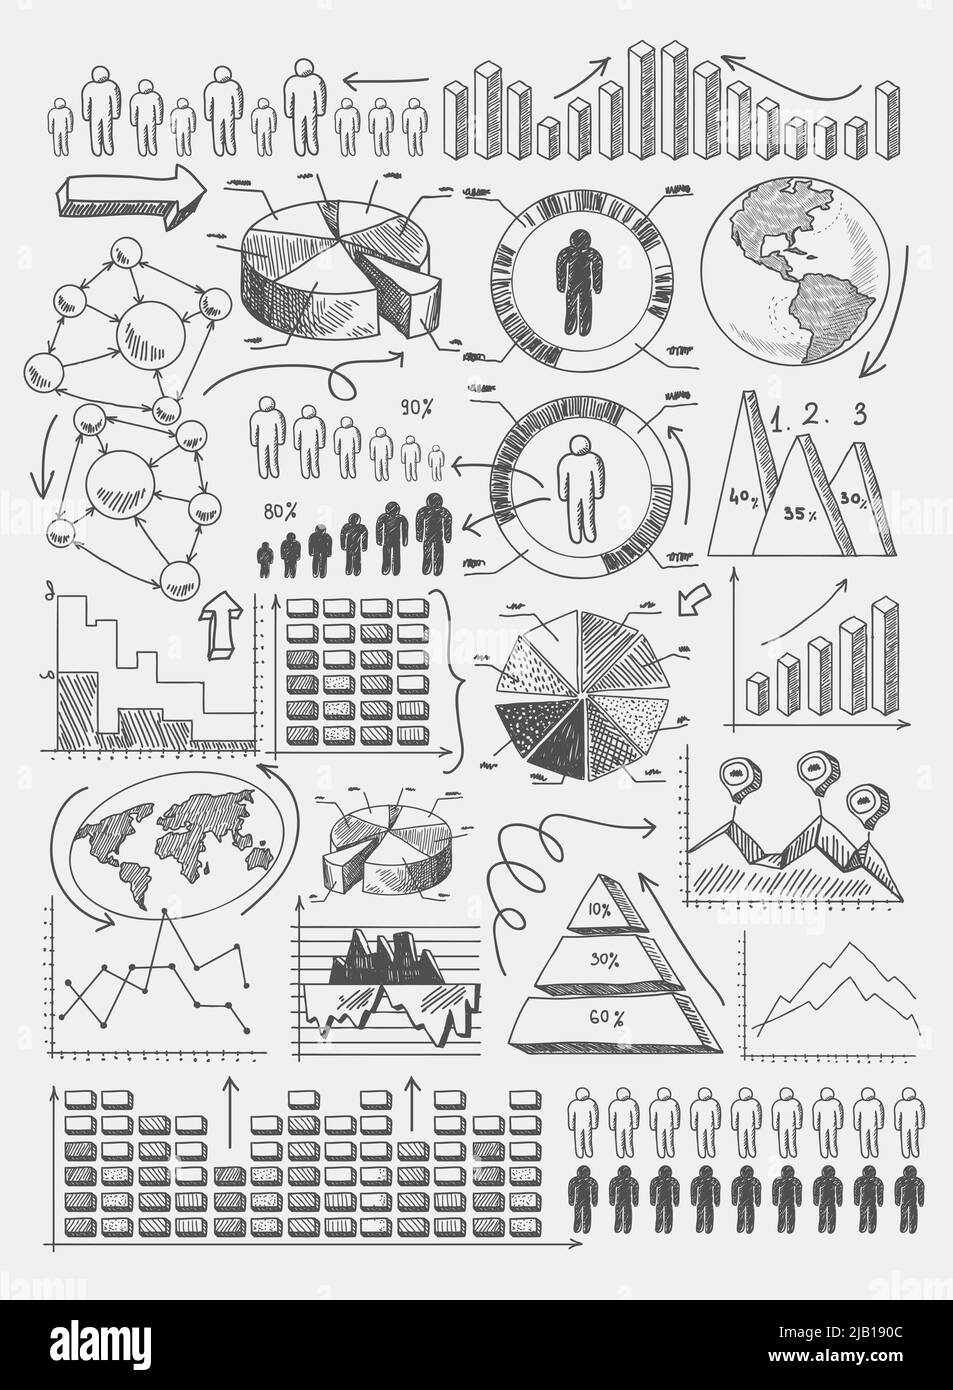 Sketch diagrams charts dot bar pie graphs infographics set doodle vector illustration Stock Vectorhttps://www.alamy.com/image-license-details/?v=1https://www.alamy.com/sketch-diagrams-charts-dot-bar-pie-graphs-infographics-set-doodle-vector-illustration-image471470172.html
RF2JB190C–Sketch diagrams charts dot bar pie graphs infographics set doodle vector illustration
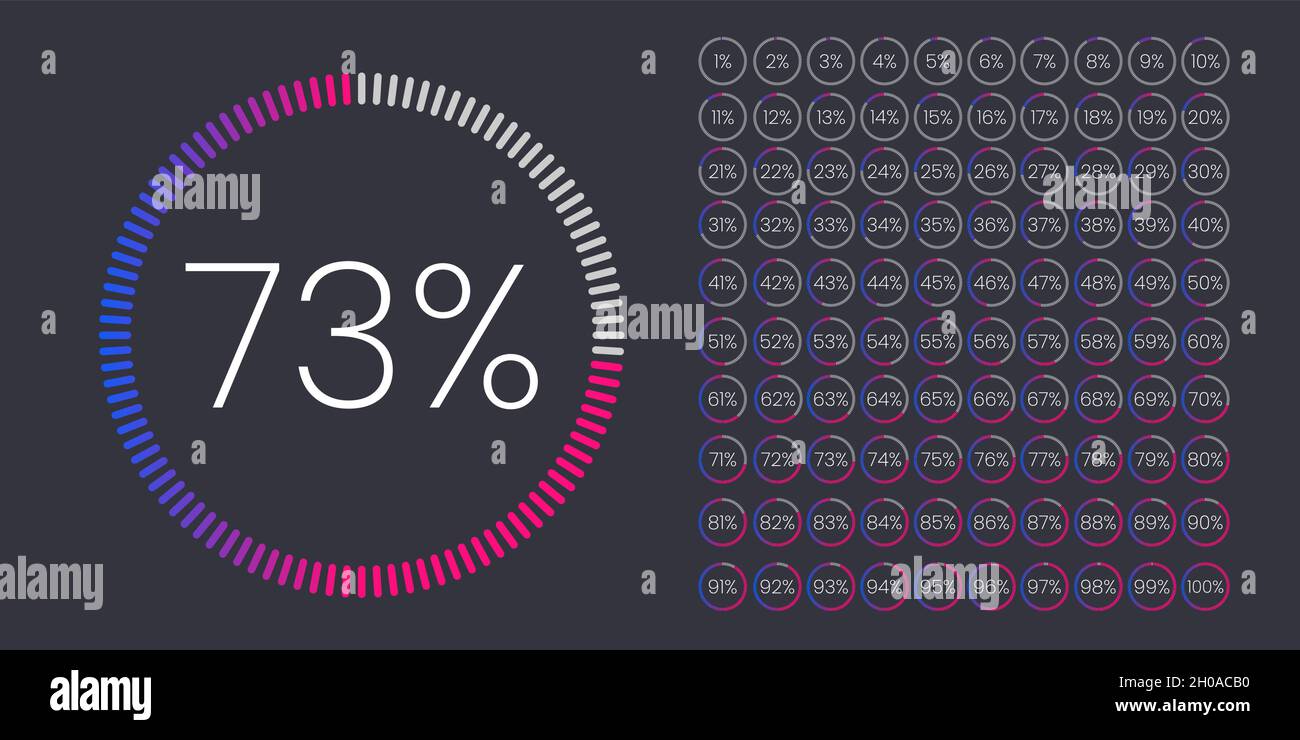 Set of Performance Indicators Percentage Circle from 0 to 100. Circle diagrams meter for web design. Pie Chart with Percentage Values for UX, user int Stock Vectorhttps://www.alamy.com/image-license-details/?v=1https://www.alamy.com/set-of-performance-indicators-percentage-circle-from-0-to-100-circle-diagrams-meter-for-web-design-pie-chart-with-percentage-values-for-ux-user-int-image447698804.html
RF2H0ACB0–Set of Performance Indicators Percentage Circle from 0 to 100. Circle diagrams meter for web design. Pie Chart with Percentage Values for UX, user int
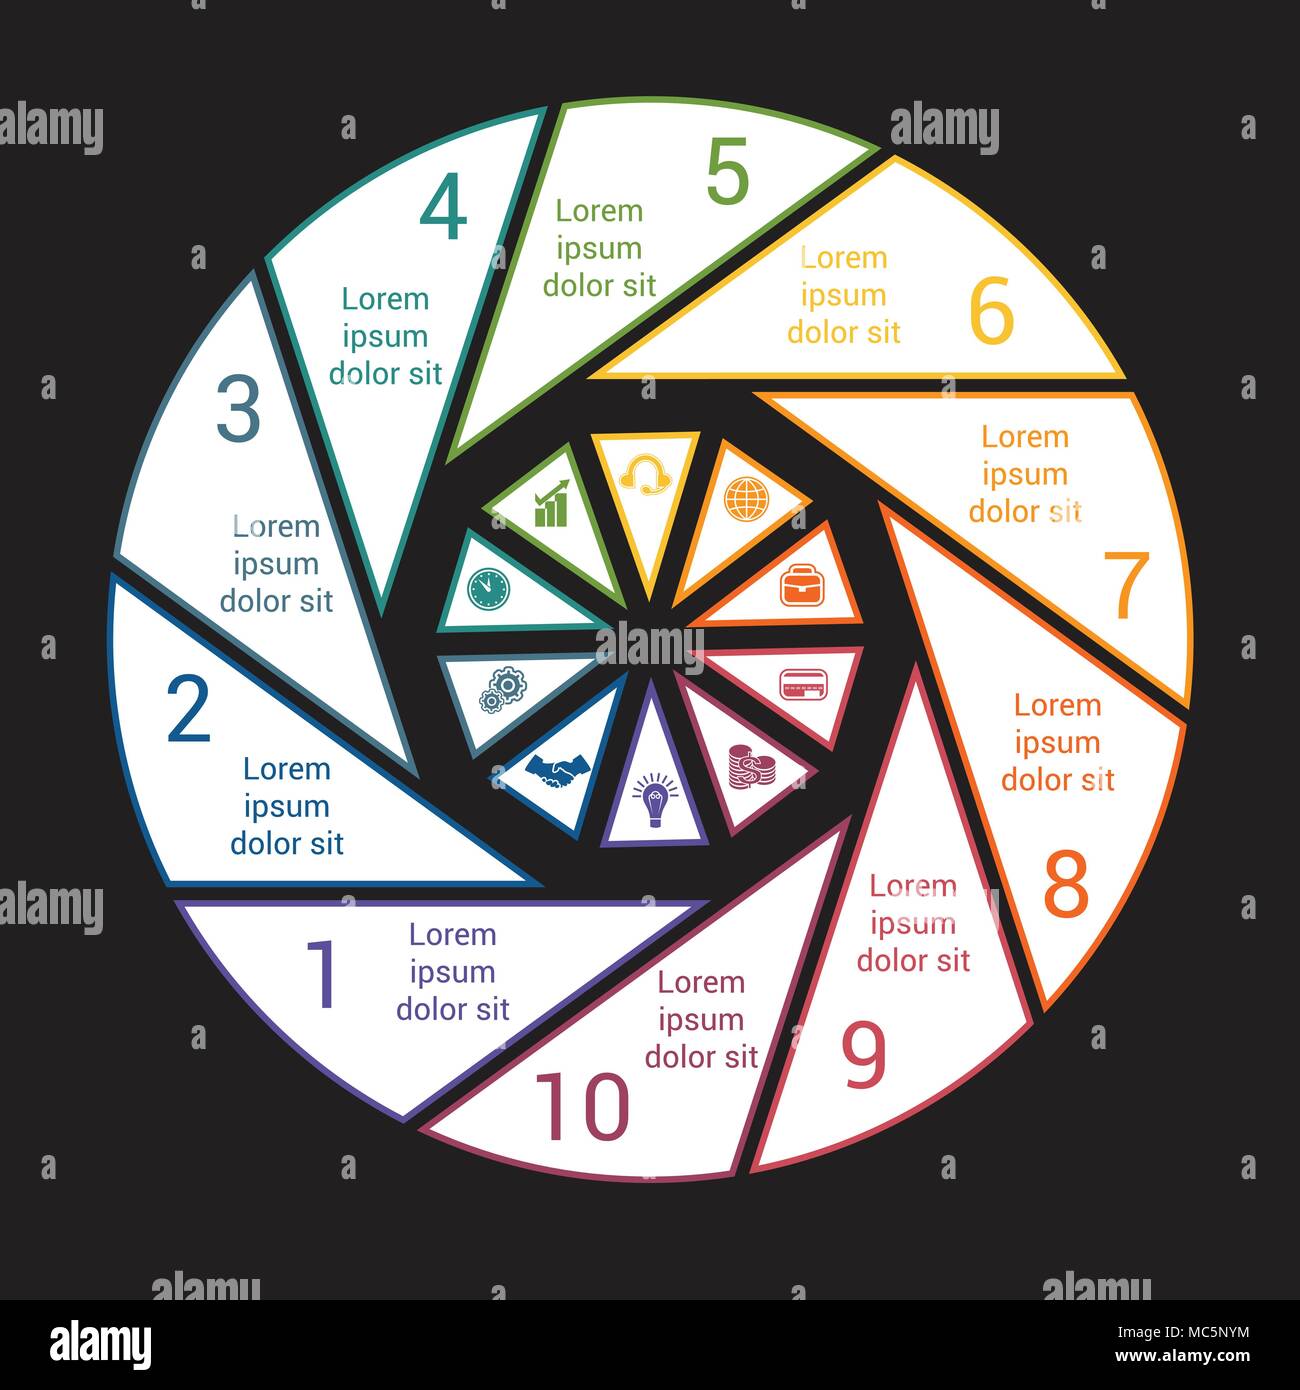 Pie chart with black background from colored lines for 10 options. Template Infographics for business projects, workflow, cycle processes, diagrams, Stock Vectorhttps://www.alamy.com/image-license-details/?v=1https://www.alamy.com/pie-chart-with-black-background-from-colored-lines-for-10-options-template-infographics-for-business-projects-workflow-cycle-processes-diagrams-image179606552.html
RFMC5NYM–Pie chart with black background from colored lines for 10 options. Template Infographics for business projects, workflow, cycle processes, diagrams,
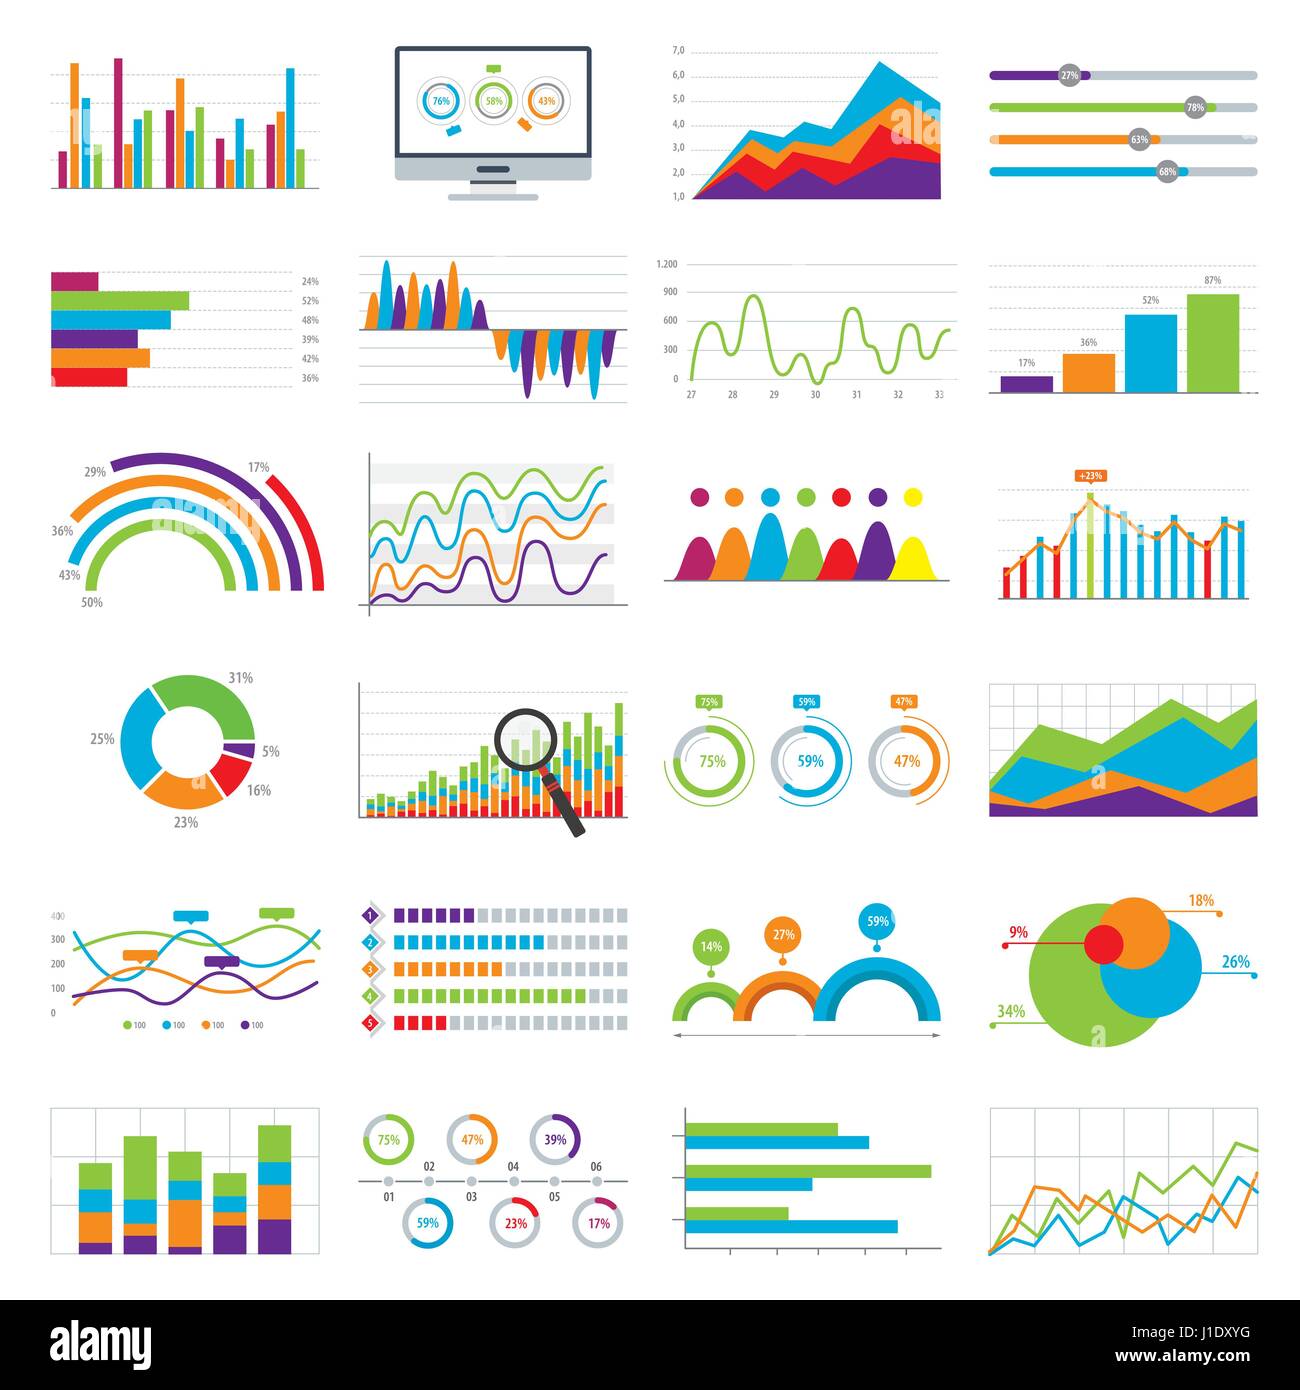 Business data market elements bar pie charts diagrams and graphs flat icons in vector illustration. Stock Vectorhttps://www.alamy.com/image-license-details/?v=1https://www.alamy.com/stock-photo-business-data-market-elements-bar-pie-charts-diagrams-and-graphs-flat-138604132.html
RFJ1DXYG–Business data market elements bar pie charts diagrams and graphs flat icons in vector illustration.
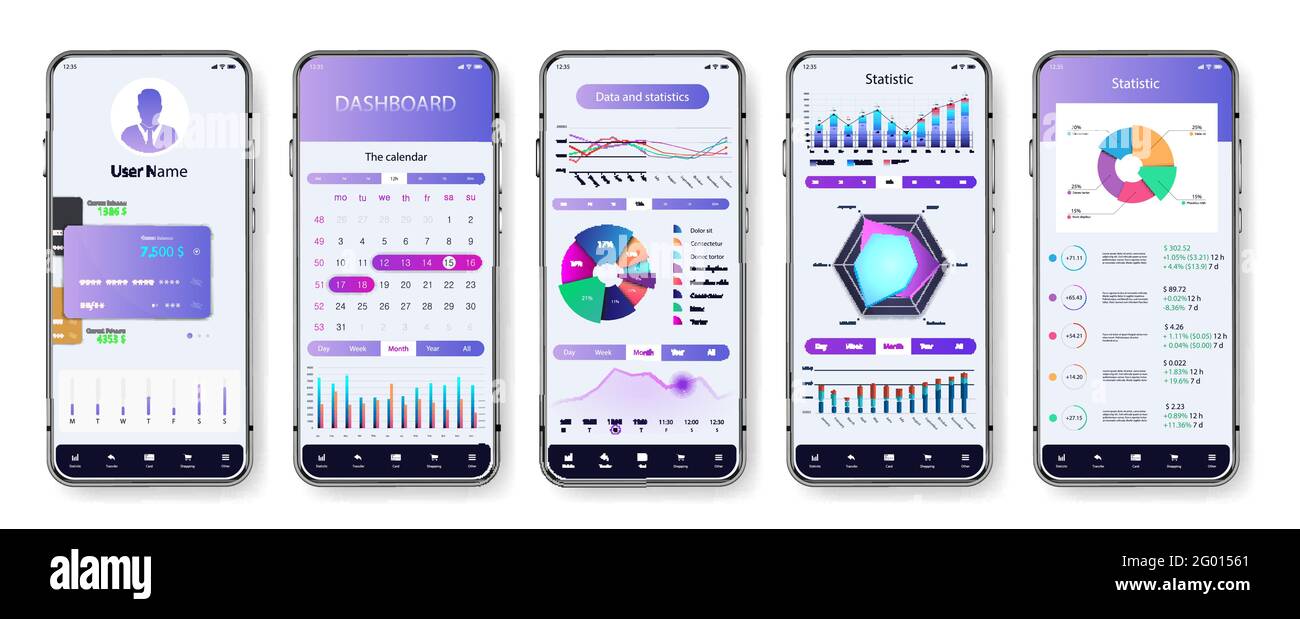 Light application interface for mobile phone. UI screens with dashboard, pie charts, infographics, diagrams and statistic. App mockup with investment Stock Vectorhttps://www.alamy.com/image-license-details/?v=1https://www.alamy.com/light-application-interface-for-mobile-phone-ui-screens-with-dashboard-pie-charts-infographics-diagrams-and-statistic-app-mockup-with-investment-image430285241.html
RF2G01561–Light application interface for mobile phone. UI screens with dashboard, pie charts, infographics, diagrams and statistic. App mockup with investment
RF2TBN6D4–Dot bar pie charts, business data market elements, graphs, and flat icons set. Suitable for infographics, numbered banners, diagrams, and graphic or
 Puzzle pie diagrams. Modern people infographics. Flat vector illustration isolated on violet background. Stock Vectorhttps://www.alamy.com/image-license-details/?v=1https://www.alamy.com/puzzle-pie-diagrams-modern-people-infographics-flat-vector-illustration-isolated-on-violet-background-image560587644.html
RF2RG0Y78–Puzzle pie diagrams. Modern people infographics. Flat vector illustration isolated on violet background.
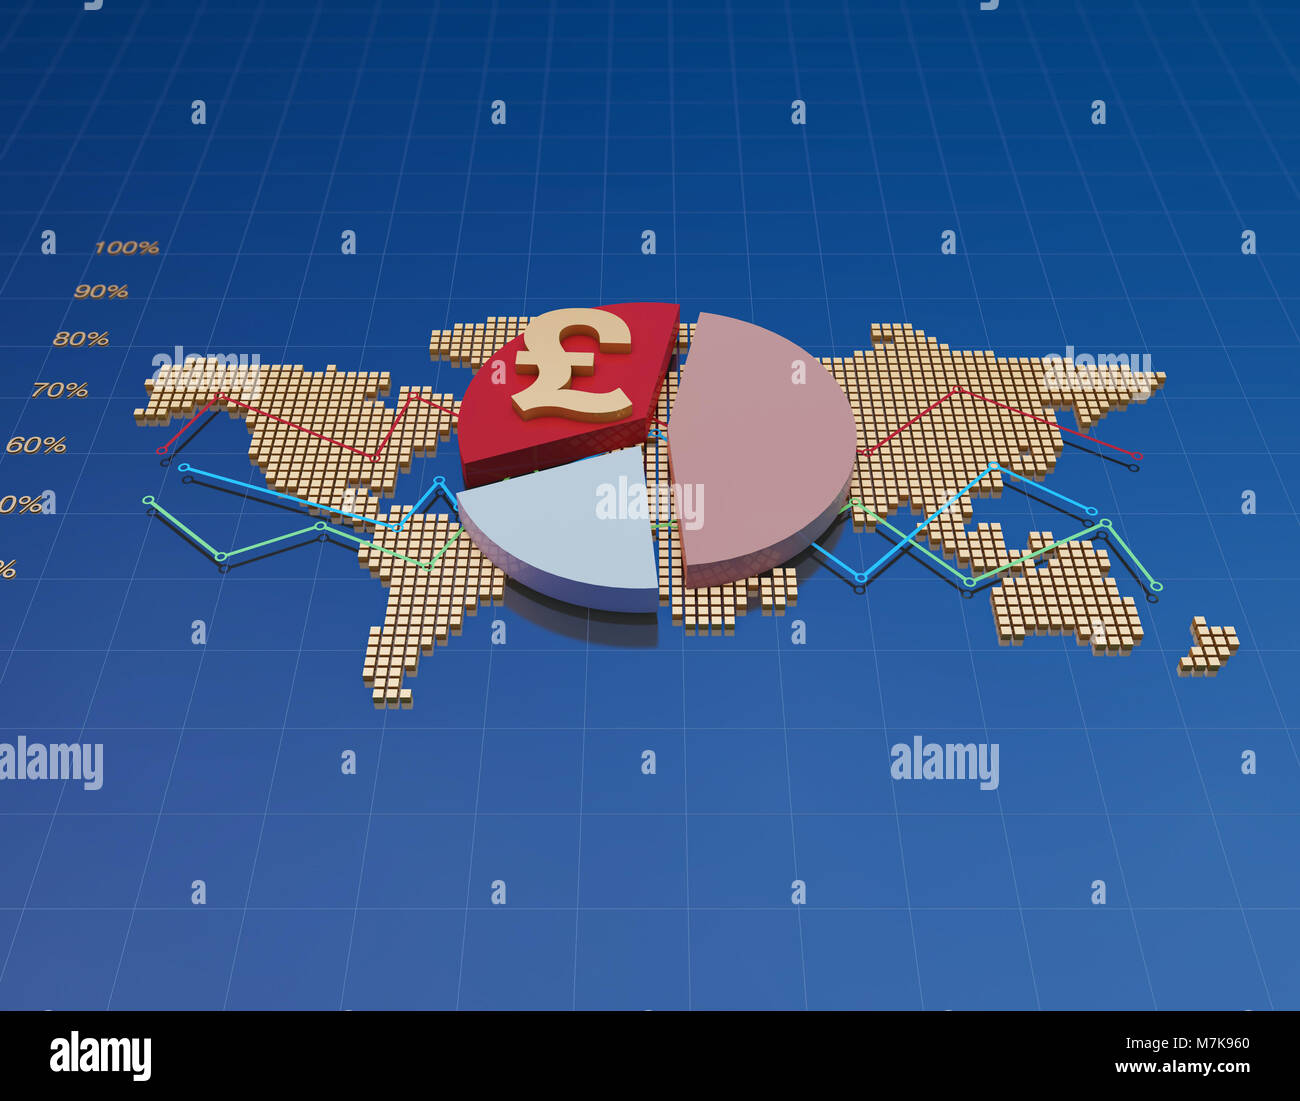 Financial Economic Statistics, Capital Expansion, World Map and Pie Chart Currency Symbols Stock Photohttps://www.alamy.com/image-license-details/?v=1https://www.alamy.com/stock-photo-financial-economic-statistics-capital-expansion-world-map-and-pie-176830584.html
RFM7K960–Financial Economic Statistics, Capital Expansion, World Map and Pie Chart Currency Symbols
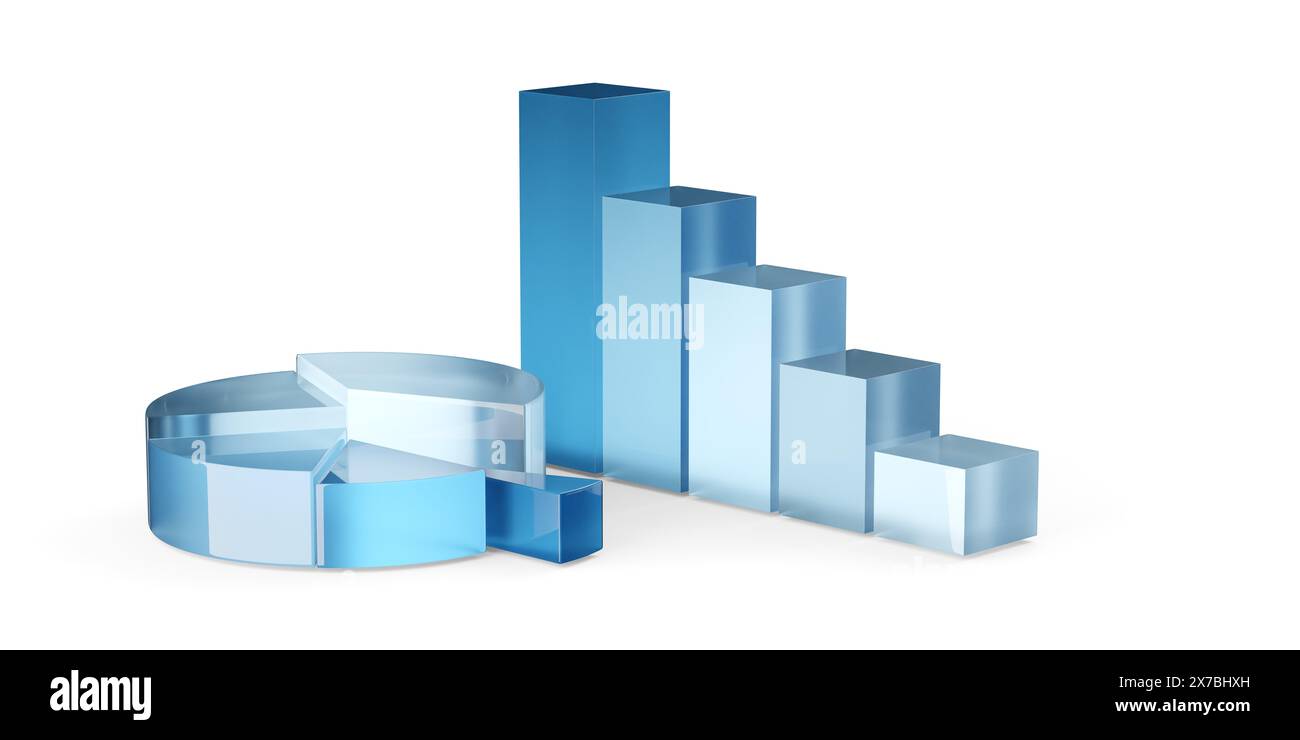 Blue transparent pie chart and bar graph business diagrams over white background, financial growth, statistics or investment graph concept, 3D illustr Stock Photohttps://www.alamy.com/image-license-details/?v=1https://www.alamy.com/blue-transparent-pie-chart-and-bar-graph-business-diagrams-over-white-background-financial-growth-statistics-or-investment-graph-concept-3d-illustr-image606921017.html
RF2X7BHXH–Blue transparent pie chart and bar graph business diagrams over white background, financial growth, statistics or investment graph concept, 3D illustr
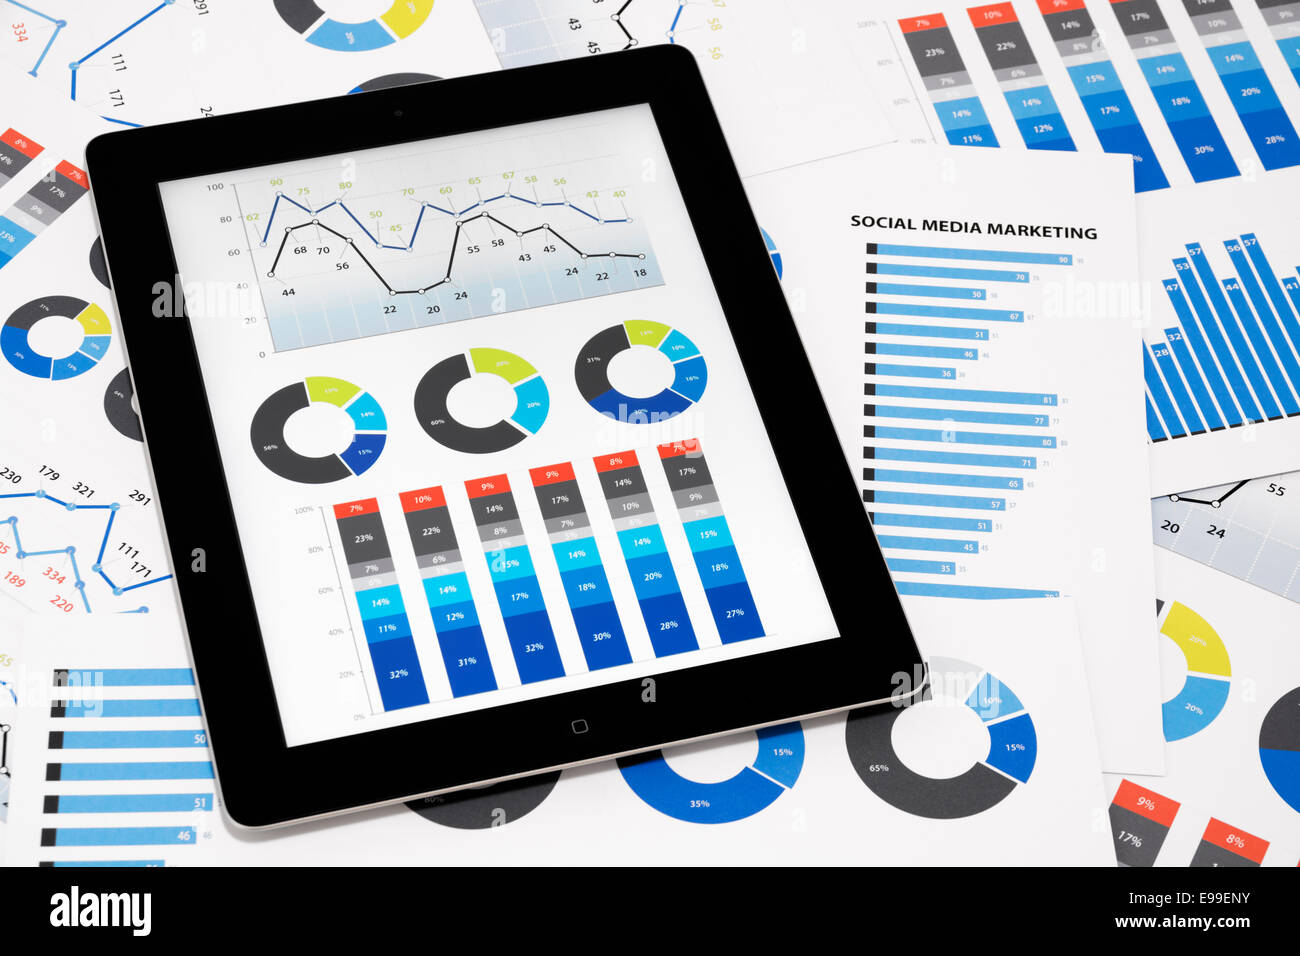 Business charts and diagrams on digital tablet. Stock Photohttps://www.alamy.com/image-license-details/?v=1https://www.alamy.com/stock-photo-business-charts-and-diagrams-on-digital-tablet-74582535.html
RFE99ENY–Business charts and diagrams on digital tablet.
RF2WGBHJ0–Set of icon for infographic. Big percent collection for user interface UI or business infographic. Percentage circle diagrams from 0 to 100. Black and
RF2TAYBC3–Business data graphs stickers icons. Financial and marketing charts stickers. Market elements dot bar pie charts diagrams and graphs. Business
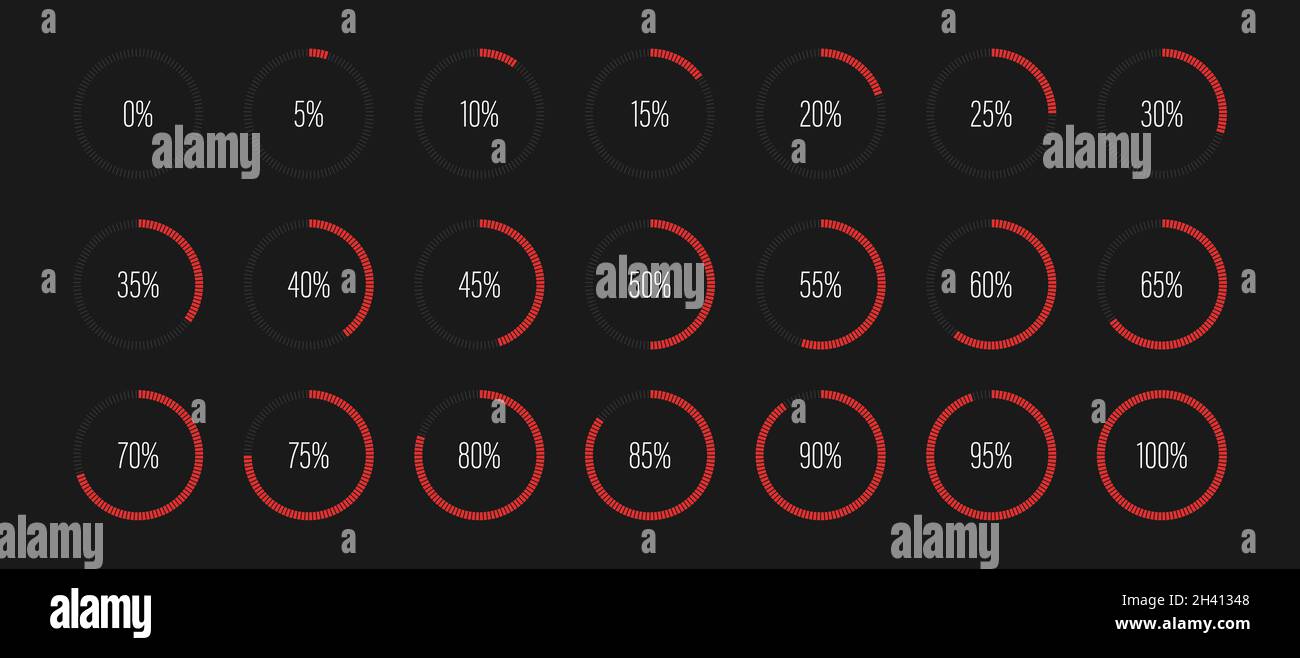 Set of circle percentage diagrams meters for web design, user interface UI or infographic - indicator with red Stock Vectorhttps://www.alamy.com/image-license-details/?v=1https://www.alamy.com/set-of-circle-percentage-diagrams-meters-for-web-design-user-interface-ui-or-infographic-indicator-with-red-image449952616.html
RF2H41348–Set of circle percentage diagrams meters for web design, user interface UI or infographic - indicator with red
 Website analysis. SEO reports analytics. Pie charts, diagrams, computer monitor screen. Business and financial analyst annual presentation. Vector iso Stock Vectorhttps://www.alamy.com/image-license-details/?v=1https://www.alamy.com/website-analysis-seo-reports-analytics-pie-charts-diagrams-computer-monitor-screen-business-and-financial-analyst-annual-presentation-vector-iso-image467049368.html
RF2J3RX6G–Website analysis. SEO reports analytics. Pie charts, diagrams, computer monitor screen. Business and financial analyst annual presentation. Vector iso
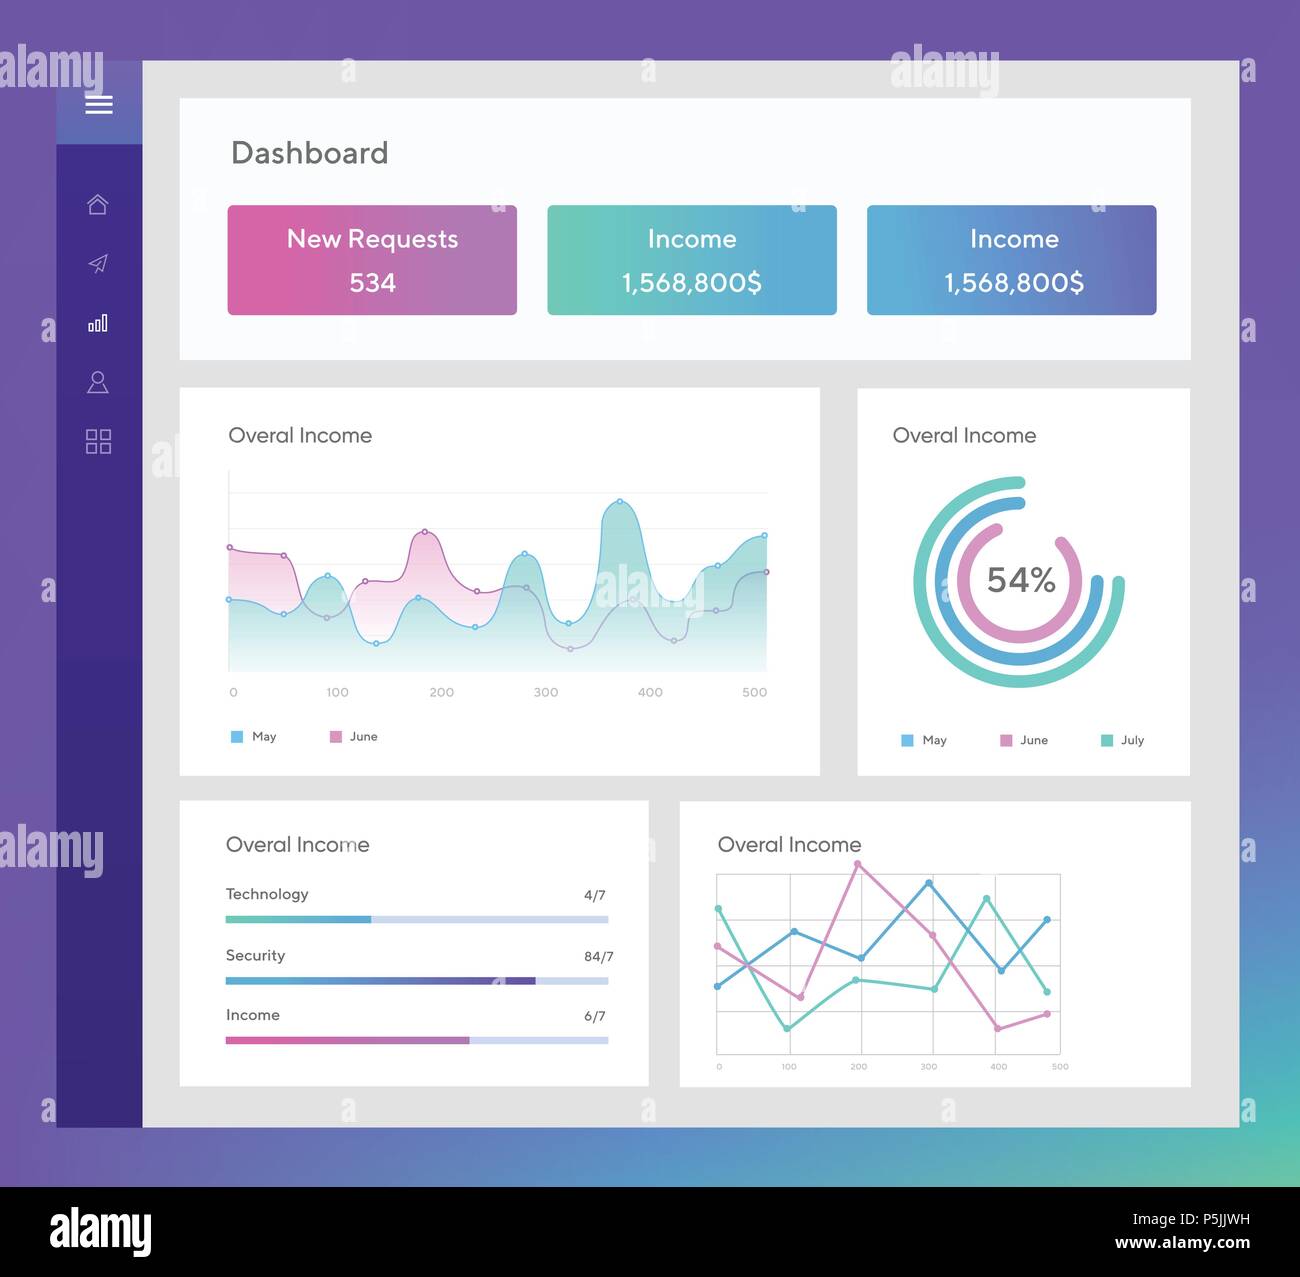 Infographic template with flat design daily statistics graphs, dashboard, pie charts, web design, UI elements. Network management data screen with charts and diagrams Stock Vectorhttps://www.alamy.com/image-license-details/?v=1https://www.alamy.com/infographic-template-with-flat-design-daily-statistics-graphs-dashboard-pie-charts-web-design-ui-elements-network-management-data-screen-with-charts-and-diagrams-image210007661.html
RFP5JJWH–Infographic template with flat design daily statistics graphs, dashboard, pie charts, web design, UI elements. Network management data screen with charts and diagrams
 Chart pie circular diagrams with options. Vector marketing graphs, infochart collection. Round chart template for presentation business diagram strate Stock Vectorhttps://www.alamy.com/image-license-details/?v=1https://www.alamy.com/chart-pie-circular-diagrams-with-options-vector-marketing-graphs-infochart-collection-round-chart-template-for-presentation-business-diagram-strate-image354102561.html
RF2BG2NC1–Chart pie circular diagrams with options. Vector marketing graphs, infochart collection. Round chart template for presentation business diagram strate
 Woman standing on ladder and holds a piece of pie chart and collects them isometric vector illustration isolated on white background Stock Vectorhttps://www.alamy.com/image-license-details/?v=1https://www.alamy.com/woman-standing-on-ladder-and-holds-a-piece-of-pie-chart-and-collects-them-isometric-vector-illustration-isolated-on-white-background-image256596678.html
RFTWCYK2–Woman standing on ladder and holds a piece of pie chart and collects them isometric vector illustration isolated on white background