Section report Cut Out Stock Images
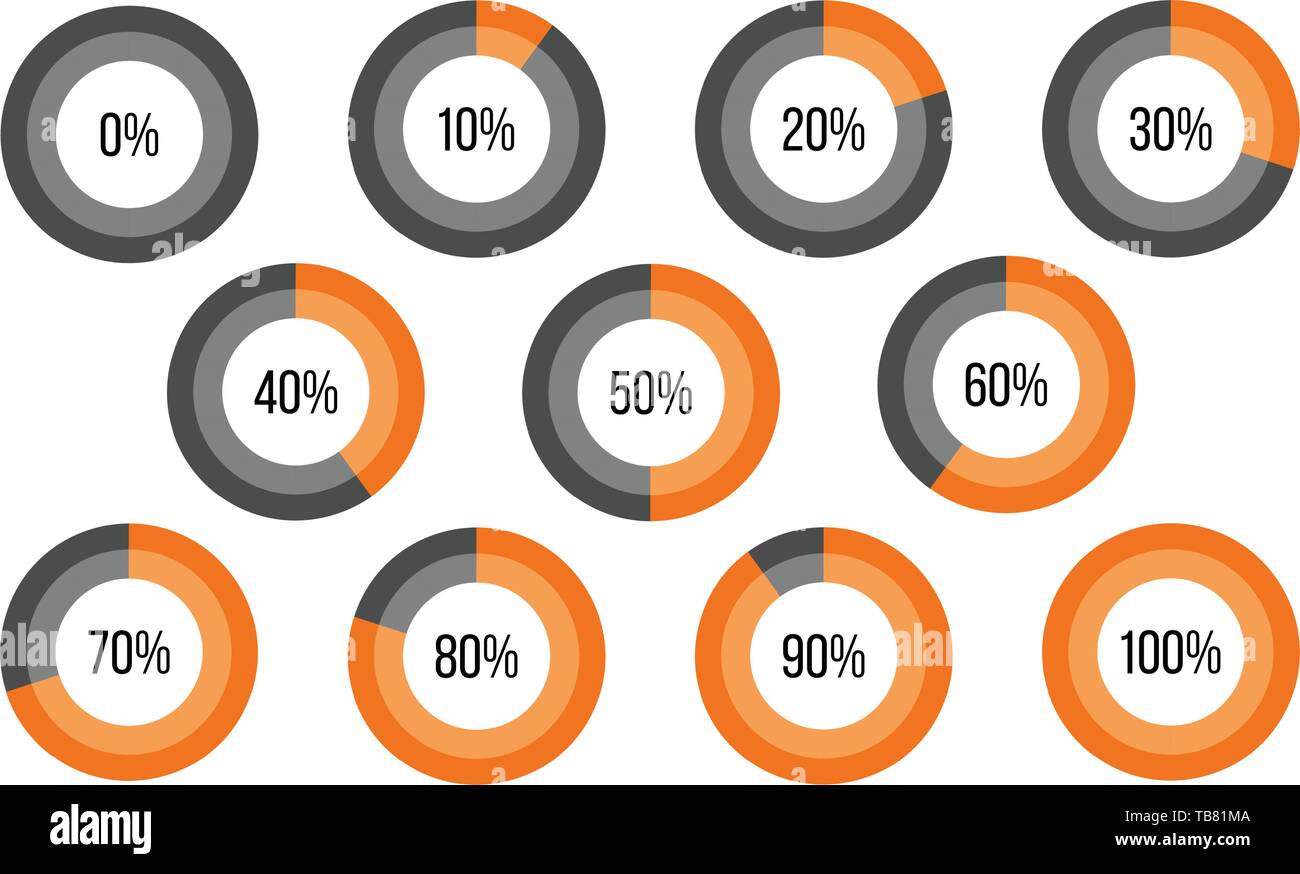 Circle percent Diagram Pie Charts Infographic Elements. Progress Wheel. Vector illustration isolated Stock Vectorhttps://www.alamy.com/image-license-details/?v=1https://www.alamy.com/circle-percent-diagram-pie-charts-infographic-elements-progress-wheel-vector-illustration-isolated-image247883338.html
RFTB81MA–Circle percent Diagram Pie Charts Infographic Elements. Progress Wheel. Vector illustration isolated
 chart, cake, pie, cakes, report, diagram, result, graph, statistic, statistics, Stock Photohttps://www.alamy.com/image-license-details/?v=1https://www.alamy.com/stock-photo-chart-cake-pie-cakes-report-diagram-result-graph-statistic-statistics-144006021.html
RFJA8145–chart, cake, pie, cakes, report, diagram, result, graph, statistic, statistics,
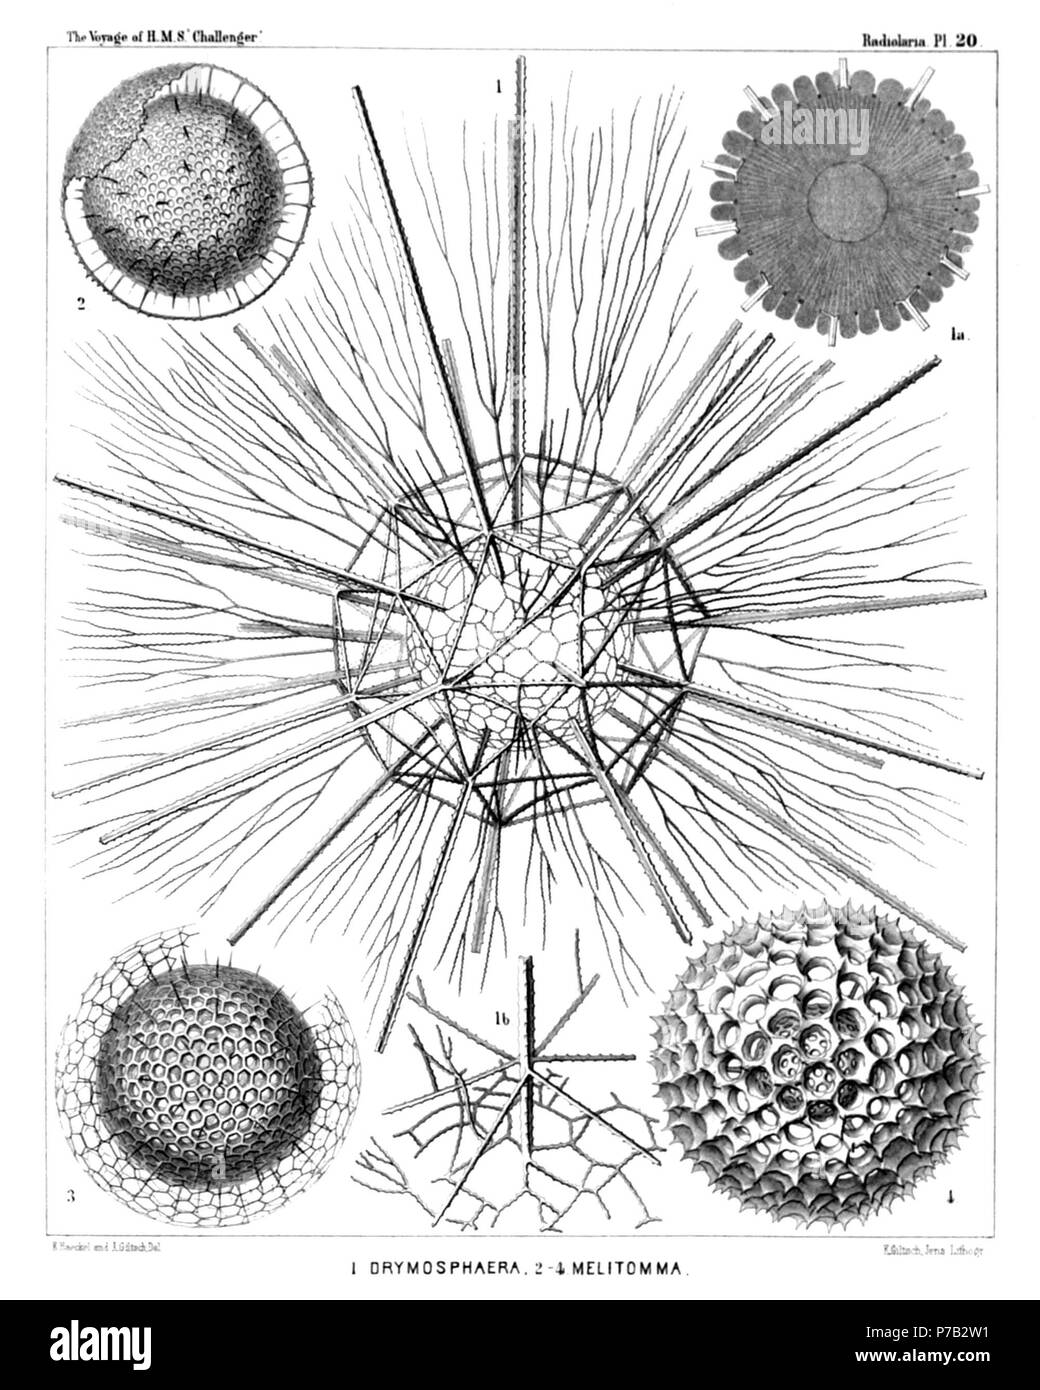 English: Illustration from Report on the Radiolaria collected by H.M.S. Challenger during the years 1873-1876. Part III. Original description follows: Plate 20. Liosphærida et Astrosphærida. Diam. Fig. 1. Drymosphæra dendrophora, n. sp., × 300 Fig. 1a. Meridional section through the central capsule. In the centre the large spherical nucleus is visible. The protoplasm around it is distinctly radiate. From the central capsule arise numerous club-shaped apophyses or cæcal sacs, which are protruded through the meshes of the inner shell, × 300 Fig. 1b. Basal part of a single radial spine, and Stock Photohttps://www.alamy.com/image-license-details/?v=1https://www.alamy.com/english-illustration-from-report-on-the-radiolaria-collected-by-hms-challenger-during-the-years-1873-1876-part-iii-original-description-follows-plate-20-liosphrida-et-astrosphrida-diam-fig-1-drymosphra-dendrophora-n-sp-300-fig-1a-meridional-section-through-the-central-capsule-in-the-centre-the-large-spherical-nucleus-is-visible-the-protoplasm-around-it-is-distinctly-radiate-from-the-central-capsule-arise-numerous-club-shaped-apophyses-or-ccal-sacs-which-are-protruded-through-the-meshes-of-the-inner-shell-300-fig-1b-basal-part-of-a-single-radial-spine-and-image211070749.html
RMP7B2W1–English: Illustration from Report on the Radiolaria collected by H.M.S. Challenger during the years 1873-1876. Part III. Original description follows: Plate 20. Liosphærida et Astrosphærida. Diam. Fig. 1. Drymosphæra dendrophora, n. sp., × 300 Fig. 1a. Meridional section through the central capsule. In the centre the large spherical nucleus is visible. The protoplasm around it is distinctly radiate. From the central capsule arise numerous club-shaped apophyses or cæcal sacs, which are protruded through the meshes of the inner shell, × 300 Fig. 1b. Basal part of a single radial spine, and
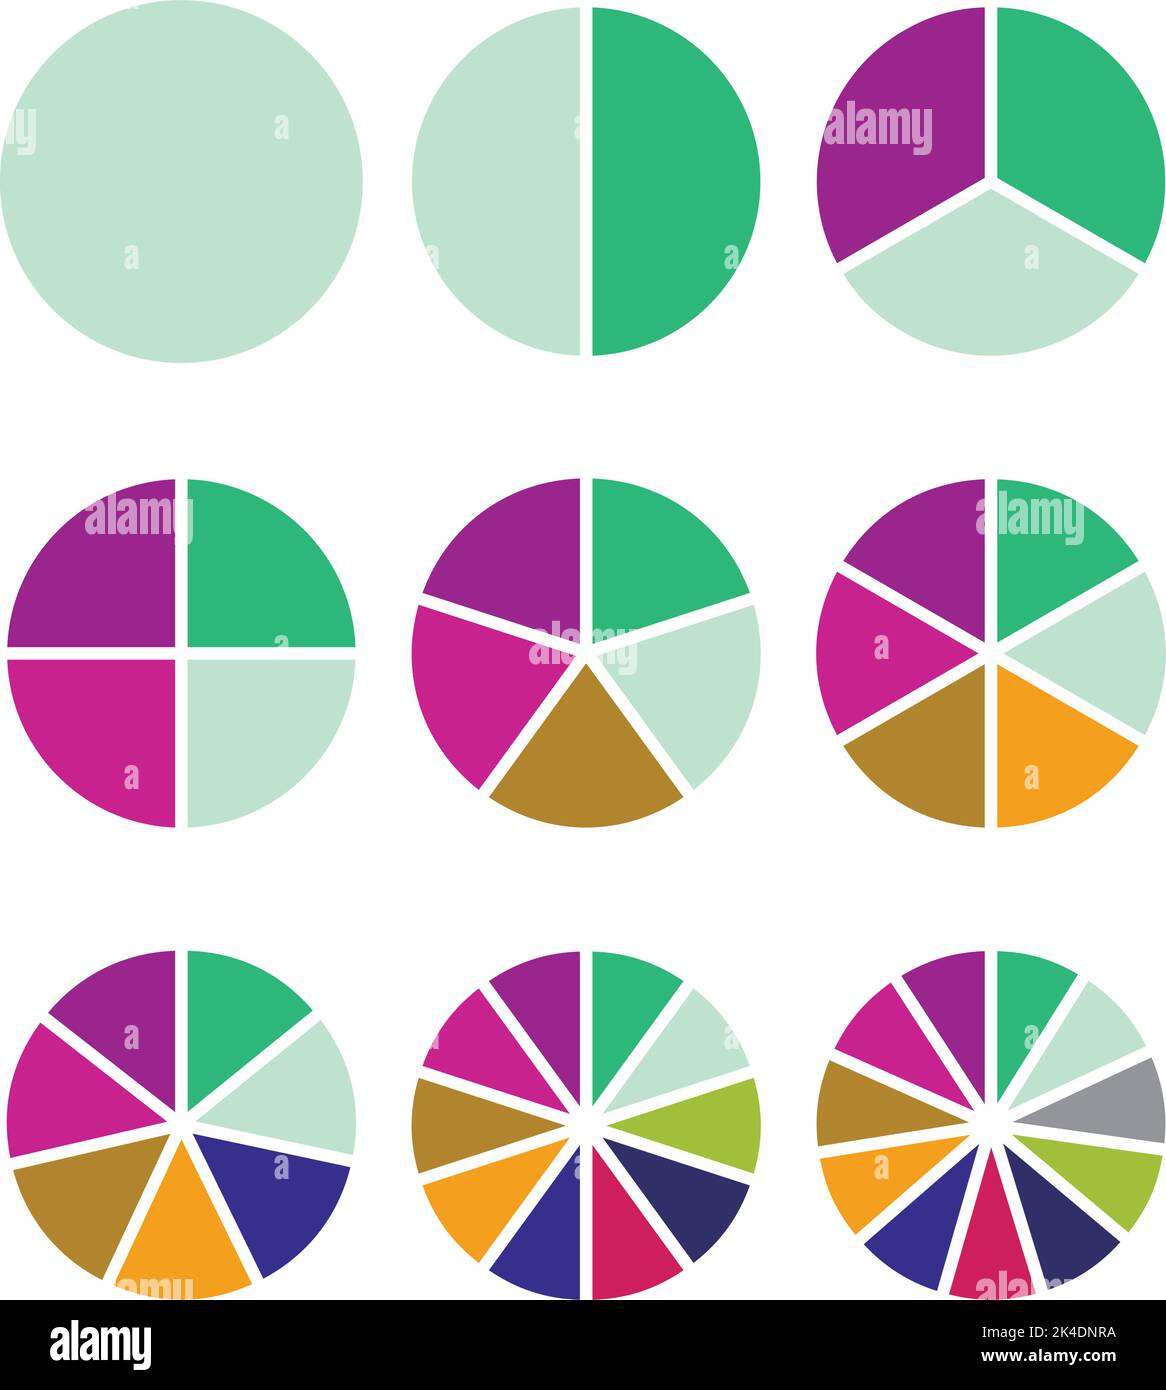 Pie charts set, part segment, infographic template for business report. Vector illustration. Pie element presentation, business diagram set, circular Stock Vectorhttps://www.alamy.com/image-license-details/?v=1https://www.alamy.com/pie-charts-set-part-segment-infographic-template-for-business-report-vector-illustration-pie-element-presentation-business-diagram-set-circular-image484651422.html
RF2K4DNRA–Pie charts set, part segment, infographic template for business report. Vector illustration. Pie element presentation, business diagram set, circular
 Newsgirl about 11 years old, with a single paper making a begging and sight seeing trip through the business section. See California report. Stock Photohttps://www.alamy.com/image-license-details/?v=1https://www.alamy.com/newsgirl-about-11-years-old-with-a-single-paper-making-a-begging-and-sight-seeing-trip-through-the-business-section-see-california-report-image328043053.html
RM2A1KJ79–Newsgirl about 11 years old, with a single paper making a begging and sight seeing trip through the business section. See California report.
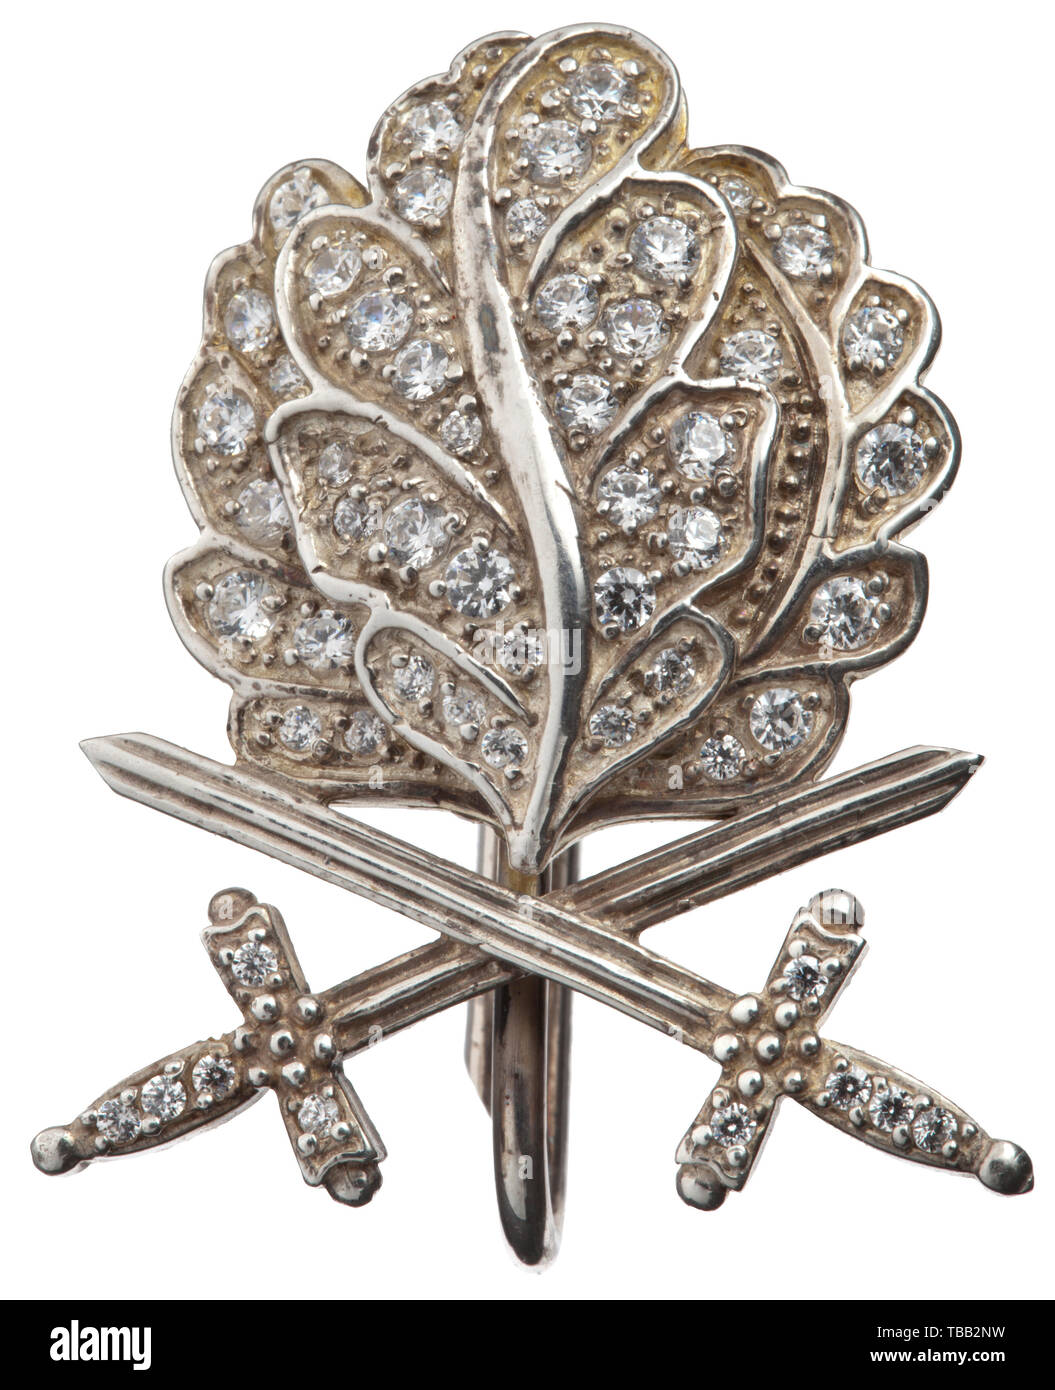 Oak Leaves with Swords and Diamonds to the Knight's Cross of the Iron Cross Mid-1980s collector's production with accompanying sales contract for the 'Brilliants' dated 5 June 1950 between Heinz Schnaufer and the purchaser at that time, together with a photo expert report of Dr. Klietmann regarding the 'Brilliants' dated 19 July 1985 certifying that this is a contemporary original of a so-called 'B-Piece'. The construction and 'K 935' punch mark is modelled on the original pieces made by the Klein firm in Hanau. Cased, with a section of ribbon. Width of the Oak Leaves 22 mm, Editorial-Use-Only Stock Photohttps://www.alamy.com/image-license-details/?v=1https://www.alamy.com/oak-leaves-with-swords-and-diamonds-to-the-knights-cross-of-the-iron-cross-mid-1980s-collectors-production-with-accompanying-sales-contract-for-the-brilliants-dated-5-june-1950-between-heinz-schnaufer-and-the-purchaser-at-that-time-together-with-a-photo-expert-report-of-dr-klietmann-regarding-the-brilliants-dated-19-july-1985-certifying-that-this-is-a-contemporary-original-of-a-so-called-b-piece-the-construction-and-k-935-punch-mark-is-modelled-on-the-original-pieces-made-by-the-klein-firm-in-hanau-cased-with-a-section-of-ribbon-width-of-the-oak-leaves-22-mm-editorial-use-only-image247950021.html
RMTBB2NW–Oak Leaves with Swords and Diamonds to the Knight's Cross of the Iron Cross Mid-1980s collector's production with accompanying sales contract for the 'Brilliants' dated 5 June 1950 between Heinz Schnaufer and the purchaser at that time, together with a photo expert report of Dr. Klietmann regarding the 'Brilliants' dated 19 July 1985 certifying that this is a contemporary original of a so-called 'B-Piece'. The construction and 'K 935' punch mark is modelled on the original pieces made by the Klein firm in Hanau. Cased, with a section of ribbon. Width of the Oak Leaves 22 mm, Editorial-Use-Only
 Wooden mannequin writing in a scrapbook - Free section Stock Photohttps://www.alamy.com/image-license-details/?v=1https://www.alamy.com/stock-photo-wooden-mannequin-writing-in-a-scrapbook-free-section-84264061.html
RFEW2FJN–Wooden mannequin writing in a scrapbook - Free section
RF2WXTD98–Set of Megaphone, Timer app and Report line icons for web app. Pictogram icon Vector
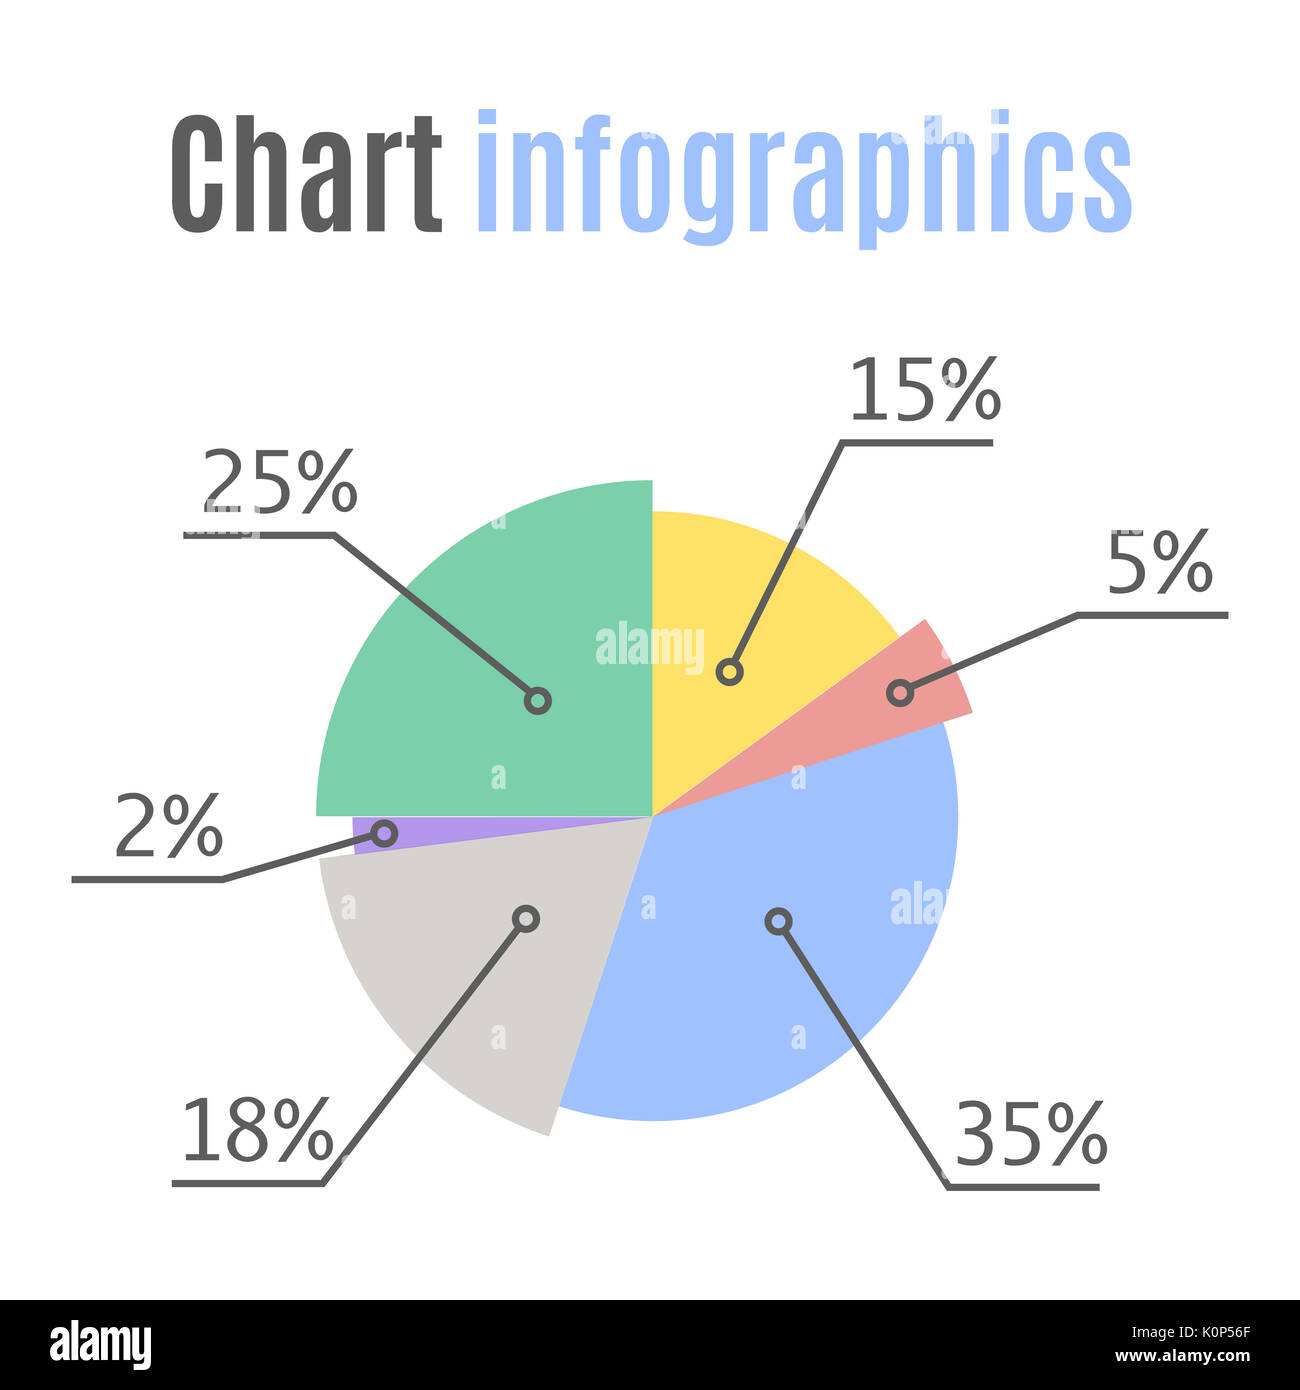 Pie chart statistic concept. Business flow process diagram. Infographic elements for presentation. Percentage infographics. Stock Photohttps://www.alamy.com/image-license-details/?v=1https://www.alamy.com/pie-chart-statistic-concept-business-flow-process-diagram-infographic-image155380359.html
RFK0P56F–Pie chart statistic concept. Business flow process diagram. Infographic elements for presentation. Percentage infographics.
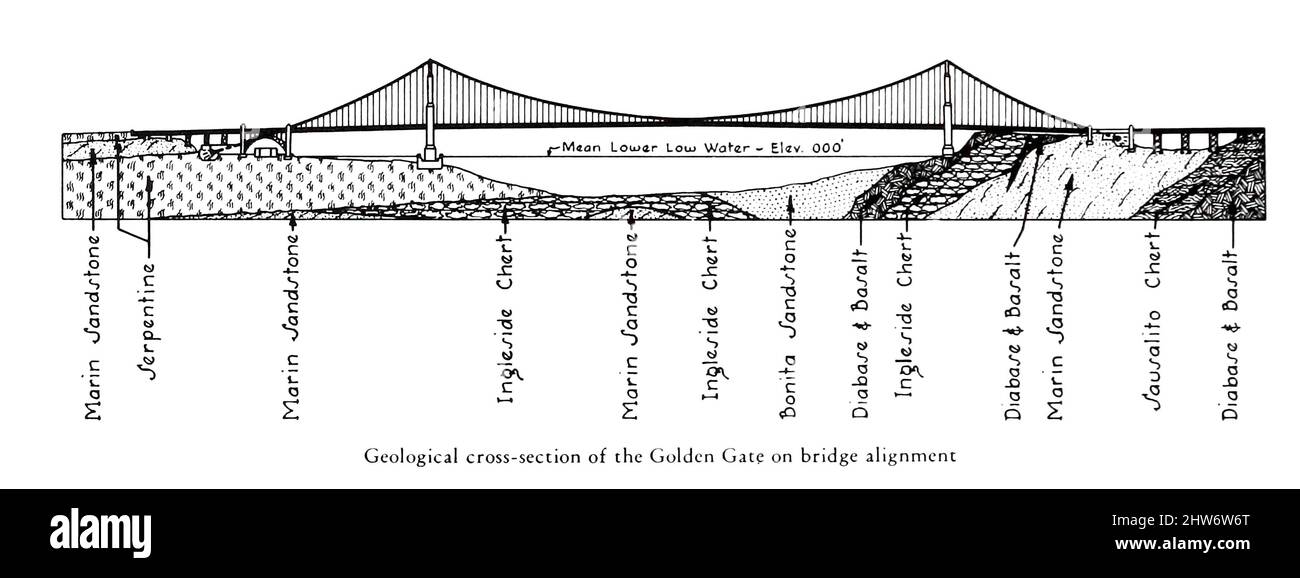 Geological Cross-Section of the Golden Gate on Bridge Alignment from The Golden Gate Bridge; report of the Chief Engineer to the Board of Directors of the Golden Gate Bridge and Highway District, California, September, 1937 Stock Photohttps://www.alamy.com/image-license-details/?v=1https://www.alamy.com/geological-cross-section-of-the-golden-gate-on-bridge-alignment-from-the-golden-gate-bridge-report-of-the-chief-engineer-to-the-board-of-directors-of-the-golden-gate-bridge-and-highway-district-california-september-1937-image462987472.html
RF2HW6W6T–Geological Cross-Section of the Golden Gate on Bridge Alignment from The Golden Gate Bridge; report of the Chief Engineer to the Board of Directors of the Golden Gate Bridge and Highway District, California, September, 1937
 Vector web template. Layout workflow. Outline colorful menu for app interface. Number options. Web design elements for infographics. Stock Vectorhttps://www.alamy.com/image-license-details/?v=1https://www.alamy.com/vector-web-template-layout-workflow-outline-colorful-menu-for-app-interface-number-options-web-design-elements-for-infographics-image333026809.html
RF2A9PK2H–Vector web template. Layout workflow. Outline colorful menu for app interface. Number options. Web design elements for infographics.
 Newsgirl about 11 years old, with a single paper making a begging and sight seeing trip through the business section. See California report. Stock Photohttps://www.alamy.com/image-license-details/?v=1https://www.alamy.com/newsgirl-about-11-years-old-with-a-single-paper-making-a-begging-and-sight-seeing-trip-through-the-business-section-see-california-report-image402258373.html
RM2EACCJD–Newsgirl about 11 years old, with a single paper making a begging and sight seeing trip through the business section. See California report.
RF2X99977–Chart pie level podium section business accounting statistic management report 3d icon realistic vector illustration. Round diagram with part segment
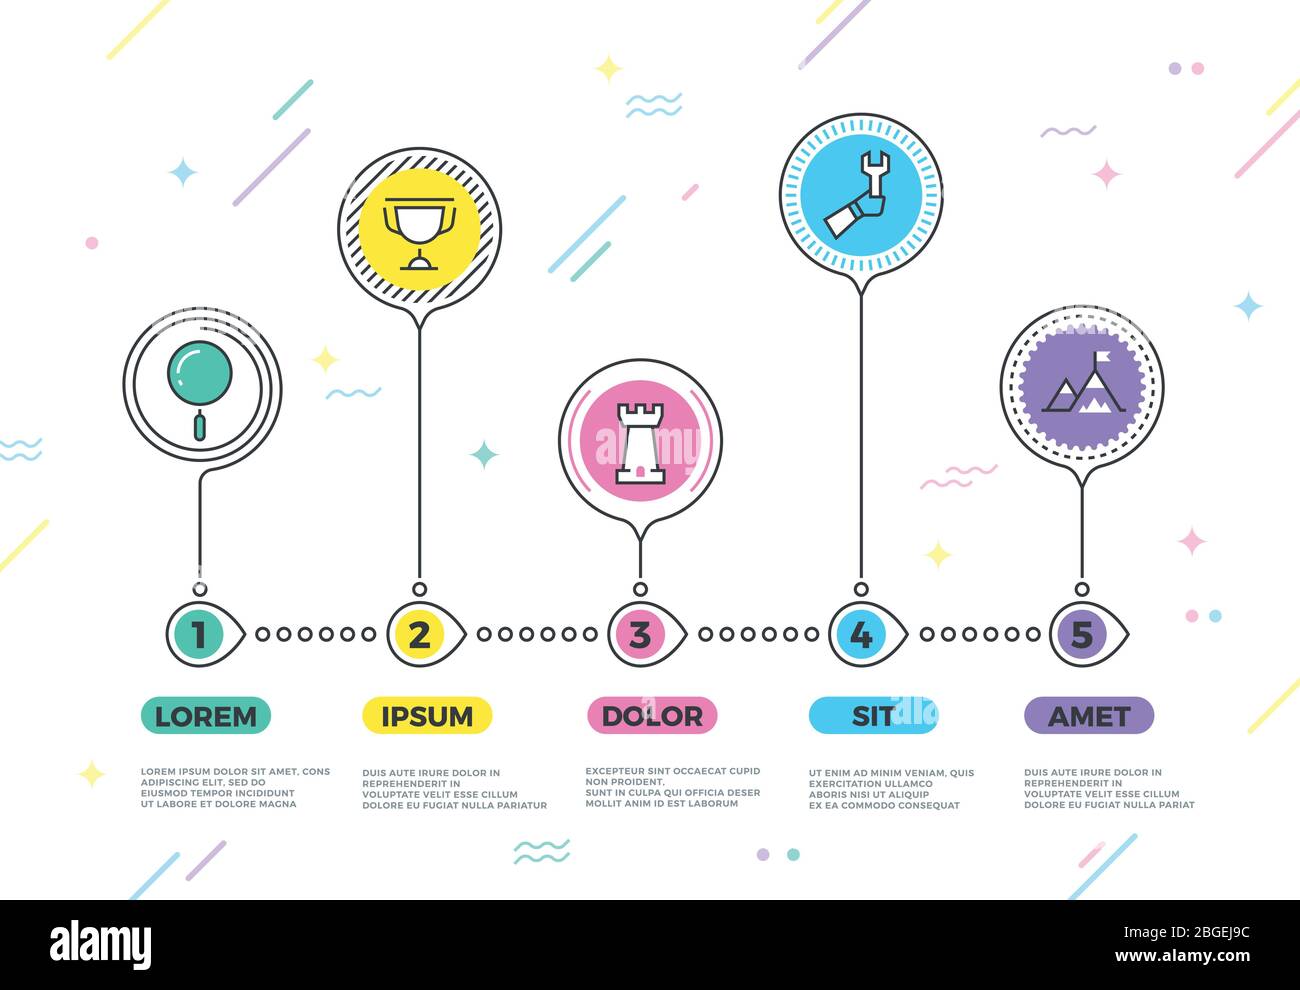 Process vector business infographic with strategy steps for company planner. Step layout timeline, progress graph and strategy presentation illustration Stock Vectorhttps://www.alamy.com/image-license-details/?v=1https://www.alamy.com/process-vector-business-infographic-with-strategy-steps-for-company-planner-step-layout-timeline-progress-graph-and-strategy-presentation-illustration-image354363560.html
RF2BGEJ9C–Process vector business infographic with strategy steps for company planner. Step layout timeline, progress graph and strategy presentation illustration
 Set of circular sector percentage diagrams from 0 to 100 ready-to-use for web design, user interface (UI) or infographic - indicator with pink Stock Vectorhttps://www.alamy.com/image-license-details/?v=1https://www.alamy.com/set-of-circular-sector-percentage-diagrams-from-0-to-100-ready-to-image159099037.html
RFK6RGCD–Set of circular sector percentage diagrams from 0 to 100 ready-to-use for web design, user interface (UI) or infographic - indicator with pink
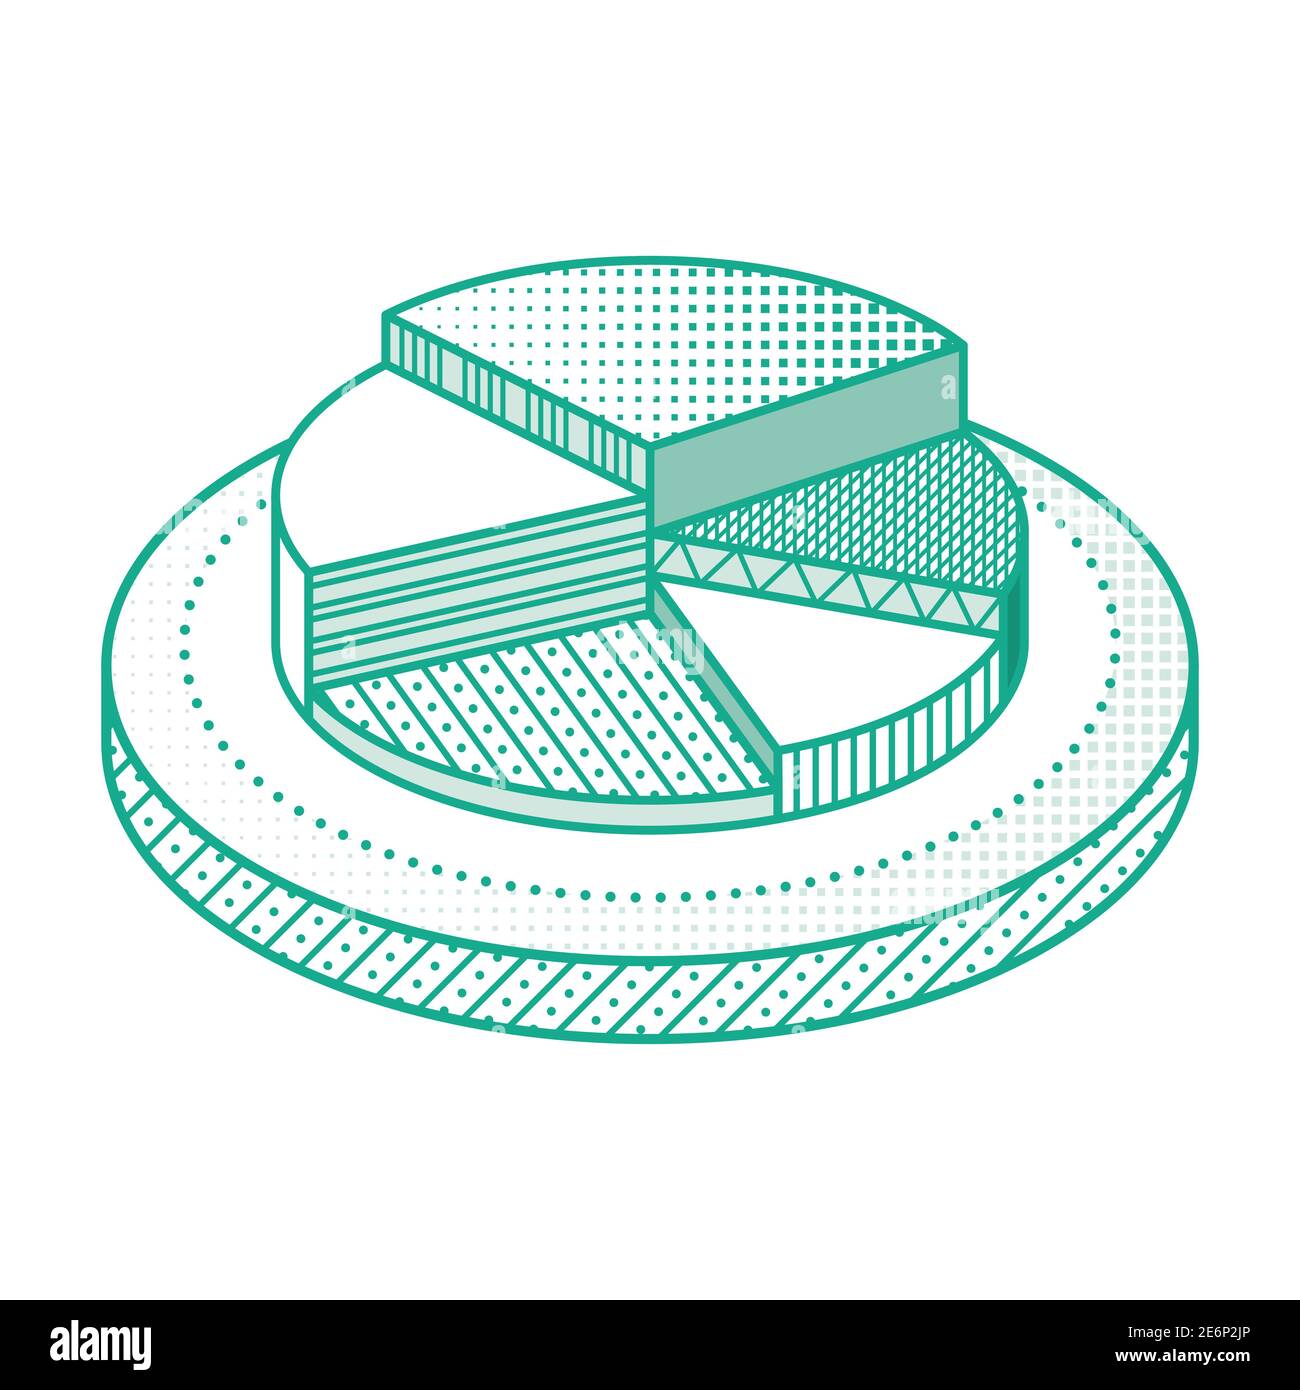 Outline Pie Chart Infographic Element. Isometric Pie Diagram Isolated on White. Vector Illustration. Stock Vectorhttps://www.alamy.com/image-license-details/?v=1https://www.alamy.com/outline-pie-chart-infographic-element-isometric-pie-diagram-isolated-on-white-vector-illustration-image400011438.html
RF2E6P2JP–Outline Pie Chart Infographic Element. Isometric Pie Diagram Isolated on White. Vector Illustration.
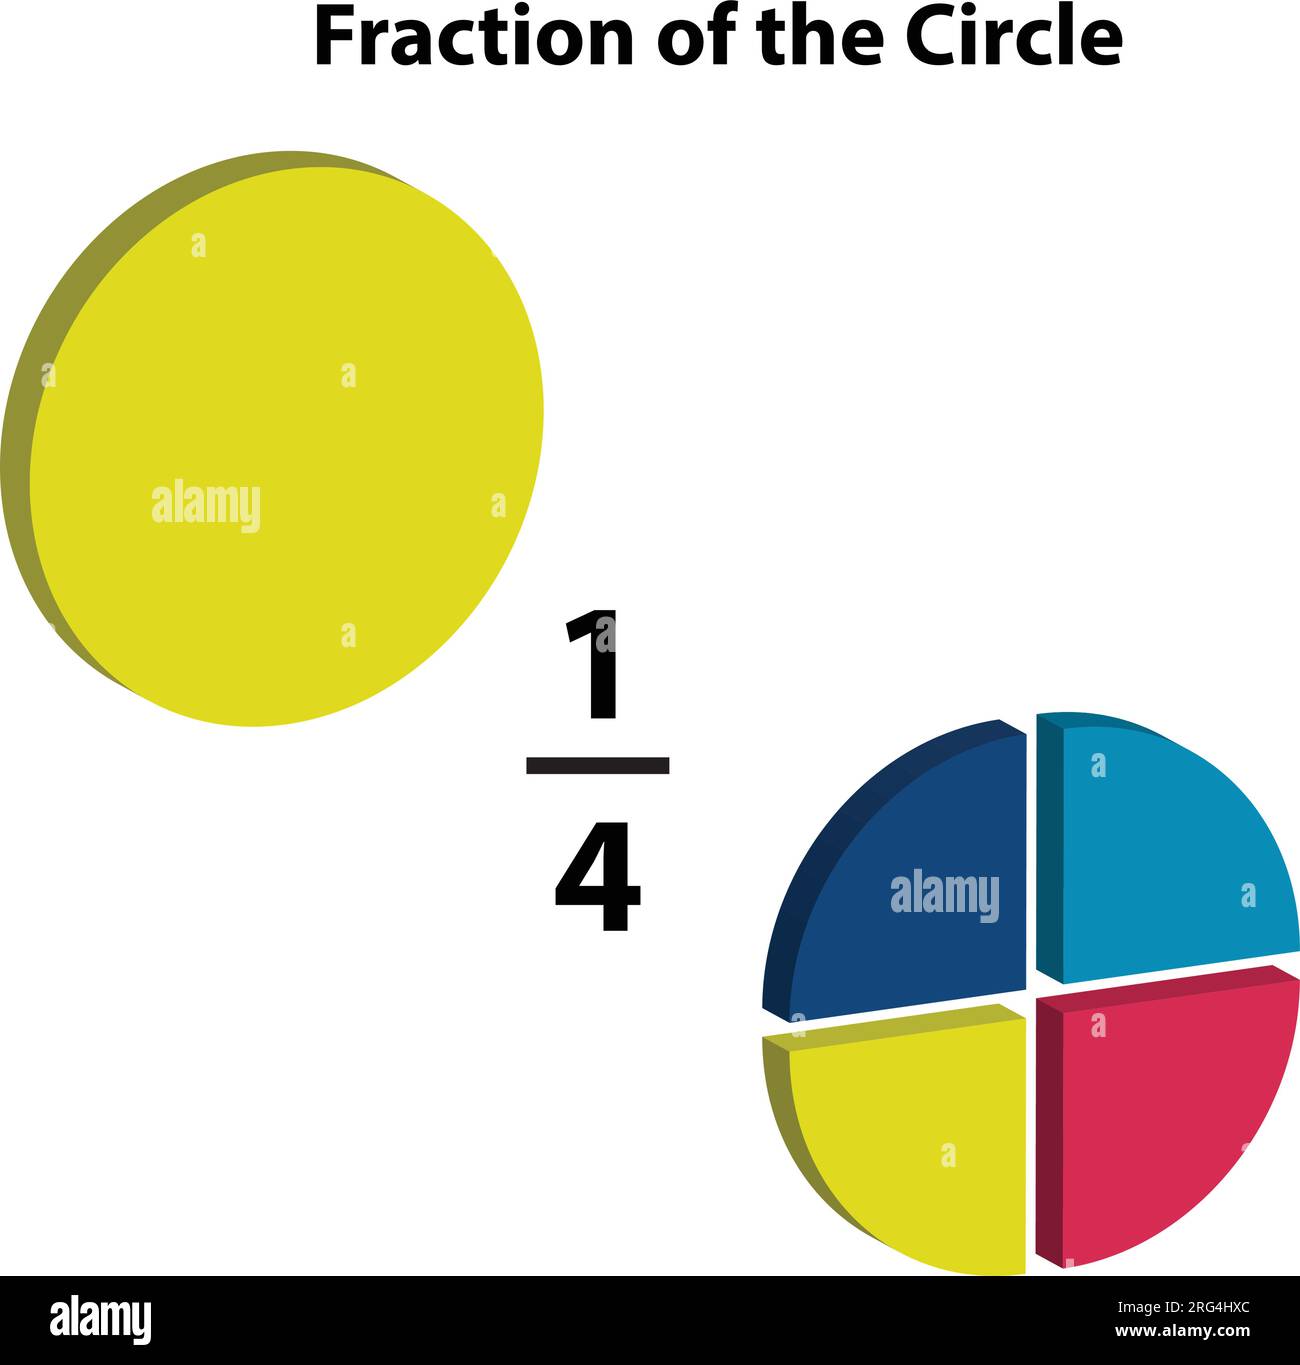 A fraction pie is divided into one-Forth slice, each showing math fractions, explained in mathematics. on a white background. Stock Vectorhttps://www.alamy.com/image-license-details/?v=1https://www.alamy.com/a-fraction-pie-is-divided-into-one-forth-slice-each-showing-math-fractions-explained-in-mathematics-on-a-white-background-image560668148.html
RF2RG4HXC–A fraction pie is divided into one-Forth slice, each showing math fractions, explained in mathematics. on a white background.
 Pie chart research, infographic business presentation vector illustration. Cartoon tiny people with calculator, laptop and tablet work on analysis of data statistics and finance information report Stock Vectorhttps://www.alamy.com/image-license-details/?v=1https://www.alamy.com/pie-chart-research-infographic-business-presentation-vector-illustration-cartoon-tiny-people-with-calculator-laptop-and-tablet-work-on-analysis-of-data-statistics-and-finance-information-report-image590733098.html
RF2W9262J–Pie chart research, infographic business presentation vector illustration. Cartoon tiny people with calculator, laptop and tablet work on analysis of data statistics and finance information report
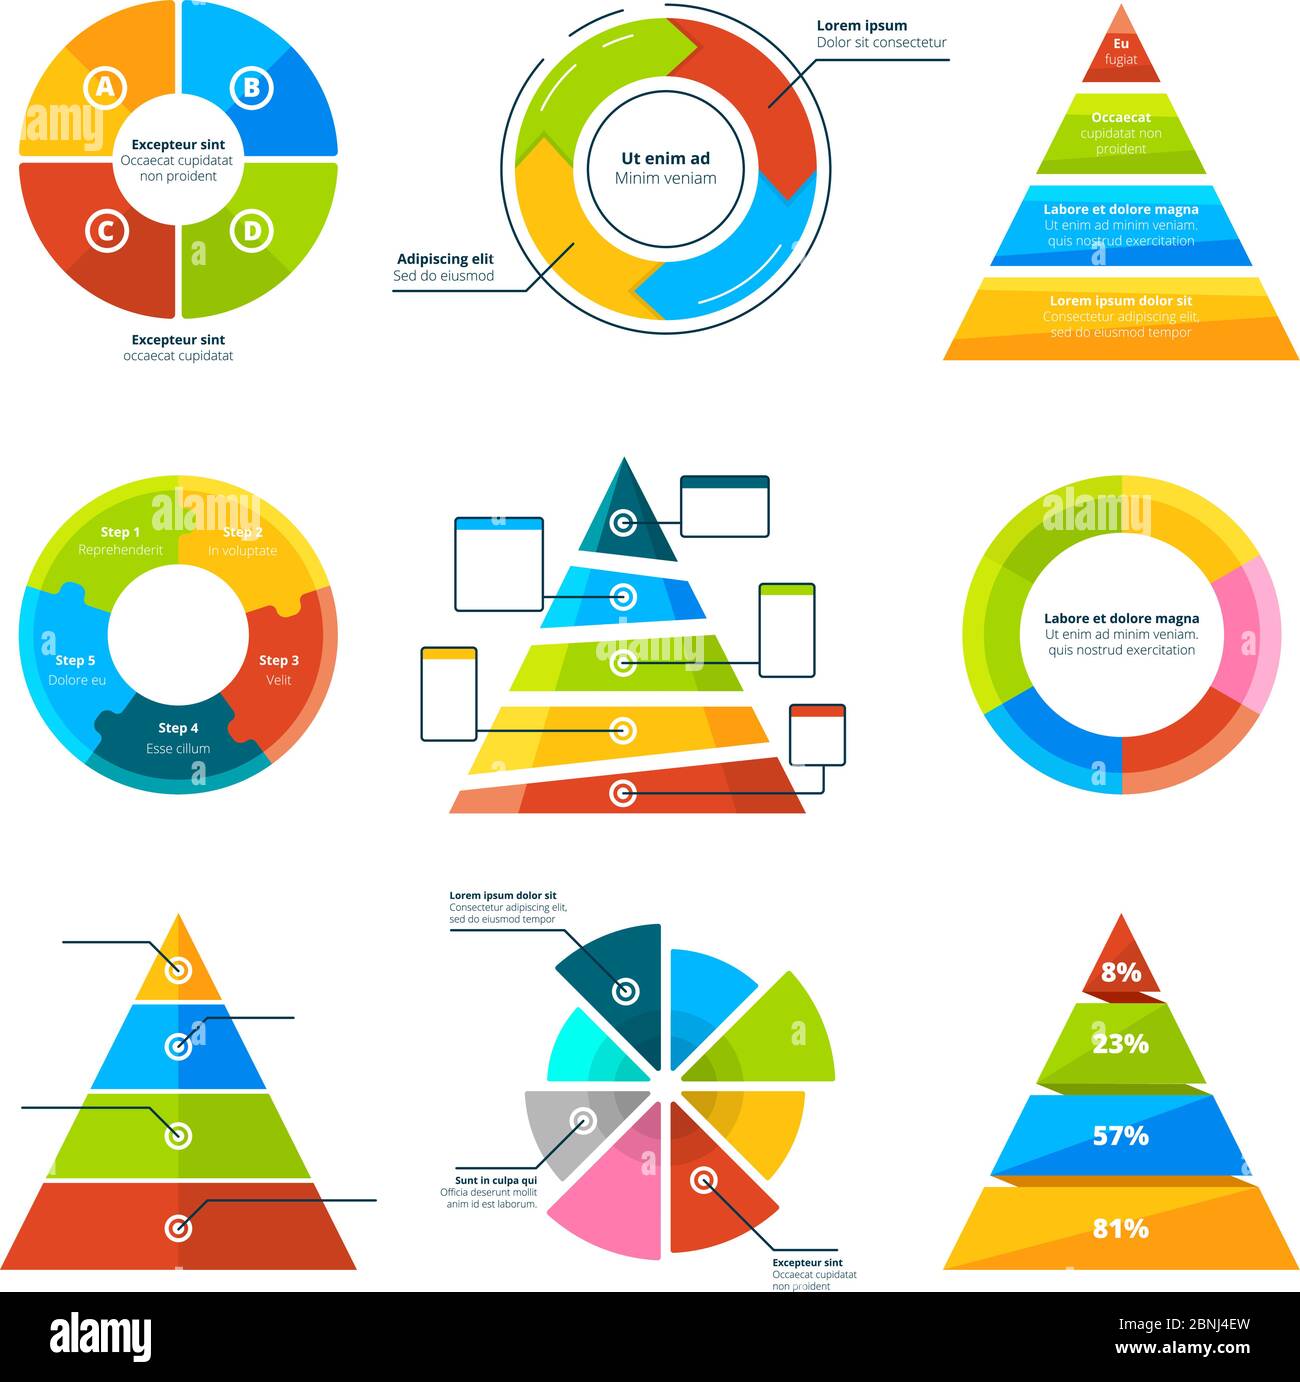 Triangles, pyramids and round elements for infographics Stock Vectorhttps://www.alamy.com/image-license-details/?v=1https://www.alamy.com/triangles-pyramids-and-round-elements-for-infographics-image357513825.html
RF2BNJ4EW–Triangles, pyramids and round elements for infographics
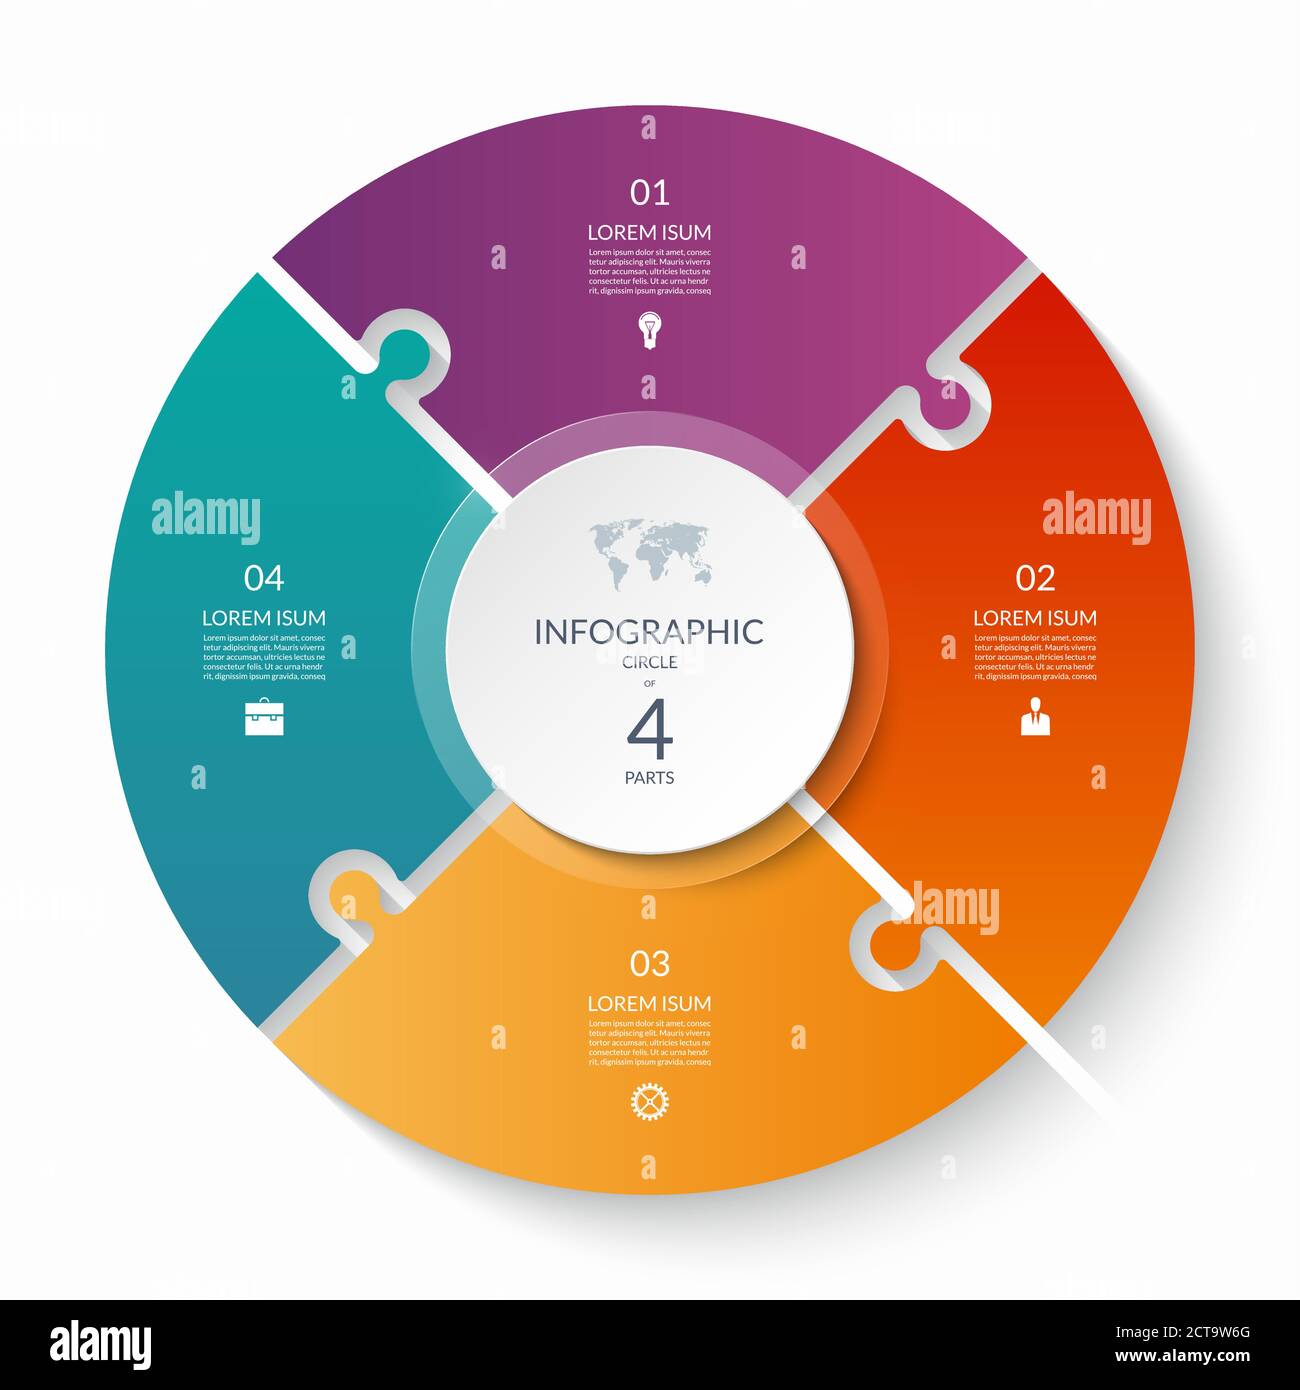 Puzzle infographic circle with 4 steps, options, pieces. Four-part cycle chart. Can be used for diagram, graph, report, presentation, web design. Stock Vectorhttps://www.alamy.com/image-license-details/?v=1https://www.alamy.com/puzzle-infographic-circle-with-4-steps-options-pieces-four-part-cycle-chart-can-be-used-for-diagram-graph-report-presentation-web-design-image376386824.html
RF2CT9W6G–Puzzle infographic circle with 4 steps, options, pieces. Four-part cycle chart. Can be used for diagram, graph, report, presentation, web design.
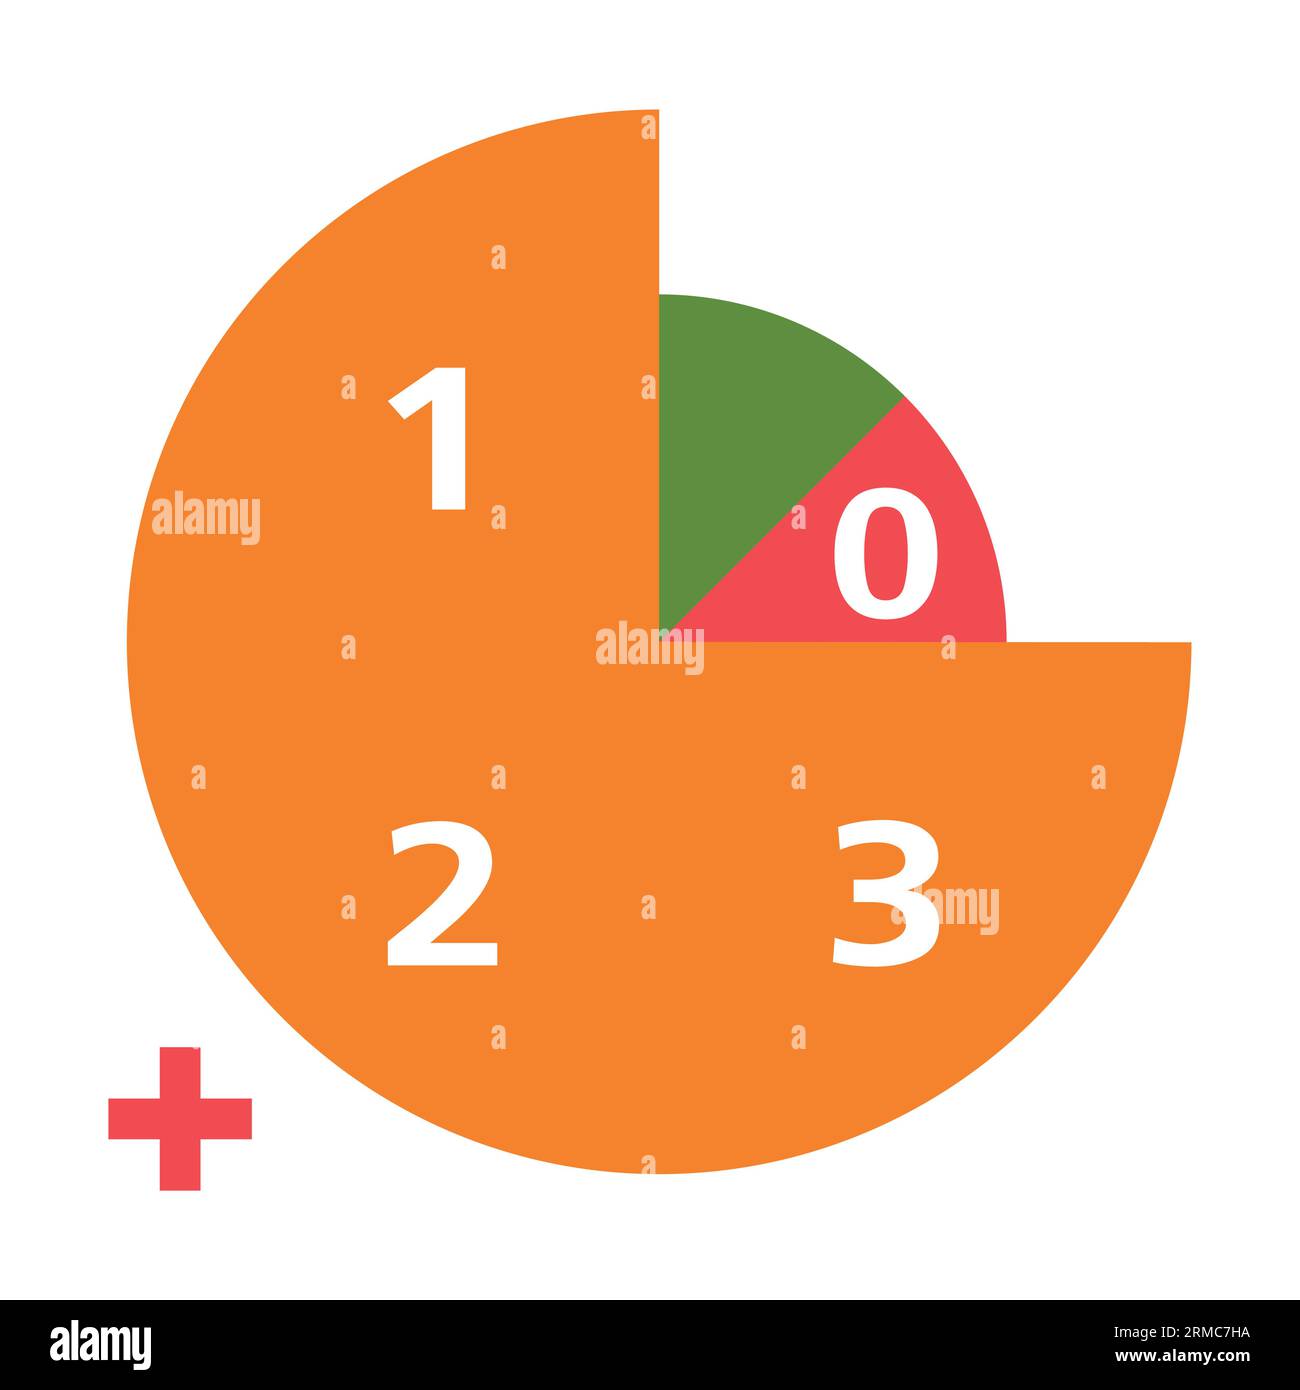 Pie chart proportion analysis Stock Vectorhttps://www.alamy.com/image-license-details/?v=1https://www.alamy.com/pie-chart-proportion-analysis-image563294294.html
RF2RMC7HA–Pie chart proportion analysis
 English: Illustration from Report on the Radiolaria collected by H.M.S. Challenger during the years 1873-1876. Part III. Original description follows: Plate 4. Sphærozoida Diam. Fig. 1. Sphærozoum trigeminum, n. sp., × 50 An annular colony. The main mass of the jelly-colony is filled up by large alveoles; the entire surface is densely covered with spicula, and beyond this skeleton-cover lie the spherical central capsules, each with an oil-globule. This species is by mistake not mentioned in the text. Fig. 2. Sphærozoum alveolatum, n. sp., × 50 Section through a spherical colony; displayi Stock Photohttps://www.alamy.com/image-license-details/?v=1https://www.alamy.com/english-illustration-from-report-on-the-radiolaria-collected-by-hms-challenger-during-the-years-1873-1876-part-iii-original-description-follows-plate-4-sphrozoida-diam-fig-1-sphrozoum-trigeminum-n-sp-50-an-annular-colony-the-main-mass-of-the-jelly-colony-is-filled-up-by-large-alveoles-the-entire-surface-is-densely-covered-with-spicula-and-beyond-this-skeleton-cover-lie-the-spherical-central-capsules-each-with-an-oil-globule-this-species-is-by-mistake-not-mentioned-in-the-text-fig-2-sphrozoum-alveolatum-n-sp-50-section-through-a-spherical-colony-displayi-image211070726.html
RMP7B2T6–English: Illustration from Report on the Radiolaria collected by H.M.S. Challenger during the years 1873-1876. Part III. Original description follows: Plate 4. Sphærozoida Diam. Fig. 1. Sphærozoum trigeminum, n. sp., × 50 An annular colony. The main mass of the jelly-colony is filled up by large alveoles; the entire surface is densely covered with spicula, and beyond this skeleton-cover lie the spherical central capsules, each with an oil-globule. This species is by mistake not mentioned in the text. Fig. 2. Sphærozoum alveolatum, n. sp., × 50 Section through a spherical colony; displayi
 Pie chart with different segments in a circular diagram. wheel graph divided into parts and sections. Flat vector illustration isolated on white Stock Vectorhttps://www.alamy.com/image-license-details/?v=1https://www.alamy.com/pie-chart-with-different-segments-in-a-circular-diagram-wheel-graph-divided-into-parts-and-sections-flat-vector-illustration-isolated-on-white-image609129986.html
RF2XB07EA–Pie chart with different segments in a circular diagram. wheel graph divided into parts and sections. Flat vector illustration isolated on white
 Exactly what happens to each of the millions of Social Security Account applicants during each working shift is recorded daily. At any minute of the day or night it is possible to locate any application through the records maintained in the production and control section of the Social Security Board Records Office. This is the nerve center of the greatest bookkeeping job in the world. The photograph above shows workers in the records office running off daily production report, which accurately pictures details of the ebb and flow of each of the several operations necessary to set up an individ Stock Photohttps://www.alamy.com/image-license-details/?v=1https://www.alamy.com/exactly-what-happens-to-each-of-the-millions-of-social-security-account-applicants-during-each-working-shift-is-recorded-daily-at-any-minute-of-the-day-or-night-it-is-possible-to-locate-any-application-through-the-records-maintained-in-the-production-and-control-section-of-the-social-security-board-records-office-this-is-the-nerve-center-of-the-greatest-bookkeeping-job-in-the-world-the-photograph-above-shows-workers-in-the-records-office-running-off-daily-production-report-which-accurately-pictures-details-of-the-ebb-and-flow-of-each-of-the-several-operations-necessary-to-set-up-an-individ-image265048866.html
RMWB60EX–Exactly what happens to each of the millions of Social Security Account applicants during each working shift is recorded daily. At any minute of the day or night it is possible to locate any application through the records maintained in the production and control section of the Social Security Board Records Office. This is the nerve center of the greatest bookkeeping job in the world. The photograph above shows workers in the records office running off daily production report, which accurately pictures details of the ebb and flow of each of the several operations necessary to set up an individ
RF2K4DPC9–Pie chart or graphic, precieuse part of circle infographic. Vector illustration. Business pie, circular icon, data step section, set progress, isolate
 Timeline of project development and business growth vector illustration. Cartoon isolated infographic steps to reach goal, progress path with diagram report, documents, voice message elements Stock Vectorhttps://www.alamy.com/image-license-details/?v=1https://www.alamy.com/timeline-of-project-development-and-business-growth-vector-illustration-cartoon-isolated-infographic-steps-to-reach-goal-progress-path-with-diagram-report-documents-voice-message-elements-image561972235.html
RF2RJ818Y–Timeline of project development and business growth vector illustration. Cartoon isolated infographic steps to reach goal, progress path with diagram report, documents, voice message elements
 Abstract pie chart with three sections vector flat illustration. Circle graphics. Political election results, business or investing data presentation. Invest strategy, business investment results. Stock Vectorhttps://www.alamy.com/image-license-details/?v=1https://www.alamy.com/abstract-pie-chart-with-three-sections-vector-flat-illustration-circle-graphics-political-election-results-business-or-investing-data-presentation-invest-strategy-business-investment-results-image417191926.html
RF2F6MMFJ–Abstract pie chart with three sections vector flat illustration. Circle graphics. Political election results, business or investing data presentation. Invest strategy, business investment results.
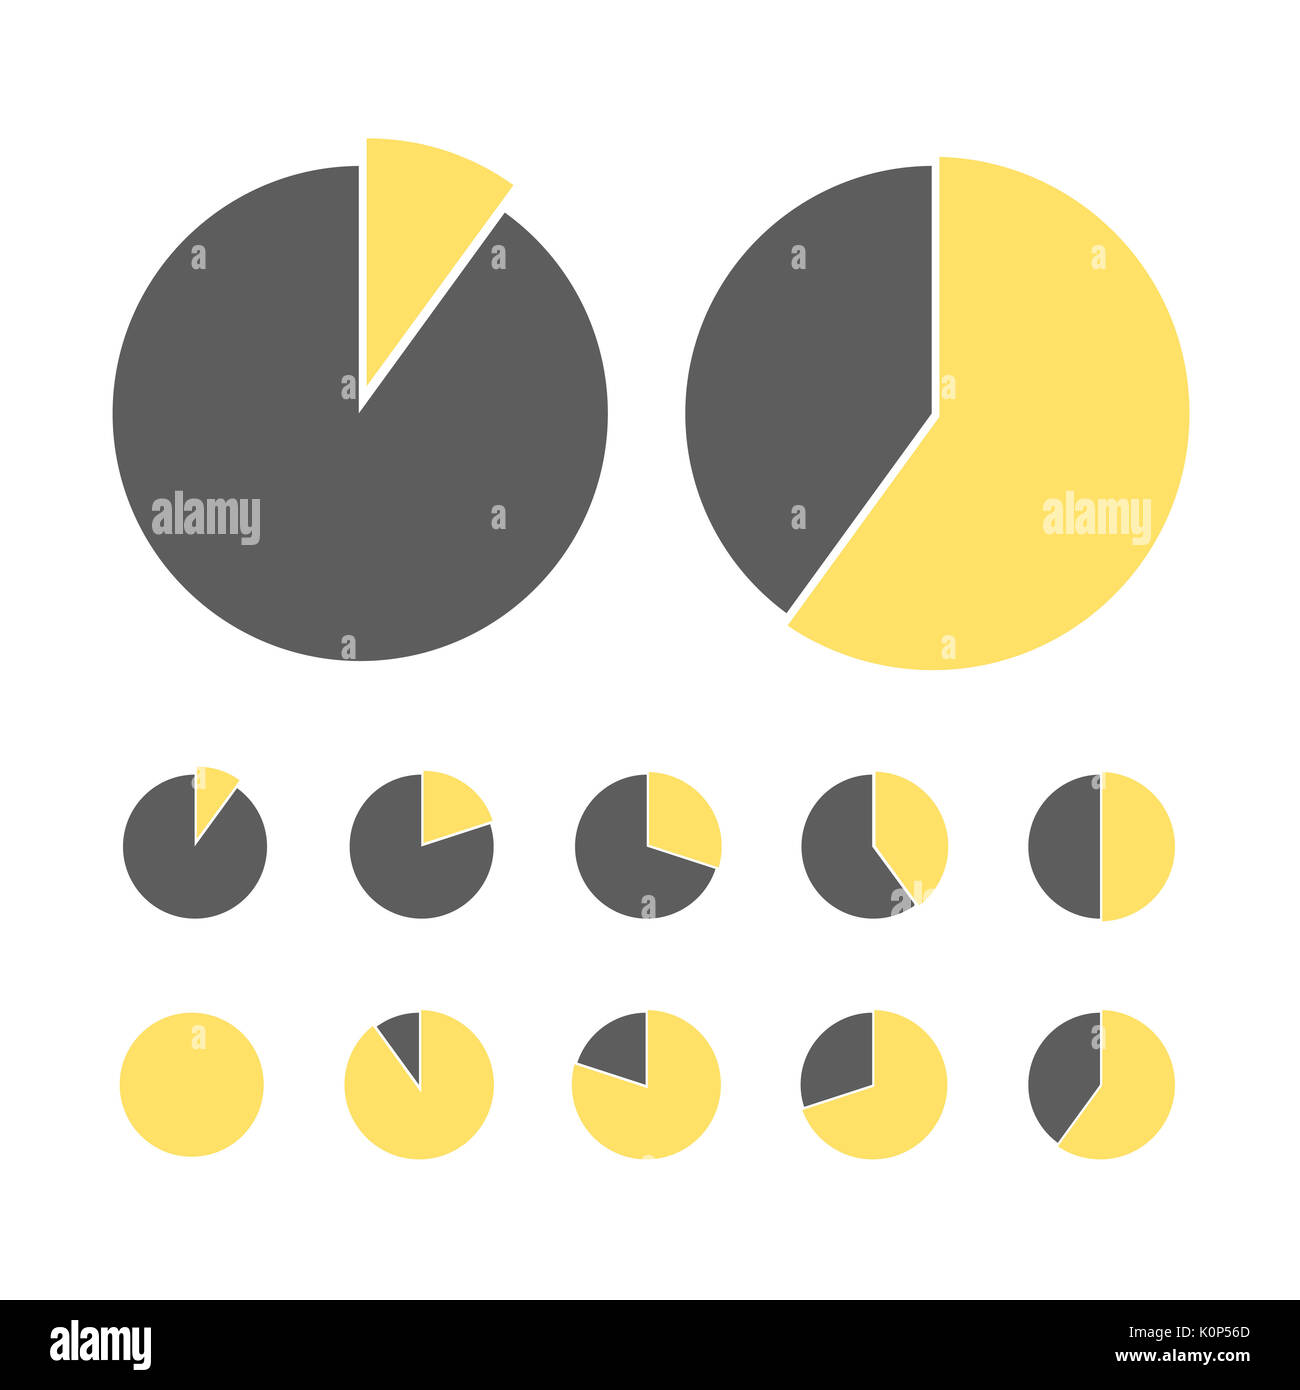 Pie chart statistic concept. Business flow process diagram. Infographic elements for presentation. Percentage infographics. Stock Photohttps://www.alamy.com/image-license-details/?v=1https://www.alamy.com/pie-chart-statistic-concept-business-flow-process-diagram-infographic-image155380357.html
RFK0P56D–Pie chart statistic concept. Business flow process diagram. Infographic elements for presentation. Percentage infographics.
 Calculator with section, paragraph symbol. 3D rendering isolated on white background Stock Photohttps://www.alamy.com/image-license-details/?v=1https://www.alamy.com/calculator-with-section-paragraph-symbol-3d-rendering-isolated-on-white-background-image616543532.html
RF2XR1YFT–Calculator with section, paragraph symbol. 3D rendering isolated on white background
 Process chart with arrow slide template. Business data. Graph, diagram, design. Creative concept for presentation, marketing, report. Can be used for Stock Vectorhttps://www.alamy.com/image-license-details/?v=1https://www.alamy.com/process-chart-with-arrow-slide-template-business-data-graph-diagram-design-creative-concept-for-presentation-marketing-report-can-be-used-for-image467235998.html
RF2J44C7X–Process chart with arrow slide template. Business data. Graph, diagram, design. Creative concept for presentation, marketing, report. Can be used for
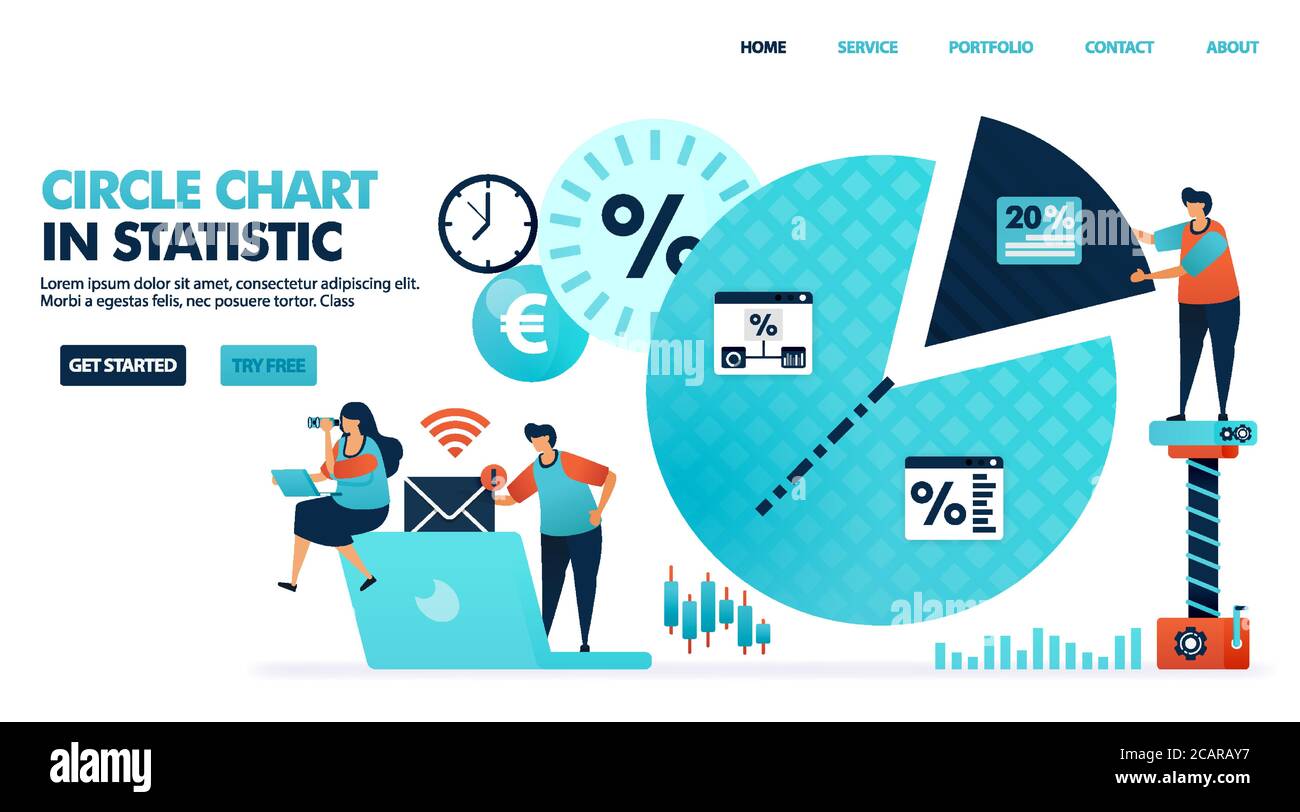 Circle or pie chart for statistics, analysis, marketing planning & strategy. Business ideas in company review report. Annual profit presentation. Huma Stock Vectorhttps://www.alamy.com/image-license-details/?v=1https://www.alamy.com/circle-or-pie-chart-for-statistics-analysis-marketing-planning-strategy-business-ideas-in-company-review-report-annual-profit-presentation-huma-image368077787.html
RF2CARAY7–Circle or pie chart for statistics, analysis, marketing planning & strategy. Business ideas in company review report. Annual profit presentation. Huma
RF2X998TH–Statistic chart pie report marketing research diagram with section 3d icon realistic vector illustration. Business analyzing circle graph data scheme
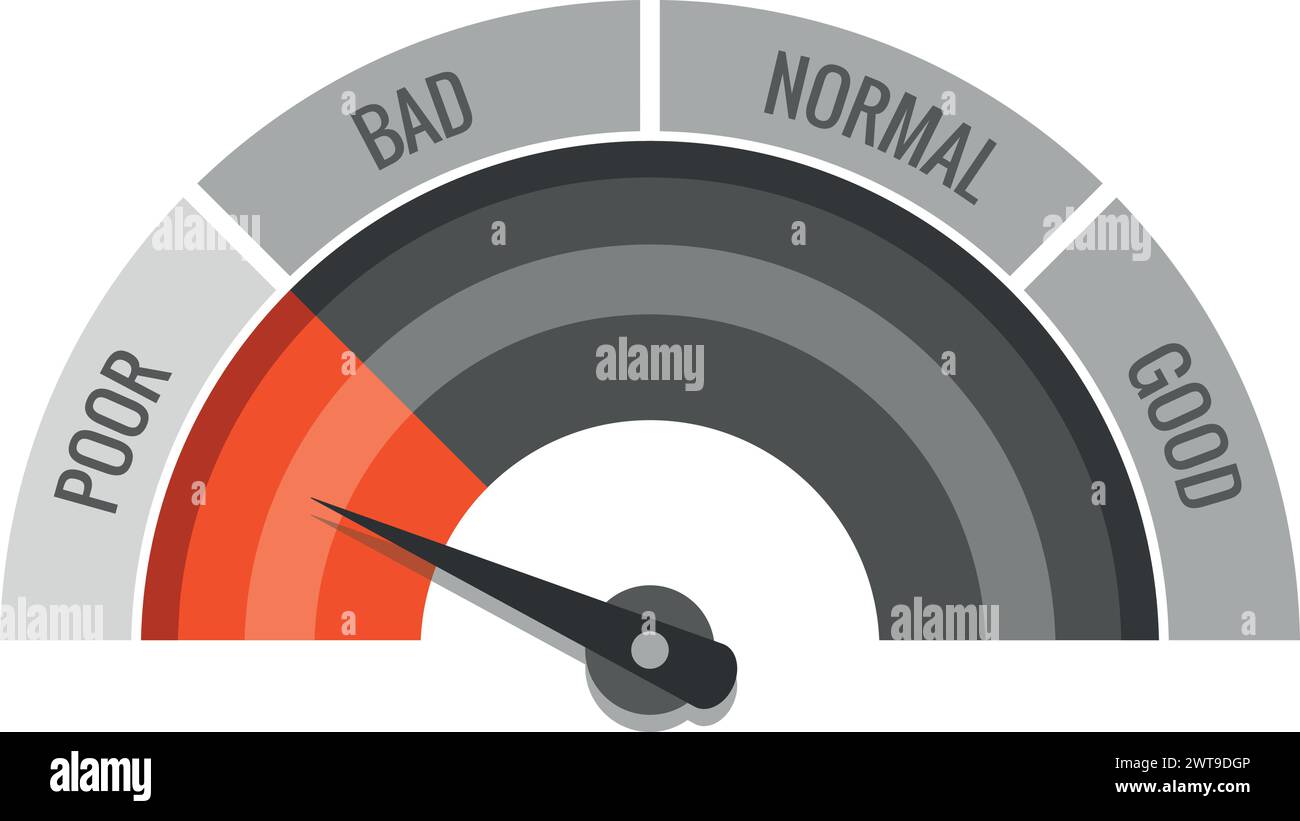 Poor credit rating meter. Red section arrow Stock Vectorhttps://www.alamy.com/image-license-details/?v=1https://www.alamy.com/poor-credit-rating-meter-red-section-arrow-image600112486.html
RF2WT9DGP–Poor credit rating meter. Red section arrow
 Set of circular sector percentage diagrams from 0 to 100 ready-to-use for web design, user interface (UI) or infographic - indicator with red Stock Vectorhttps://www.alamy.com/image-license-details/?v=1https://www.alamy.com/set-of-circular-sector-percentage-diagrams-from-0-to-100-ready-to-use-for-web-design-user-interface-ui-or-infographic-indicator-with-red-image188619417.html
RFMXT9YN–Set of circular sector percentage diagrams from 0 to 100 ready-to-use for web design, user interface (UI) or infographic - indicator with red
 Infographic template for business. 6 steps Mindmap diagram with section pie chart, presentation vector infographic. Stock Vectorhttps://www.alamy.com/image-license-details/?v=1https://www.alamy.com/infographic-template-for-business-6-steps-mindmap-diagram-with-section-pie-chart-presentation-vector-infographic-image455776816.html
RF2HDEBYC–Infographic template for business. 6 steps Mindmap diagram with section pie chart, presentation vector infographic.
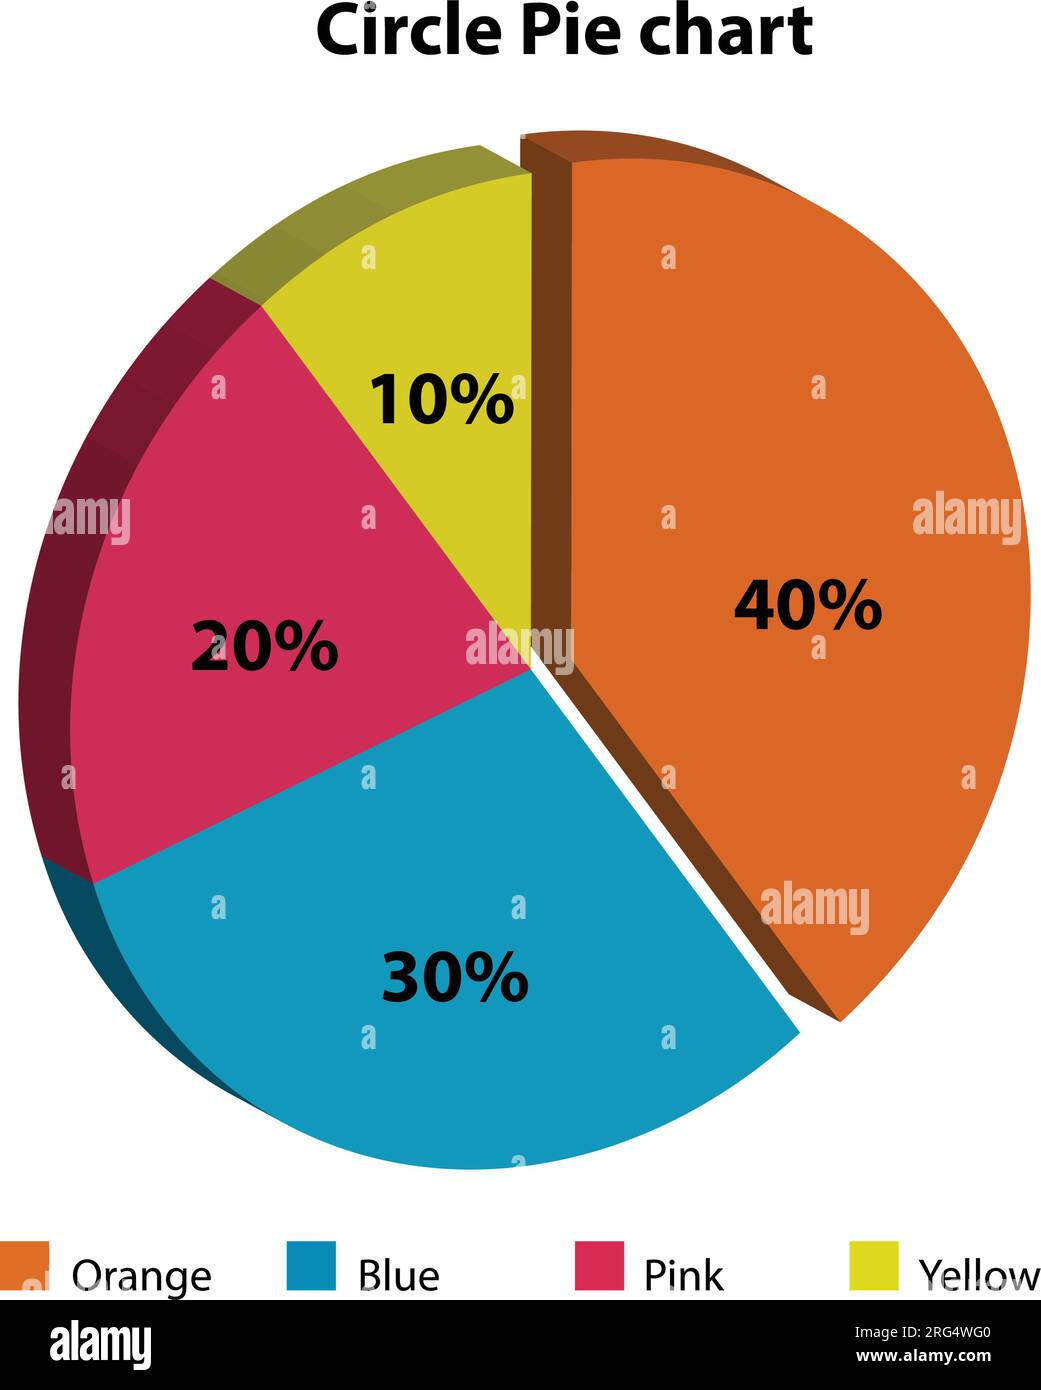 Different color circle pie chart. on white background Stock Vectorhttps://www.alamy.com/image-license-details/?v=1https://www.alamy.com/different-color-circle-pie-chart-on-white-background-image560674128.html
RF2RG4WG0–Different color circle pie chart. on white background
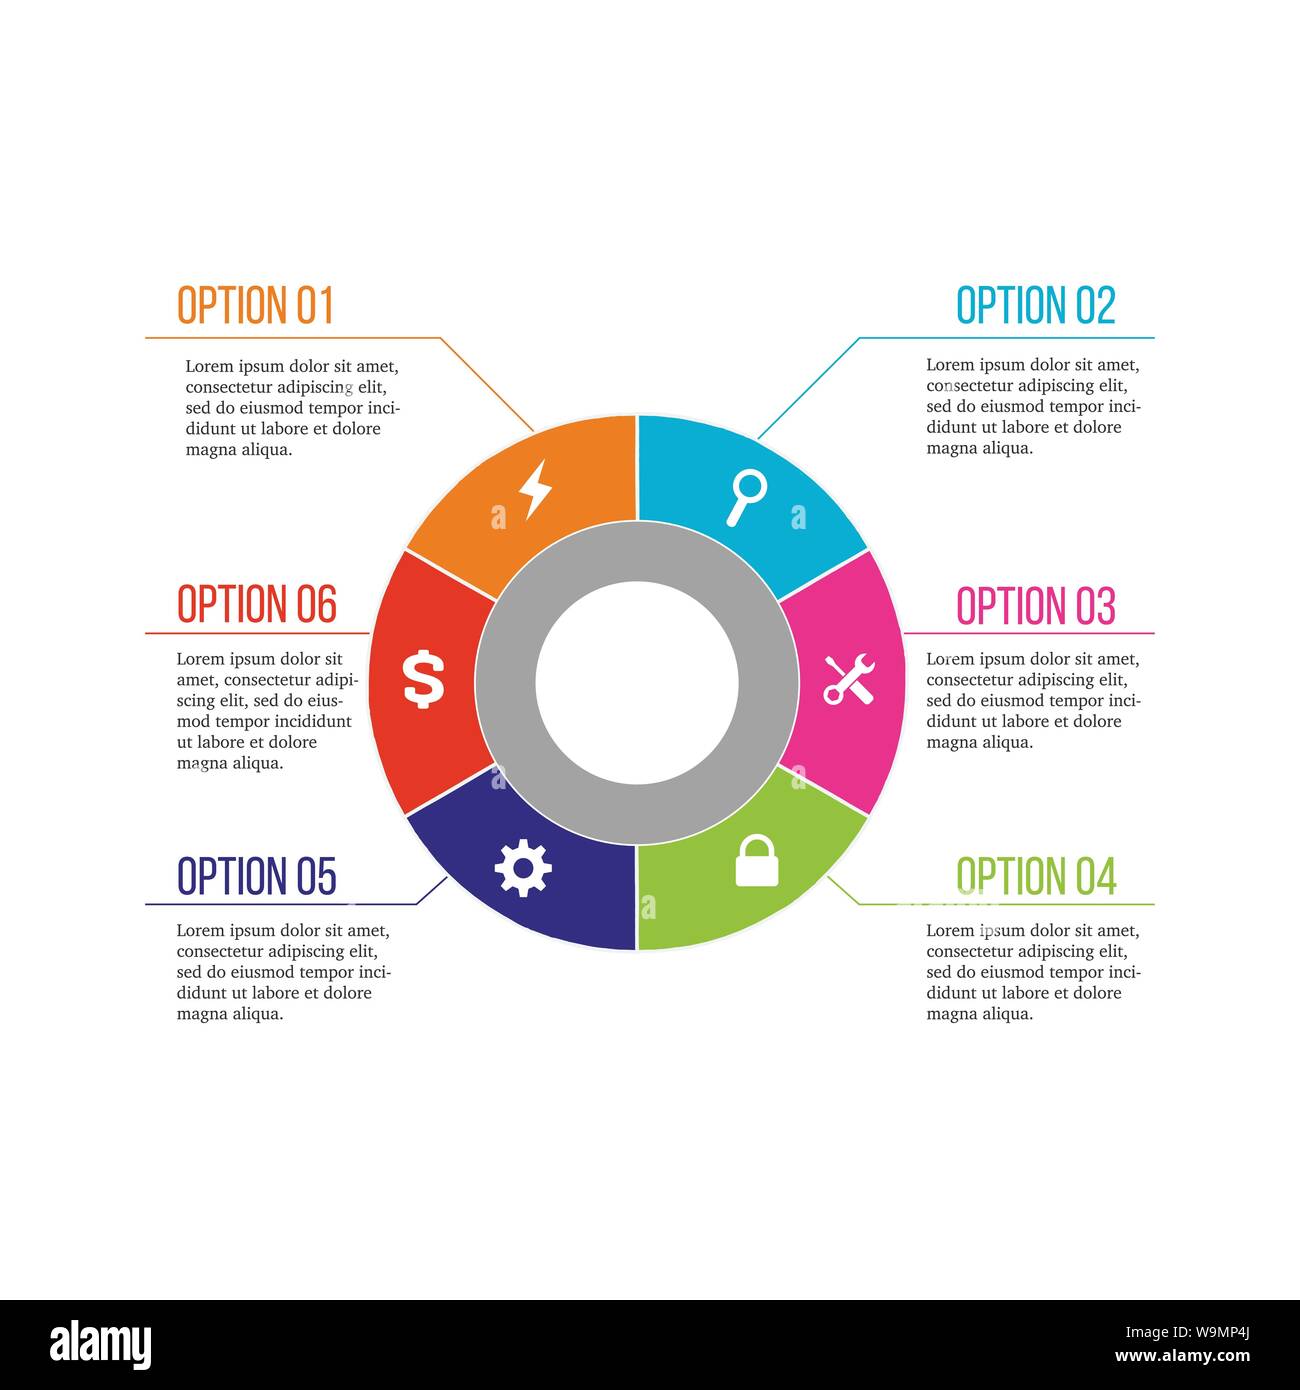 6 options Business Infographic circle, six pieces circle diagram, , step presentation, section banner, Stock Vectorhttps://www.alamy.com/image-license-details/?v=1https://www.alamy.com/6-options-business-infographic-circle-six-pieces-circle-diagram-step-presentation-section-banner-image264143842.html
RFW9MP4J–6 options Business Infographic circle, six pieces circle diagram, , step presentation, section banner,
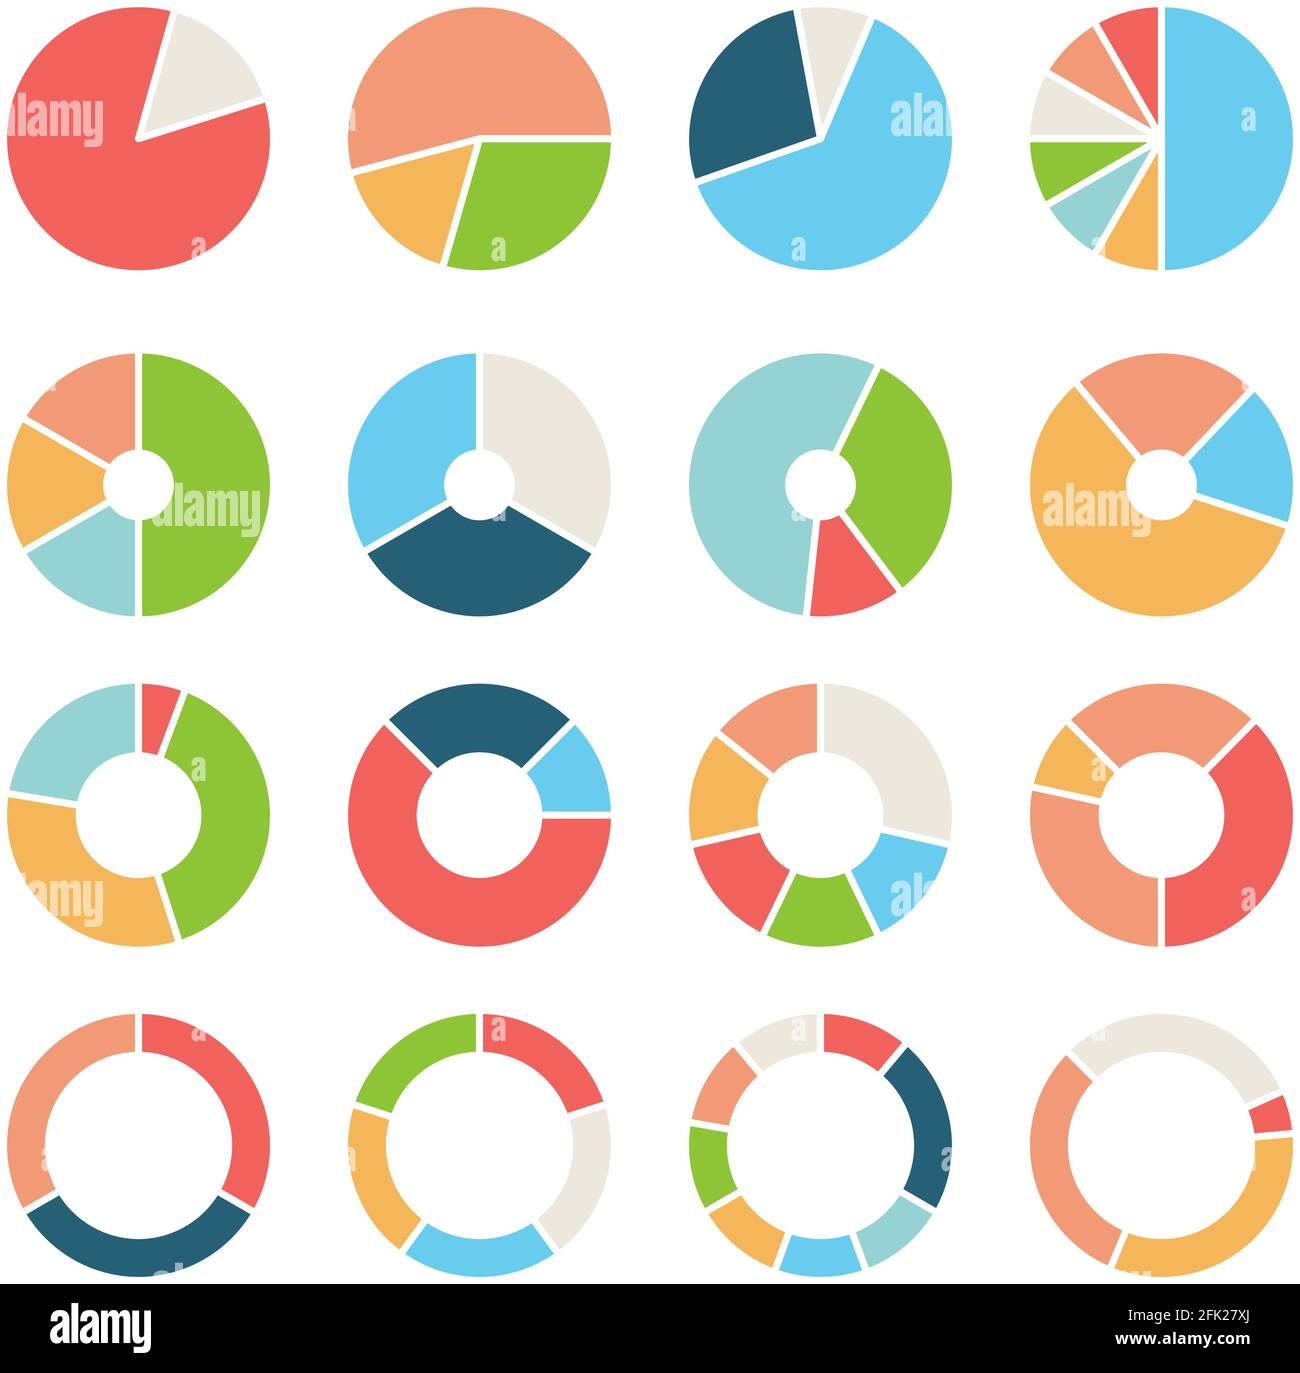 Circle section. Round chart wheel circular hub with different section donut pie business infographic vector template Stock Vectorhttps://www.alamy.com/image-license-details/?v=1https://www.alamy.com/circle-section-round-chart-wheel-circular-hub-with-different-section-donut-pie-business-infographic-vector-template-image424777434.html
RF2FK27XJ–Circle section. Round chart wheel circular hub with different section donut pie business infographic vector template
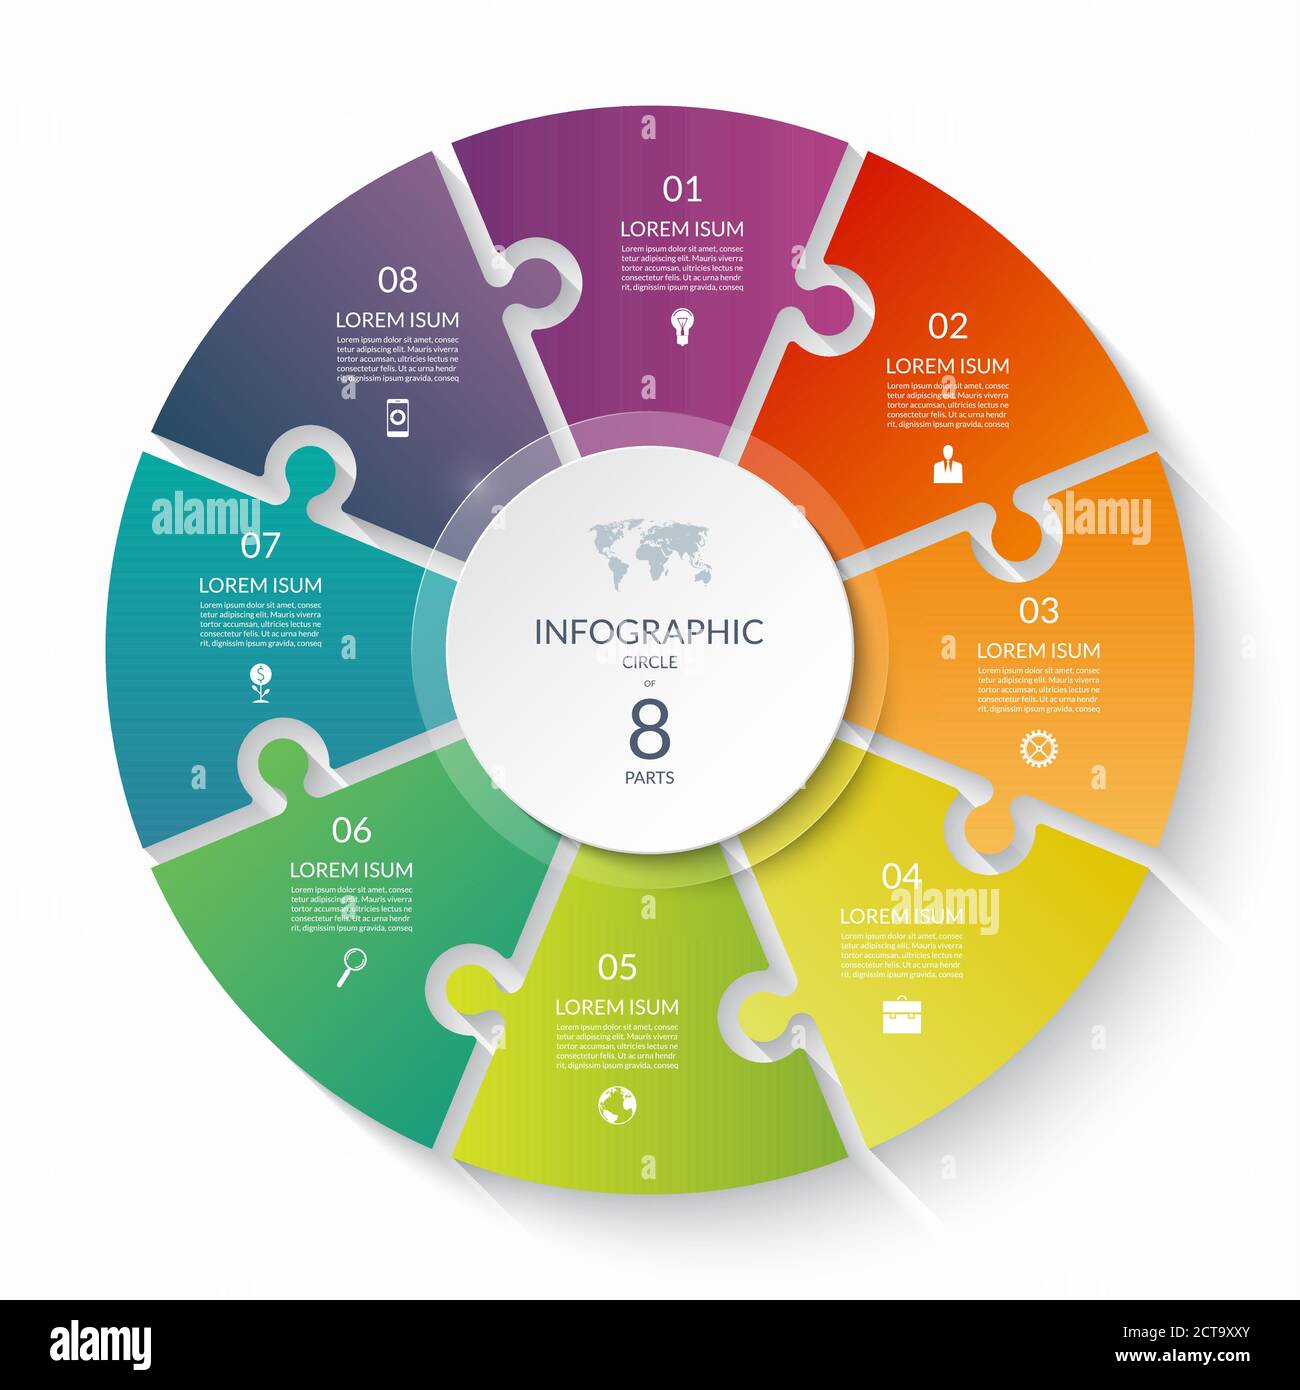 Puzzle infographic circle with 8 steps, options, pieces. Eight-part cycle chart. Can be used for diagram, graph, report, presentation, web design. Stock Vectorhttps://www.alamy.com/image-license-details/?v=1https://www.alamy.com/puzzle-infographic-circle-with-8-steps-options-pieces-eight-part-cycle-chart-can-be-used-for-diagram-graph-report-presentation-web-design-image376388179.html
RF2CT9XXY–Puzzle infographic circle with 8 steps, options, pieces. Eight-part cycle chart. Can be used for diagram, graph, report, presentation, web design.
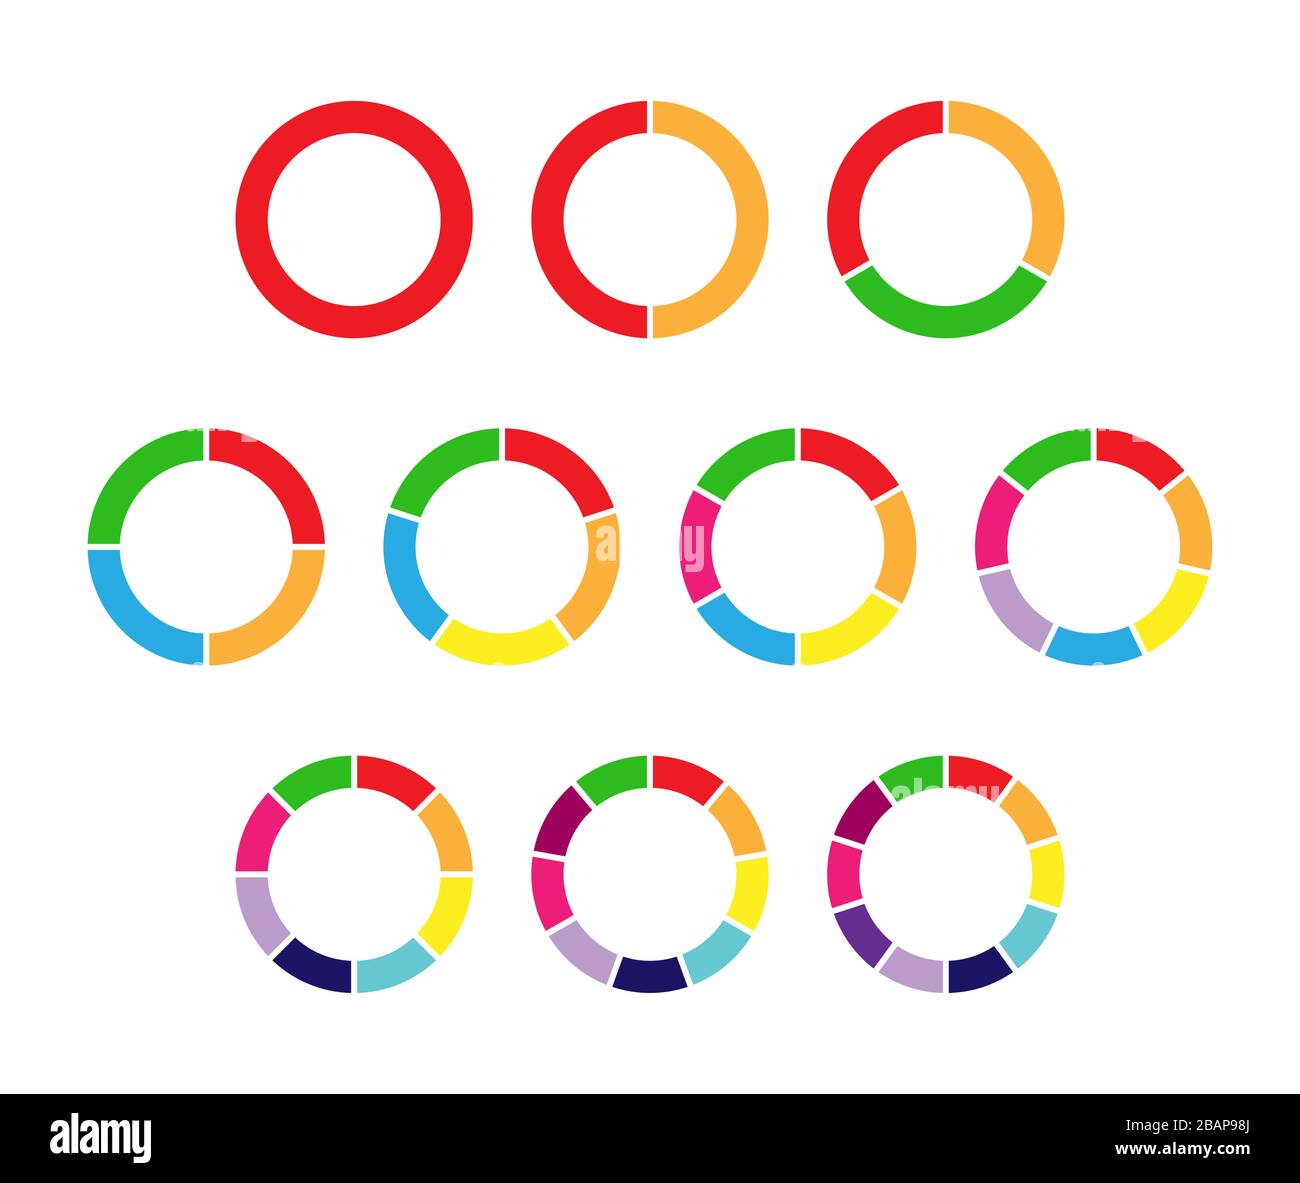 set of colored pie charts for 1,2,3,4,5,6,7,8,9,10 steps or sections to illustrate a business plan, infographic, reporting. Simple design, stock vecto Stock Vectorhttps://www.alamy.com/image-license-details/?v=1https://www.alamy.com/set-of-colored-pie-charts-for-12345678910-steps-or-sections-to-illustrate-a-business-plan-infographic-reporting-simple-design-stock-vecto-image350844162.html
RF2BAP98J–set of colored pie charts for 1,2,3,4,5,6,7,8,9,10 steps or sections to illustrate a business plan, infographic, reporting. Simple design, stock vecto
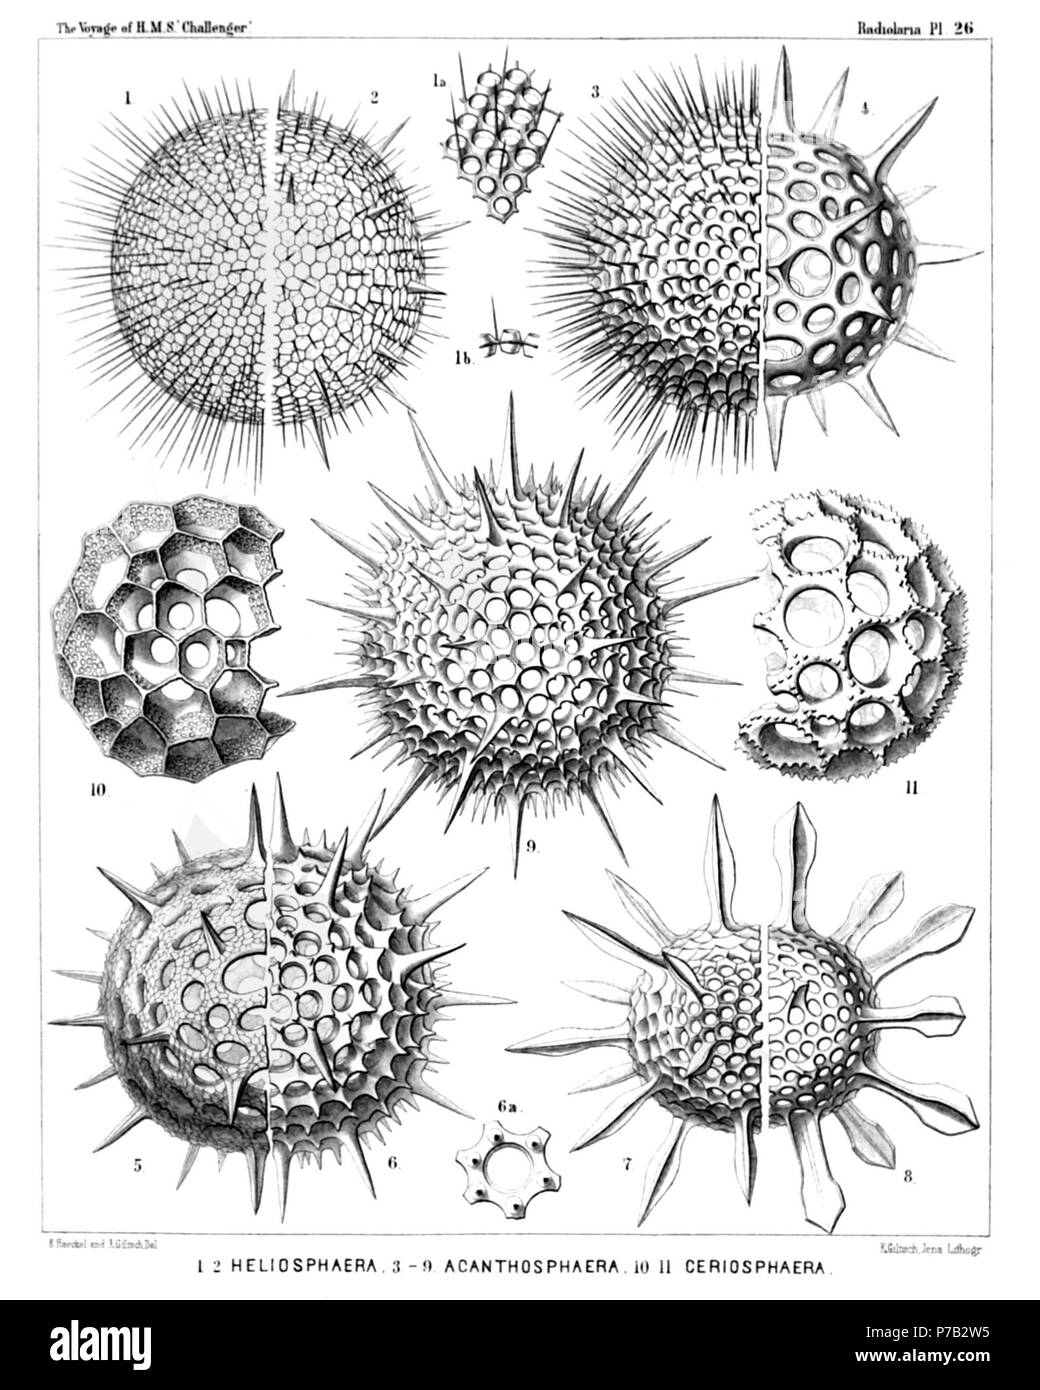 English: Illustration from Report on the Radiolaria collected by H.M.S. Challenger during the years 1873-1876. Part III. Original description follows: Plate 26. Liosphærida et Astrosphærida. Diam. Fig. 1. Coscinomma amphisiphon, n. sp., × 300 Fig. 1a. A piece of the lattice-shell, × 600 Fig. 1b. Vertical section through the shell-wall, × 600 Fig. 2. Heliosphæra hexagonaria, n. sp., × 300 Fig. 3. Acanthosphæra castanea, n. sp., × 400 Fig. 4. Acanthosphæra angulata, n. sp., × 300 Fig. 5. Acanthosphæra reticulata, n. sp., × 300 Fig. 6. Heliosphæra coronata, n. sp., × 400 Fig. 6a. A sin Stock Photohttps://www.alamy.com/image-license-details/?v=1https://www.alamy.com/english-illustration-from-report-on-the-radiolaria-collected-by-hms-challenger-during-the-years-1873-1876-part-iii-original-description-follows-plate-26-liosphrida-et-astrosphrida-diam-fig-1-coscinomma-amphisiphon-n-sp-300-fig-1a-a-piece-of-the-lattice-shell-600-fig-1b-vertical-section-through-the-shell-wall-600-fig-2-heliosphra-hexagonaria-n-sp-300-fig-3-acanthosphra-castanea-n-sp-400-fig-4-acanthosphra-angulata-n-sp-300-fig-5-acanthosphra-reticulata-n-sp-300-fig-6-heliosphra-coronata-n-sp-400-fig-6a-a-sin-image211070753.html
RMP7B2W5–English: Illustration from Report on the Radiolaria collected by H.M.S. Challenger during the years 1873-1876. Part III. Original description follows: Plate 26. Liosphærida et Astrosphærida. Diam. Fig. 1. Coscinomma amphisiphon, n. sp., × 300 Fig. 1a. A piece of the lattice-shell, × 600 Fig. 1b. Vertical section through the shell-wall, × 600 Fig. 2. Heliosphæra hexagonaria, n. sp., × 300 Fig. 3. Acanthosphæra castanea, n. sp., × 400 Fig. 4. Acanthosphæra angulata, n. sp., × 300 Fig. 5. Acanthosphæra reticulata, n. sp., × 300 Fig. 6. Heliosphæra coronata, n. sp., × 400 Fig. 6a. A sin
 Pie chart with different segments in a circular diagram. wheel graph divided into parts and sections. Flat vector illustration isolated on white Stock Vectorhttps://www.alamy.com/image-license-details/?v=1https://www.alamy.com/pie-chart-with-different-segments-in-a-circular-diagram-wheel-graph-divided-into-parts-and-sections-flat-vector-illustration-isolated-on-white-image609130075.html
RF2XB07HF–Pie chart with different segments in a circular diagram. wheel graph divided into parts and sections. Flat vector illustration isolated on white
 SECTION THROUGH TURBINE WHEEL AND FLUME From Annual Report of 1868, Water Department of Philadelphia - Fairmount Waterworks, East bank of Schuylkill River, Aquarium Drive, Philadelphia, Philadelphia County, PA Stock Photohttps://www.alamy.com/image-license-details/?v=1https://www.alamy.com/section-through-turbine-wheel-and-flume-from-annual-report-of-1868-water-department-of-philadelphia-fairmount-waterworks-east-bank-of-schuylkill-river-aquarium-drive-philadelphia-philadelphia-county-pa-image256702007.html
RMTWHP0R–SECTION THROUGH TURBINE WHEEL AND FLUME From Annual Report of 1868, Water Department of Philadelphia - Fairmount Waterworks, East bank of Schuylkill River, Aquarium Drive, Philadelphia, Philadelphia County, PA
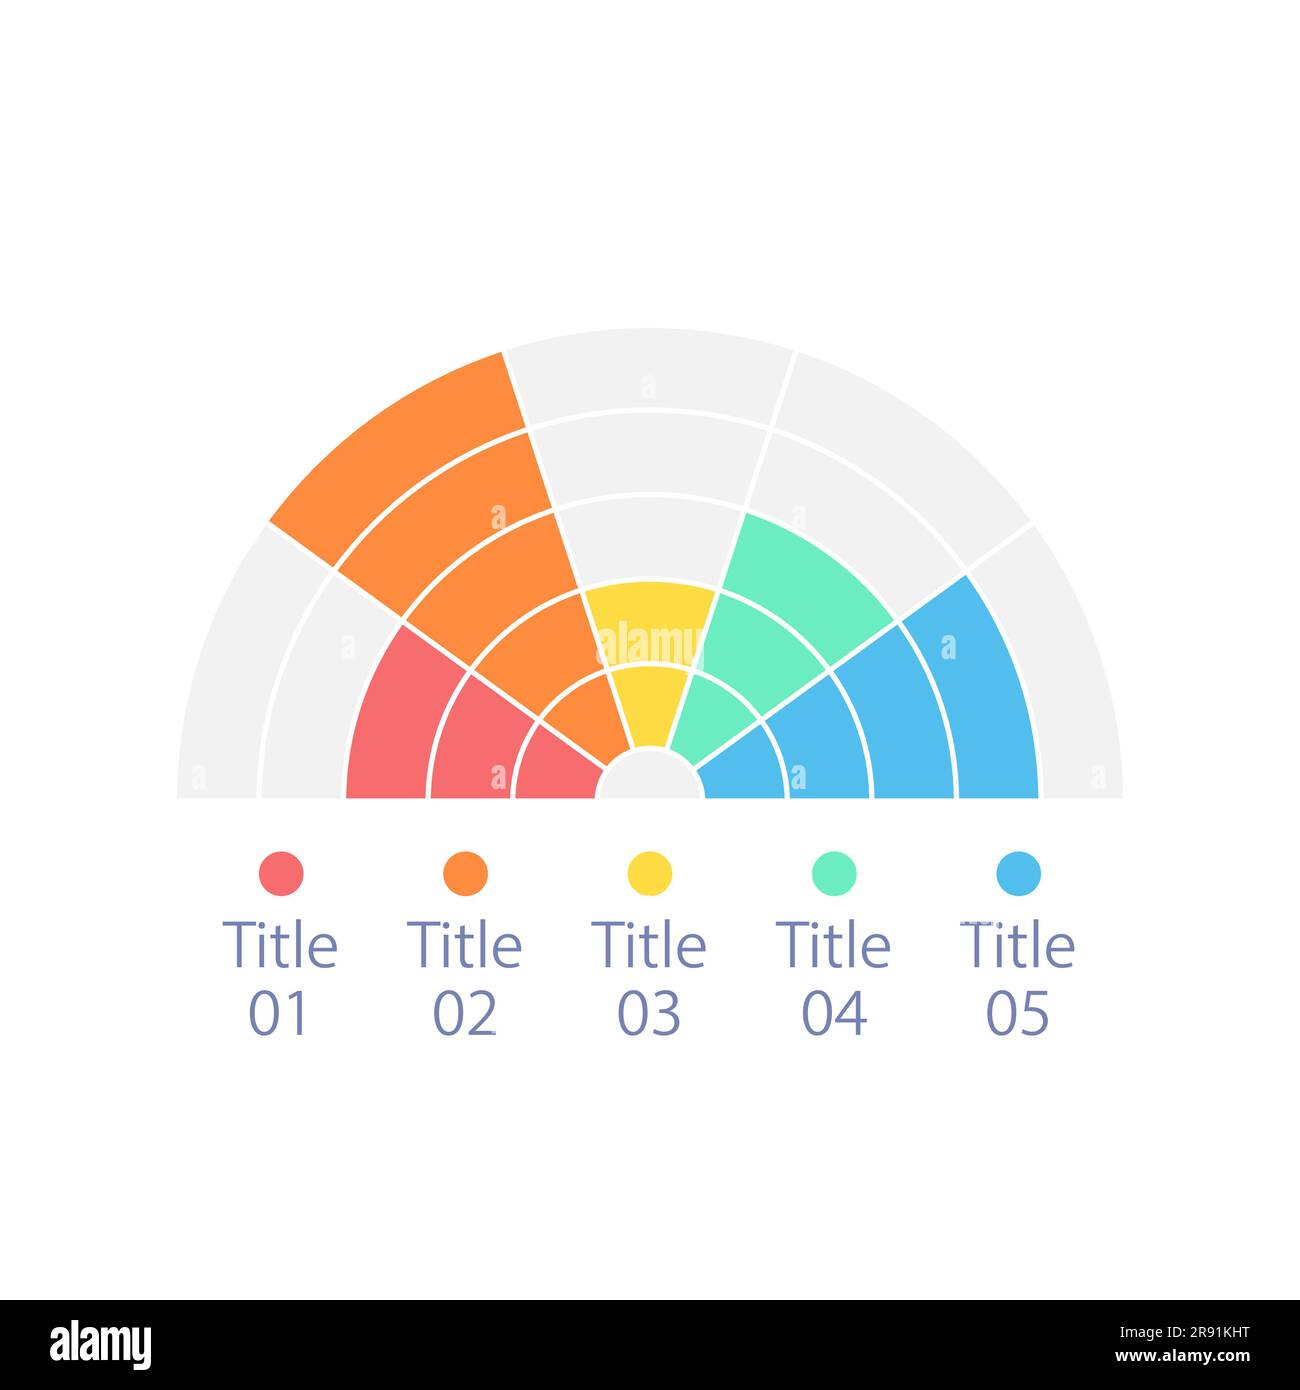 Semi circle infographic chart design template with five units Stock Vectorhttps://www.alamy.com/image-license-details/?v=1https://www.alamy.com/semi-circle-infographic-chart-design-template-with-five-units-image556301028.html
RF2R91KHT–Semi circle infographic chart design template with five units
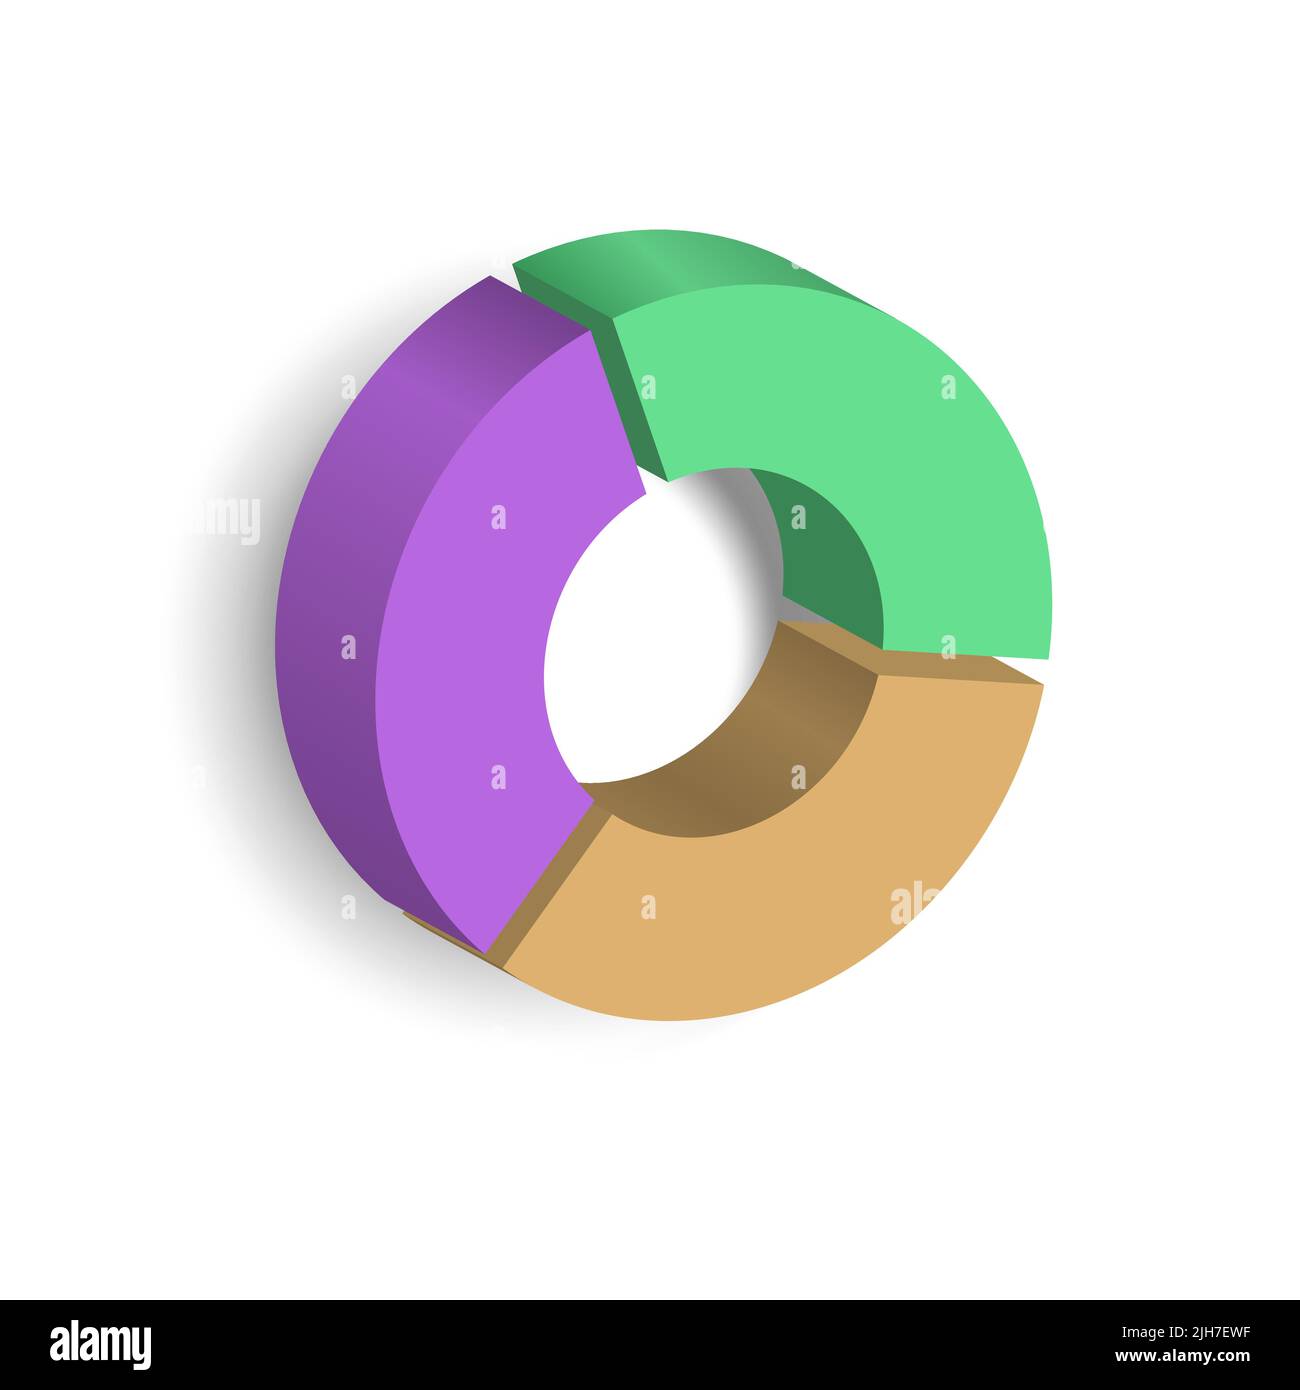 3d pie chart graph is divided into parts. Realistic geometric infographic of 3 parts share for business presentation, design data finance, report. Bus Stock Vectorhttps://www.alamy.com/image-license-details/?v=1https://www.alamy.com/3d-pie-chart-graph-is-divided-into-parts-realistic-geometric-infographic-of-3-parts-share-for-business-presentation-design-data-finance-report-bus-image475294443.html
RF2JH7EWF–3d pie chart graph is divided into parts. Realistic geometric infographic of 3 parts share for business presentation, design data finance, report. Bus
 Tablet displaying a graph or chart with a rising trend and a highlighted section. Stock Vectorhttps://www.alamy.com/image-license-details/?v=1https://www.alamy.com/tablet-displaying-a-graph-or-chart-with-a-rising-trend-and-a-highlighted-section-image571233758.html
RF2T59XDJ–Tablet displaying a graph or chart with a rising trend and a highlighted section.
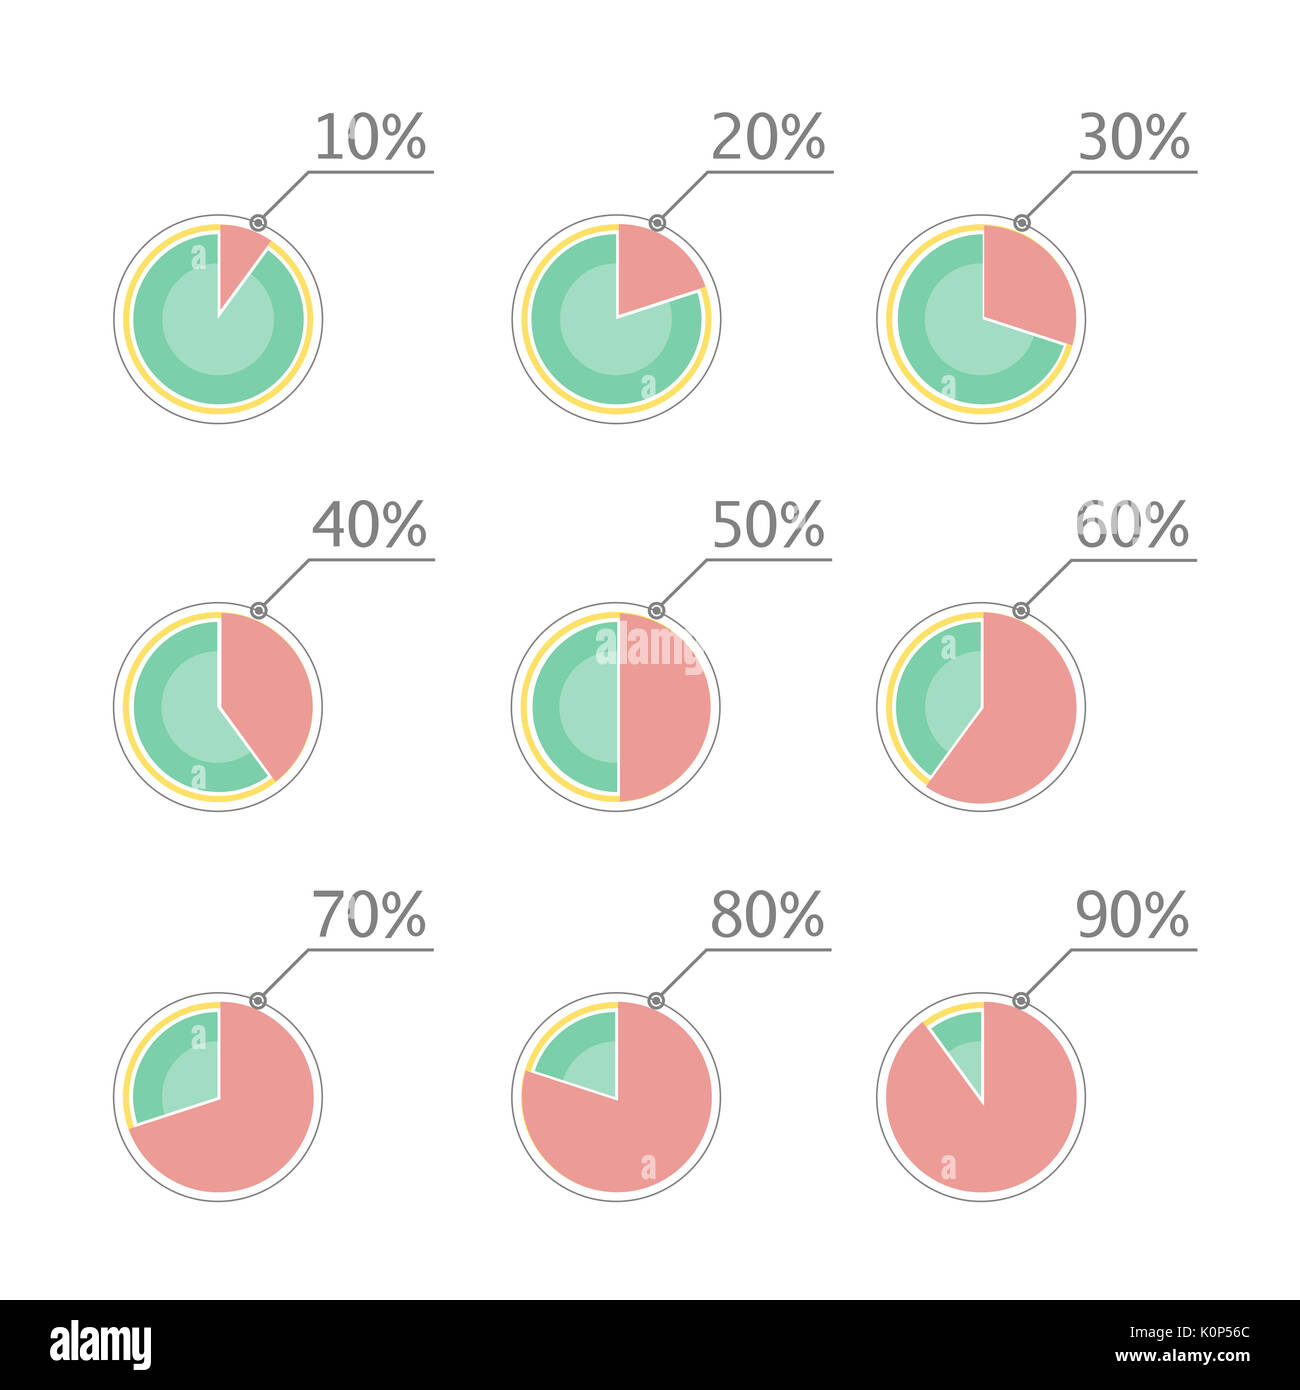 Pie chart statistic concept. Business flow process diagram. Infographic elements for presentation. Percentage infographics. Stock Photohttps://www.alamy.com/image-license-details/?v=1https://www.alamy.com/pie-chart-statistic-concept-business-flow-process-diagram-infographic-image155380356.html
RFK0P56C–Pie chart statistic concept. Business flow process diagram. Infographic elements for presentation. Percentage infographics.
RF2XMY1R6–Pie chart collection. Circular data visualization. Black vector icons. Statistical graphic set.
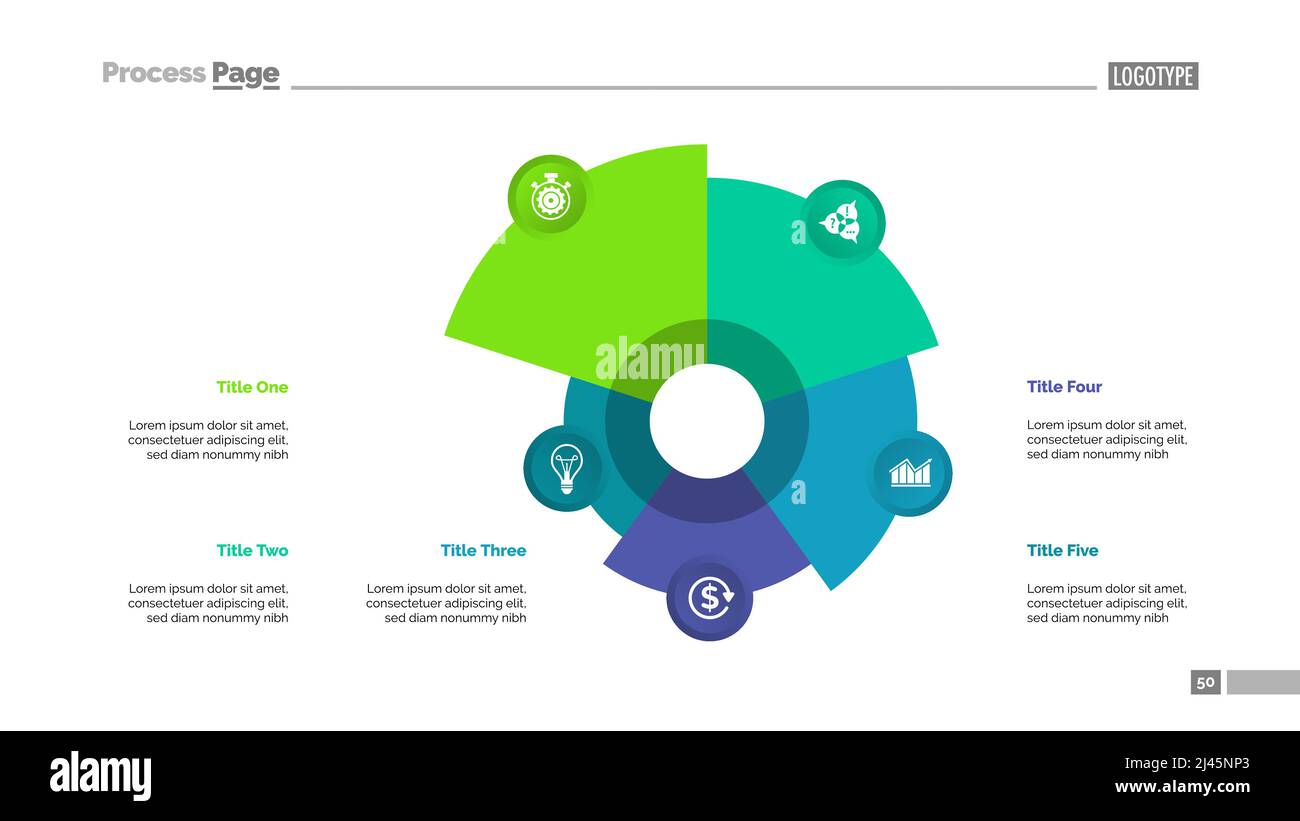 Pie chart with five elements. Comparison diagram, graph, layout. Creative concept for infographics, presentation, project, report. Can be used for top Stock Vectorhttps://www.alamy.com/image-license-details/?v=1https://www.alamy.com/pie-chart-with-five-elements-comparison-diagram-graph-layout-creative-concept-for-infographics-presentation-project-report-can-be-used-for-top-image467265403.html
RF2J45NP3–Pie chart with five elements. Comparison diagram, graph, layout. Creative concept for infographics, presentation, project, report. Can be used for top
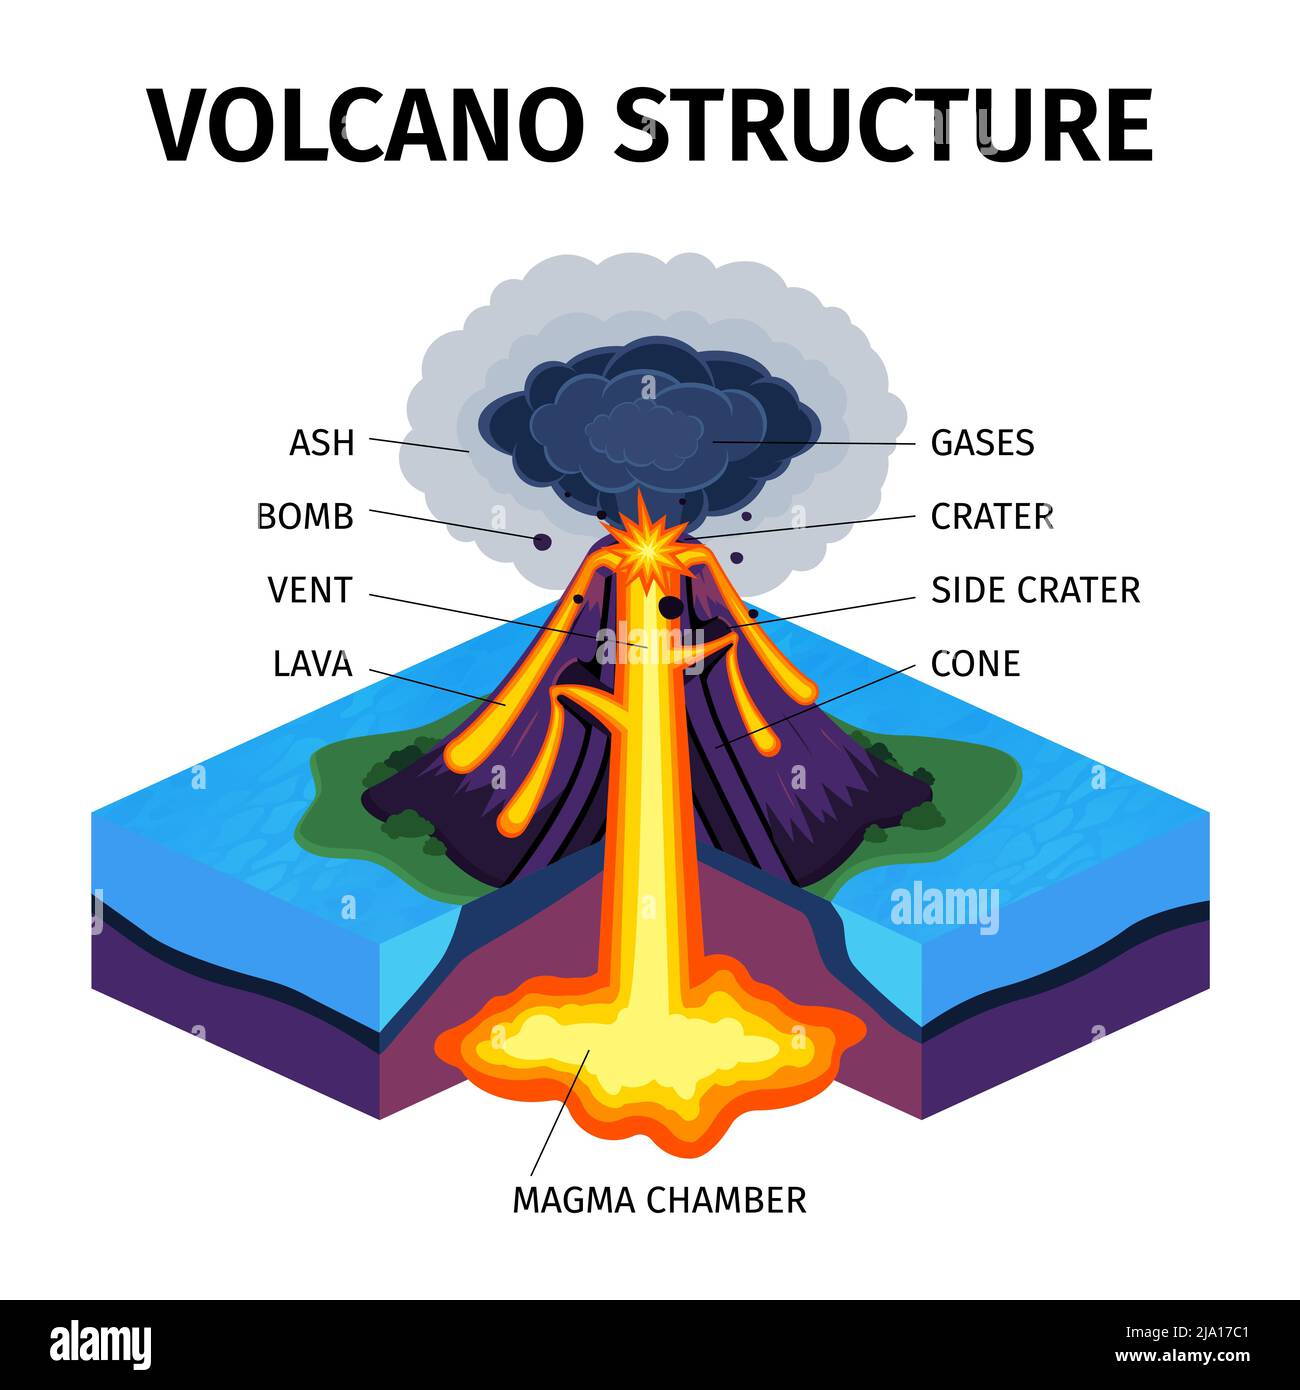 Cross section of volcano isometric diagram with indicating of magma chamber gases cone vent crater lava bomb ash vector illustration Stock Vectorhttps://www.alamy.com/image-license-details/?v=1https://www.alamy.com/cross-section-of-volcano-isometric-diagram-with-indicating-of-magma-chamber-gases-cone-vent-crater-lava-bomb-ash-vector-illustration-image470854273.html
RF2JA17C1–Cross section of volcano isometric diagram with indicating of magma chamber gases cone vent crater lava bomb ash vector illustration
RF2X99852–Chart pie round diagram with section business project market analysis report 3d icon realistic vector illustration. Circle graph accounting profit sal
RF2XHE5HN–Market share icon Vector symbol or sign set collection in black and white outline
 Set of circular sector percentage diagrams from 0 to 100 ready-to-use for web design, user interface (UI) or infographic - indicator with black Stock Vectorhttps://www.alamy.com/image-license-details/?v=1https://www.alamy.com/set-of-circular-sector-percentage-diagrams-from-0-to-100-ready-to-use-for-web-design-user-interface-ui-or-infographic-indicator-with-black-image177970139.html
RFM9F6MB–Set of circular sector percentage diagrams from 0 to 100 ready-to-use for web design, user interface (UI) or infographic - indicator with black
 Pie chart research, infographic business presentation vector illustration. Cartoon tiny people with calculator, laptop and tablet work on analysis of Stock Vectorhttps://www.alamy.com/image-license-details/?v=1https://www.alamy.com/pie-chart-research-infographic-business-presentation-vector-illustration-cartoon-tiny-people-with-calculator-laptop-and-tablet-work-on-analysis-of-image590723970.html
RF2W91PCJ–Pie chart research, infographic business presentation vector illustration. Cartoon tiny people with calculator, laptop and tablet work on analysis of
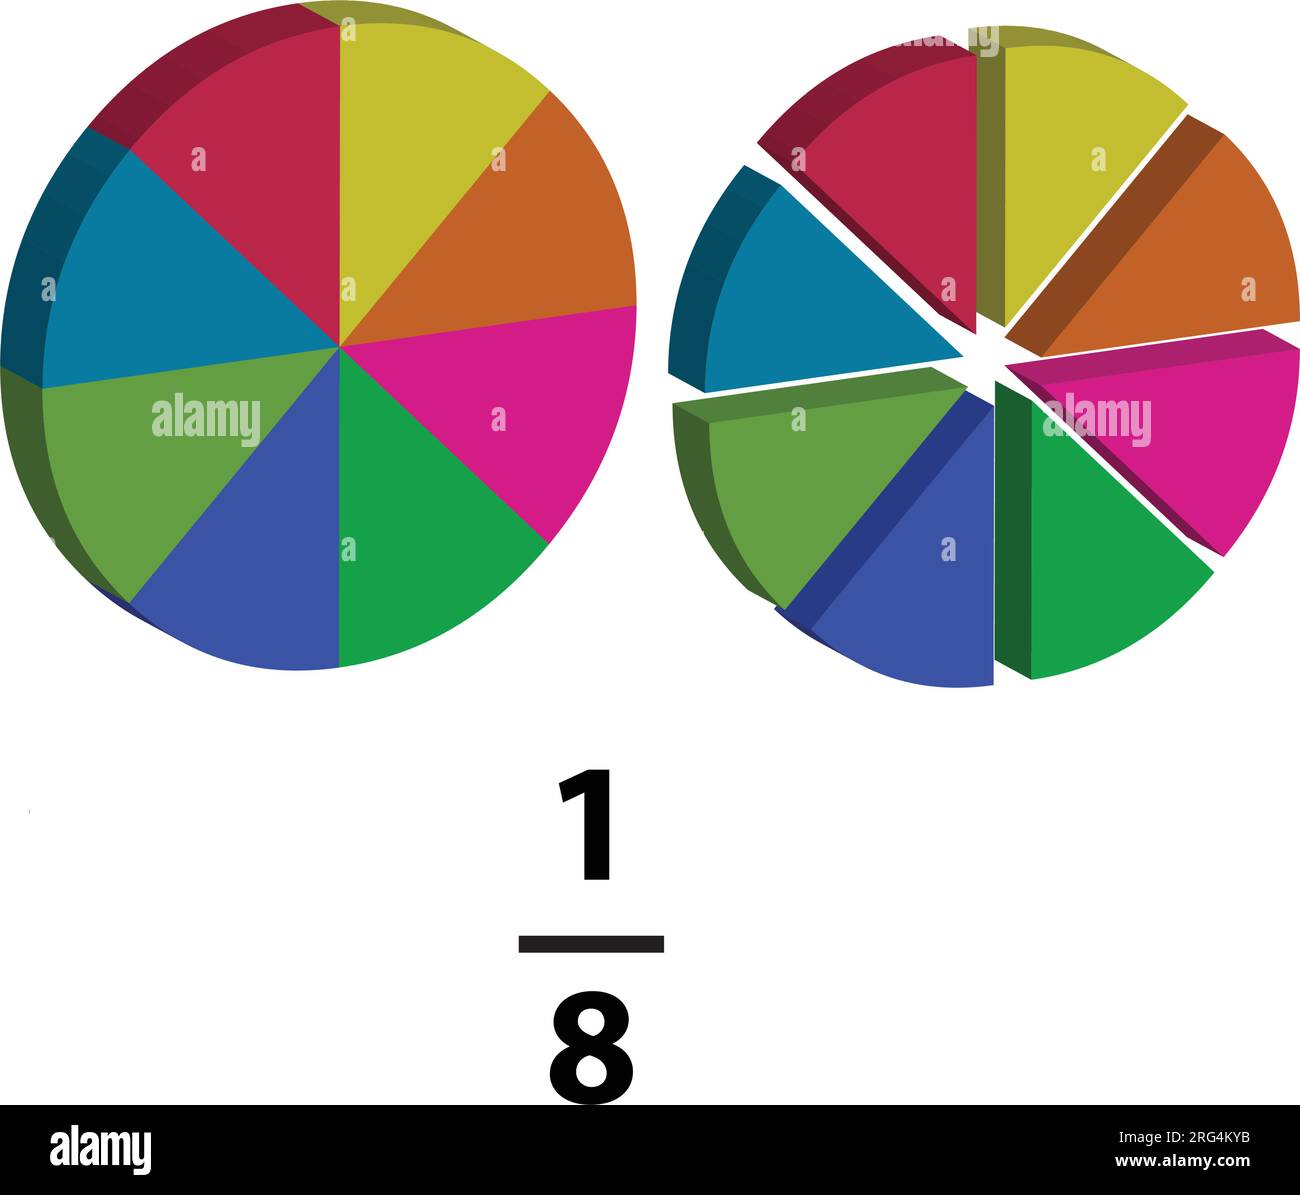 A fraction pie is divided into a one-eighth slice, each showing math fractions, explained in mathematics. on a white background. Stock Vectorhttps://www.alamy.com/image-license-details/?v=1https://www.alamy.com/a-fraction-pie-is-divided-into-a-one-eighth-slice-each-showing-math-fractions-explained-in-mathematics-on-a-white-background-image560669743.html
RF2RG4KYB–A fraction pie is divided into a one-eighth slice, each showing math fractions, explained in mathematics. on a white background.
 3d render color chart with quarter section in blue circle. 3d rendering color chart with quarter. 3d render chart with quarter section illustration in Stock Photohttps://www.alamy.com/image-license-details/?v=1https://www.alamy.com/3d-render-color-chart-with-quarter-section-in-blue-circle-3d-rendering-color-chart-with-quarter-3d-render-chart-with-quarter-section-illustration-in-image470354544.html
RF2J96E0G–3d render color chart with quarter section in blue circle. 3d rendering color chart with quarter. 3d render chart with quarter section illustration in
 dice and backdoor Stock Photohttps://www.alamy.com/image-license-details/?v=1https://www.alamy.com/stock-image-dice-and-backdoor-168981255.html
RFKPWN8R–dice and backdoor
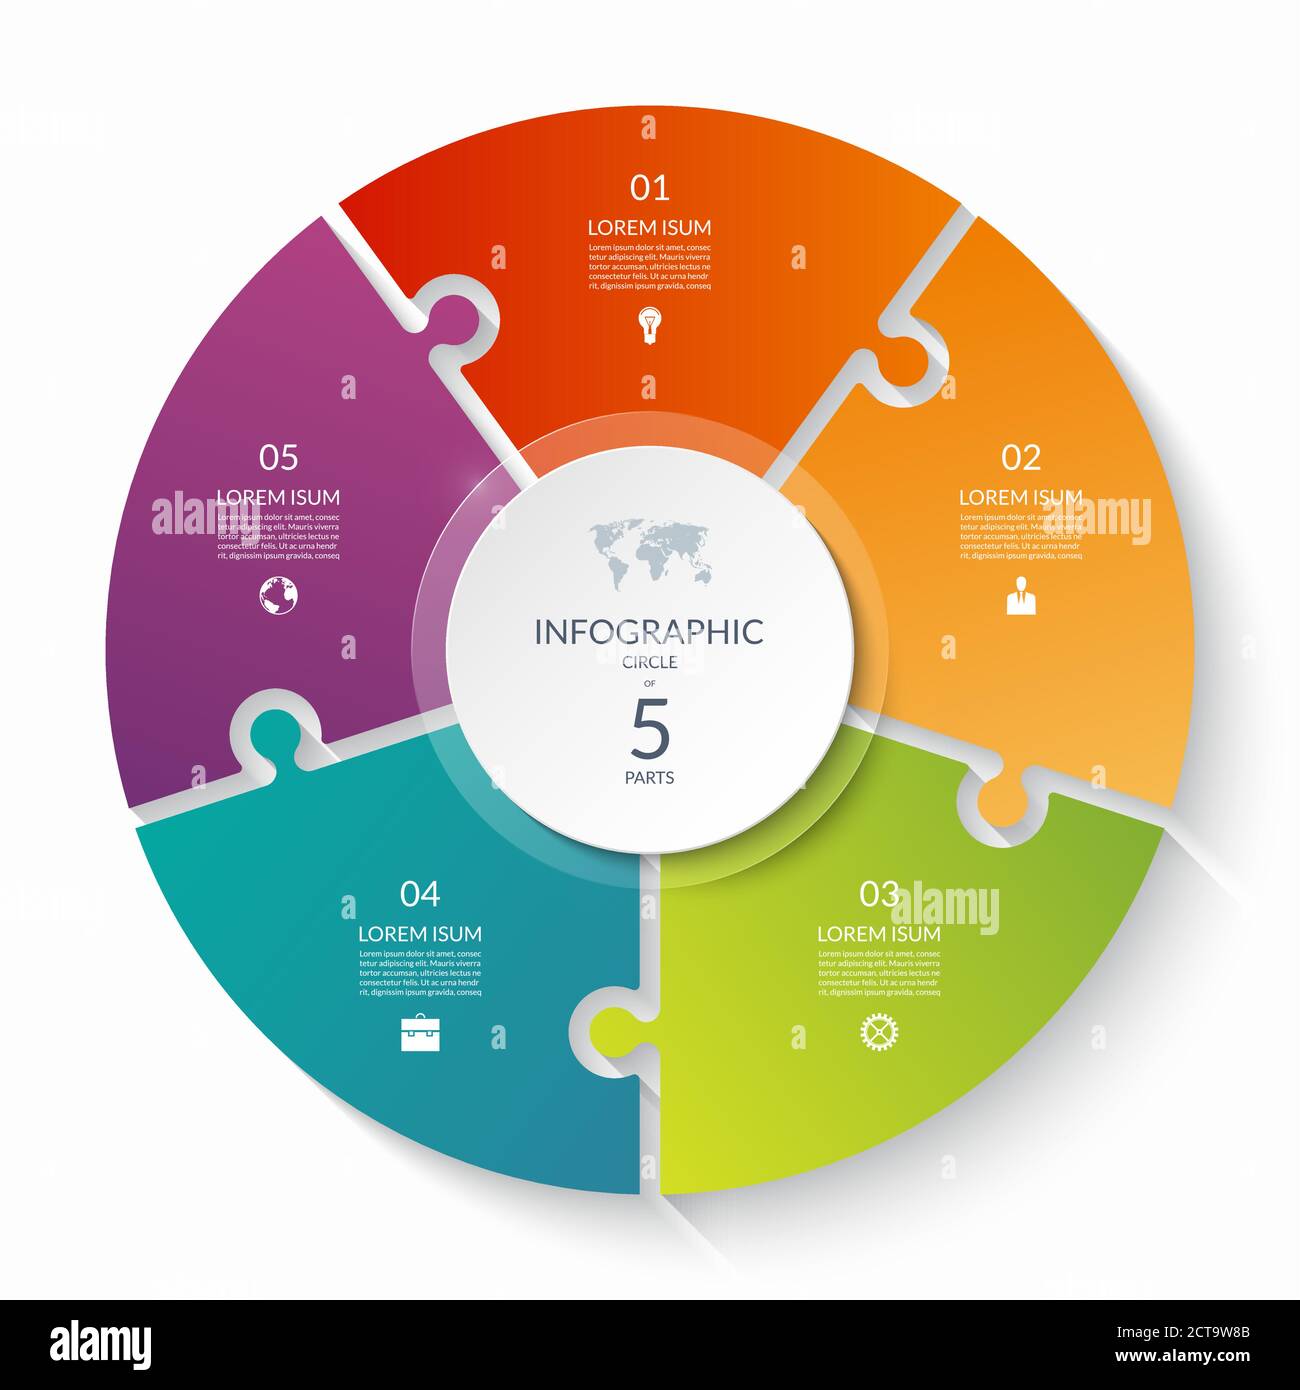 Puzzle infographic circle with 5 steps, options, pieces. Five-part cycle chart. Can be used for diagram, graph, report, presentation, web design. Stock Vectorhttps://www.alamy.com/image-license-details/?v=1https://www.alamy.com/puzzle-infographic-circle-with-5-steps-options-pieces-five-part-cycle-chart-can-be-used-for-diagram-graph-report-presentation-web-design-image376386875.html
RF2CT9W8B–Puzzle infographic circle with 5 steps, options, pieces. Five-part cycle chart. Can be used for diagram, graph, report, presentation, web design.
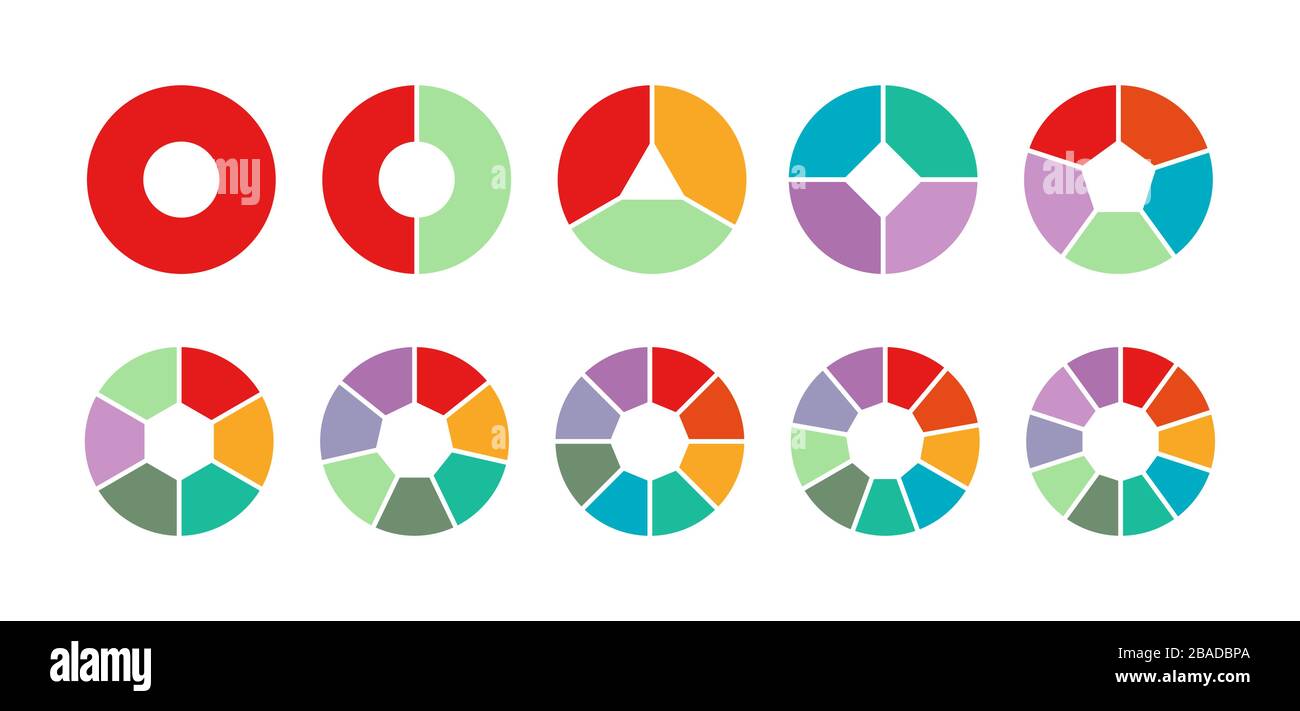 set of colored pie charts for 1,2,3,4,5,6,7,8,9,10 steps or sections to illustrate a business plan, infographic, reporting. Simple design, stock vecto Stock Vectorhttps://www.alamy.com/image-license-details/?v=1https://www.alamy.com/set-of-colored-pie-charts-for-12345678910-steps-or-sections-to-illustrate-a-business-plan-infographic-reporting-simple-design-stock-vecto-image350648546.html
RF2BADBPA–set of colored pie charts for 1,2,3,4,5,6,7,8,9,10 steps or sections to illustrate a business plan, infographic, reporting. Simple design, stock vecto
 Black and white detalized pie chart poster. Vector illustration for report, web site or application Stock Vectorhttps://www.alamy.com/image-license-details/?v=1https://www.alamy.com/black-and-white-detalized-pie-chart-poster-vector-illustration-for-report-web-site-or-application-image455780730.html
RF2HDEGY6–Black and white detalized pie chart poster. Vector illustration for report, web site or application
 Infographic pie chart. Cycle presentation diagram 8 section. Vector isolated on white background . Stock Vectorhttps://www.alamy.com/image-license-details/?v=1https://www.alamy.com/infographic-pie-chart-cycle-presentation-diagram-8-section-vector-isolated-on-white-background-image465759436.html
RF2J1N4WG–Infographic pie chart. Cycle presentation diagram 8 section. Vector isolated on white background .
 Cycle diagram. 3 step circle infographic elements, round business progress logo, colorful emblem and presentation graphic. Vector set Stock Vectorhttps://www.alamy.com/image-license-details/?v=1https://www.alamy.com/cycle-diagram-3-step-circle-infographic-elements-round-business-progress-logo-colorful-emblem-and-presentation-graphic-vector-set-image469635155.html
RF2J81MC3–Cycle diagram. 3 step circle infographic elements, round business progress logo, colorful emblem and presentation graphic. Vector set
 Half pie infographic chart design template Stock Vectorhttps://www.alamy.com/image-license-details/?v=1https://www.alamy.com/half-pie-infographic-chart-design-template-image555779219.html
RF2R85X1R–Half pie infographic chart design template
 3d pie chart graph is divided into parts. Realistic geometric infographic of 3 parts share for business presentation, design data finance, report. Bus Stock Vectorhttps://www.alamy.com/image-license-details/?v=1https://www.alamy.com/3d-pie-chart-graph-is-divided-into-parts-realistic-geometric-infographic-of-3-parts-share-for-business-presentation-design-data-finance-report-bus-image475297082.html
RF2JH7J7P–3d pie chart graph is divided into parts. Realistic geometric infographic of 3 parts share for business presentation, design data finance, report. Bus
RF2WNP3P6–Set of circle percentage diagrams for infographics, round graphic pie charts icons
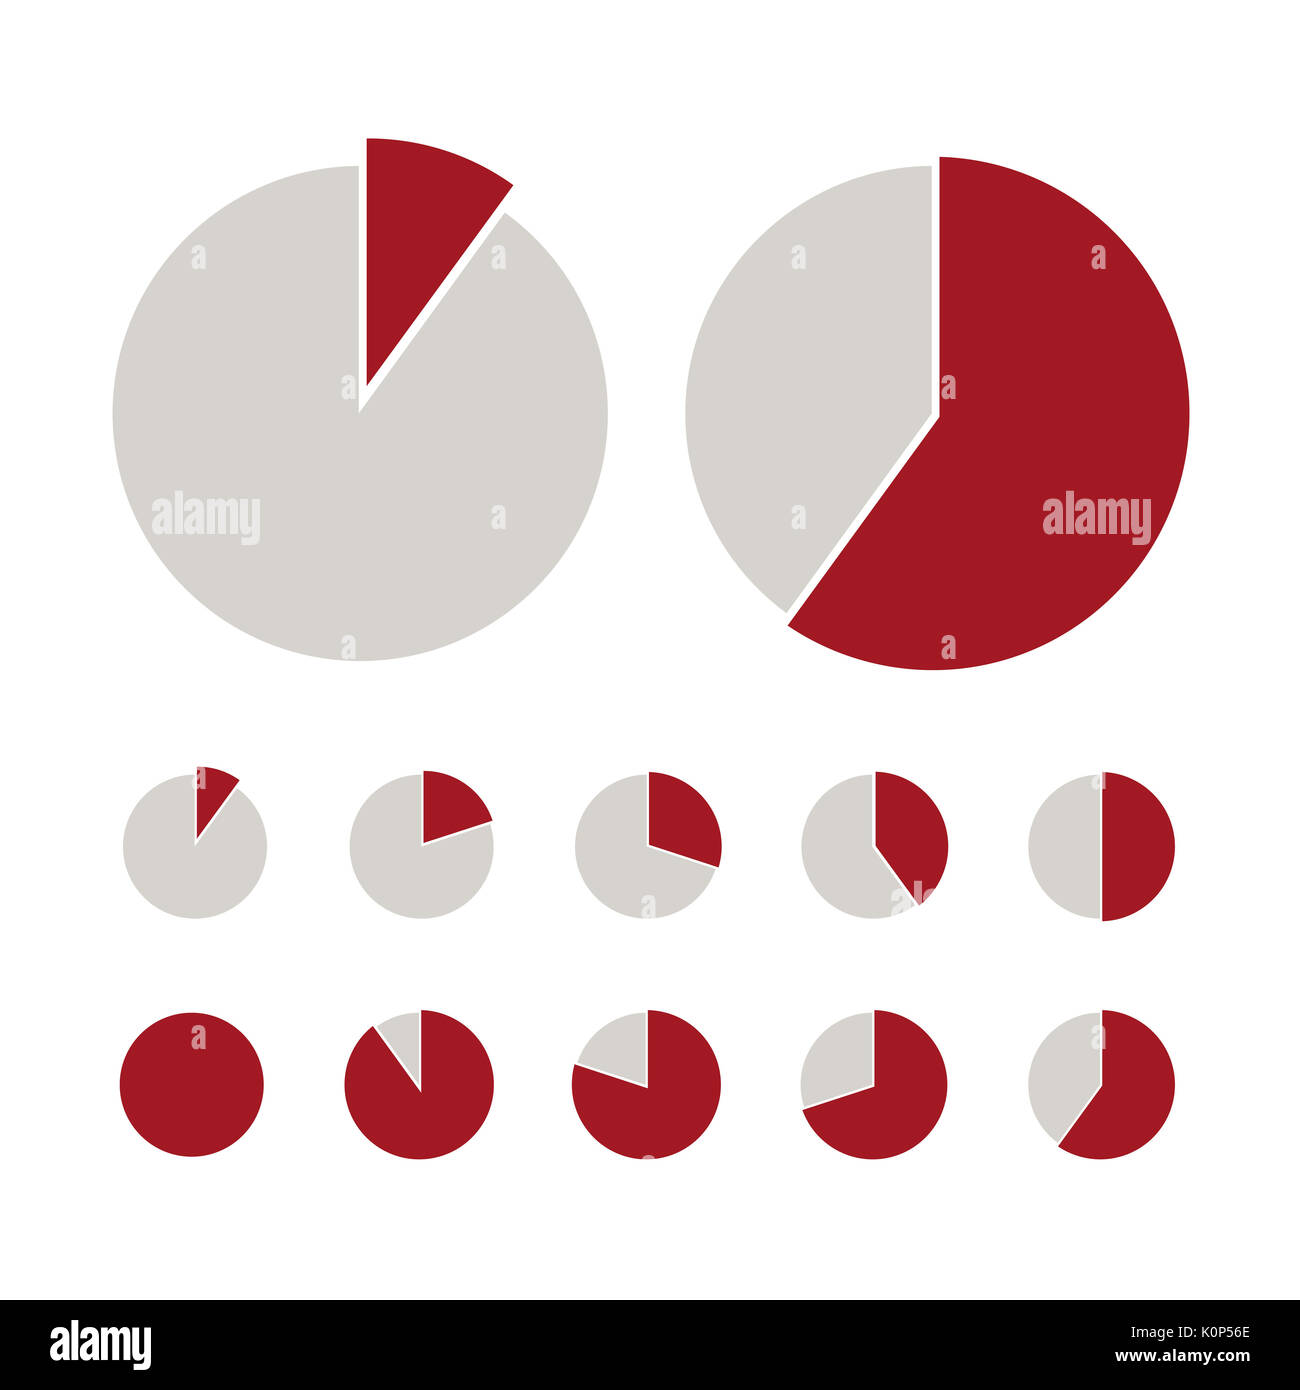 Pie chart statistic concept. Business flow process diagram. Infographic elements for presentation. Percentage infographics. Stock Photohttps://www.alamy.com/image-license-details/?v=1https://www.alamy.com/pie-chart-statistic-concept-business-flow-process-diagram-infographic-image155380358.html
RFK0P56E–Pie chart statistic concept. Business flow process diagram. Infographic elements for presentation. Percentage infographics.
 isolated brown stone pyramid and golden scale on white Stock Photohttps://www.alamy.com/image-license-details/?v=1https://www.alamy.com/isolated-brown-stone-pyramid-and-golden-scale-on-white-image361125803.html
RM2BYEKJ3–isolated brown stone pyramid and golden scale on white
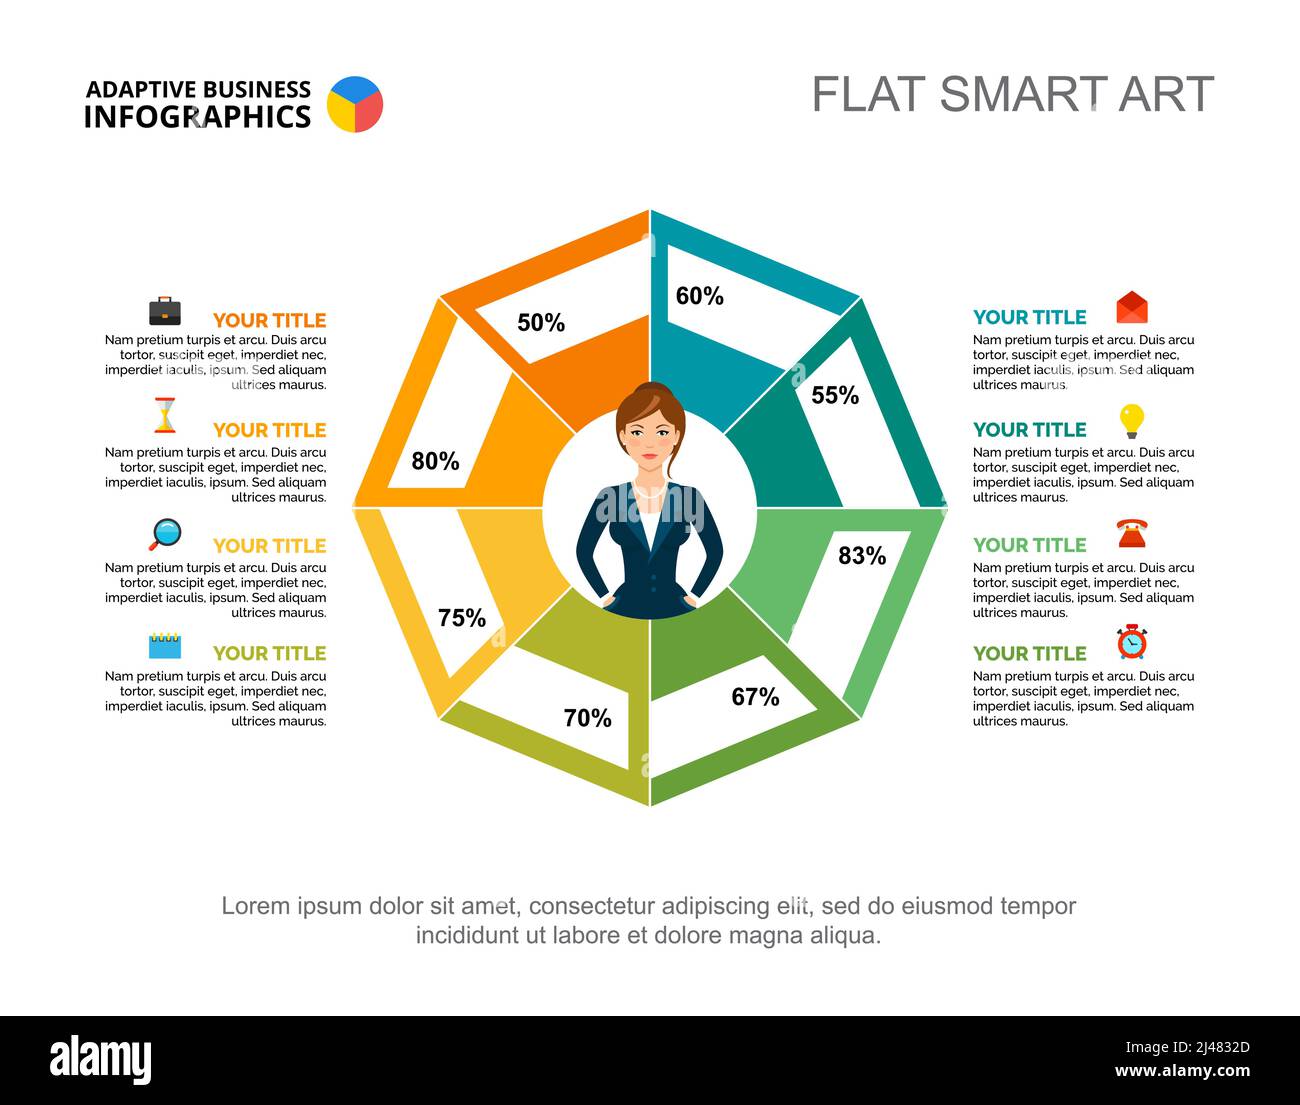 Business research chart slide template. Chart, design. Creative concept for infographic, report. Can be used for topics like statistics, survey, marke Stock Vectorhttps://www.alamy.com/image-license-details/?v=1https://www.alamy.com/business-research-chart-slide-template-chart-design-creative-concept-for-infographic-report-can-be-used-for-topics-like-statistics-survey-marke-image467316597.html
RF2J4832D–Business research chart slide template. Chart, design. Creative concept for infographic, report. Can be used for topics like statistics, survey, marke
 Layout workflow. Outline colorful menu for app interface. Number options. Web design of buttons elements. Infographics 1. 2. 3. vector template. Text illustration. Stock Vectorhttps://www.alamy.com/image-license-details/?v=1https://www.alamy.com/stock-photo-layout-workflow-outline-colorful-menu-for-app-interface-number-options-135385046.html
RFHT7906–Layout workflow. Outline colorful menu for app interface. Number options. Web design of buttons elements. Infographics 1. 2. 3. vector template. Text illustration.
RF2X9P6YH–Diagram pie circle chart piece section 3d realistic green pink and purple icons. Graph business analyzing report digital assembling network interface
 . History of the United Co-operative Baking Society Ltd., a fifty years' record, 1869-1919. first eight ovens erectedwere gas fired, but at the June 1904 quarterly meeting thedirectors in their report had to admit that the results had notbeen what were expected, and it was possible that some changemight have to be made. The draw-plate ovens would be adistinct improvement if they could be made as steady andreliable as were the Scotch ovens, and Scottish engineers weredirecting their attention to this, the report stated. The difficultywith one section of the ovens continued, however, and beforel Stock Photohttps://www.alamy.com/image-license-details/?v=1https://www.alamy.com/history-of-the-united-co-operative-baking-society-ltd-a-fifty-years-record-1869-1919-first-eight-ovens-erectedwere-gas-fired-but-at-the-june-1904-quarterly-meeting-thedirectors-in-their-report-had-to-admit-that-the-results-had-notbeen-what-were-expected-and-it-was-possible-that-some-changemight-have-to-be-made-the-draw-plate-ovens-would-be-adistinct-improvement-if-they-could-be-made-as-steady-andreliable-as-were-the-scotch-ovens-and-scottish-engineers-weredirecting-their-attention-to-this-the-report-stated-the-difficultywith-one-section-of-the-ovens-continued-however-and-beforel-image336917535.html
RM2AG3WN3–. History of the United Co-operative Baking Society Ltd., a fifty years' record, 1869-1919. first eight ovens erectedwere gas fired, but at the June 1904 quarterly meeting thedirectors in their report had to admit that the results had notbeen what were expected, and it was possible that some changemight have to be made. The draw-plate ovens would be adistinct improvement if they could be made as steady andreliable as were the Scotch ovens, and Scottish engineers weredirecting their attention to this, the report stated. The difficultywith one section of the ovens continued, however, and beforel
 Set of circular sector percentage diagrams from 0 to 100 ready-to-use for web design, user interface (UI) or infographic - indicator with pink Stock Photohttps://www.alamy.com/image-license-details/?v=1https://www.alamy.com/set-of-circular-sector-percentage-diagrams-from-0-to-100-ready-to-image159072163.html
RFK6PA4K–Set of circular sector percentage diagrams from 0 to 100 ready-to-use for web design, user interface (UI) or infographic - indicator with pink
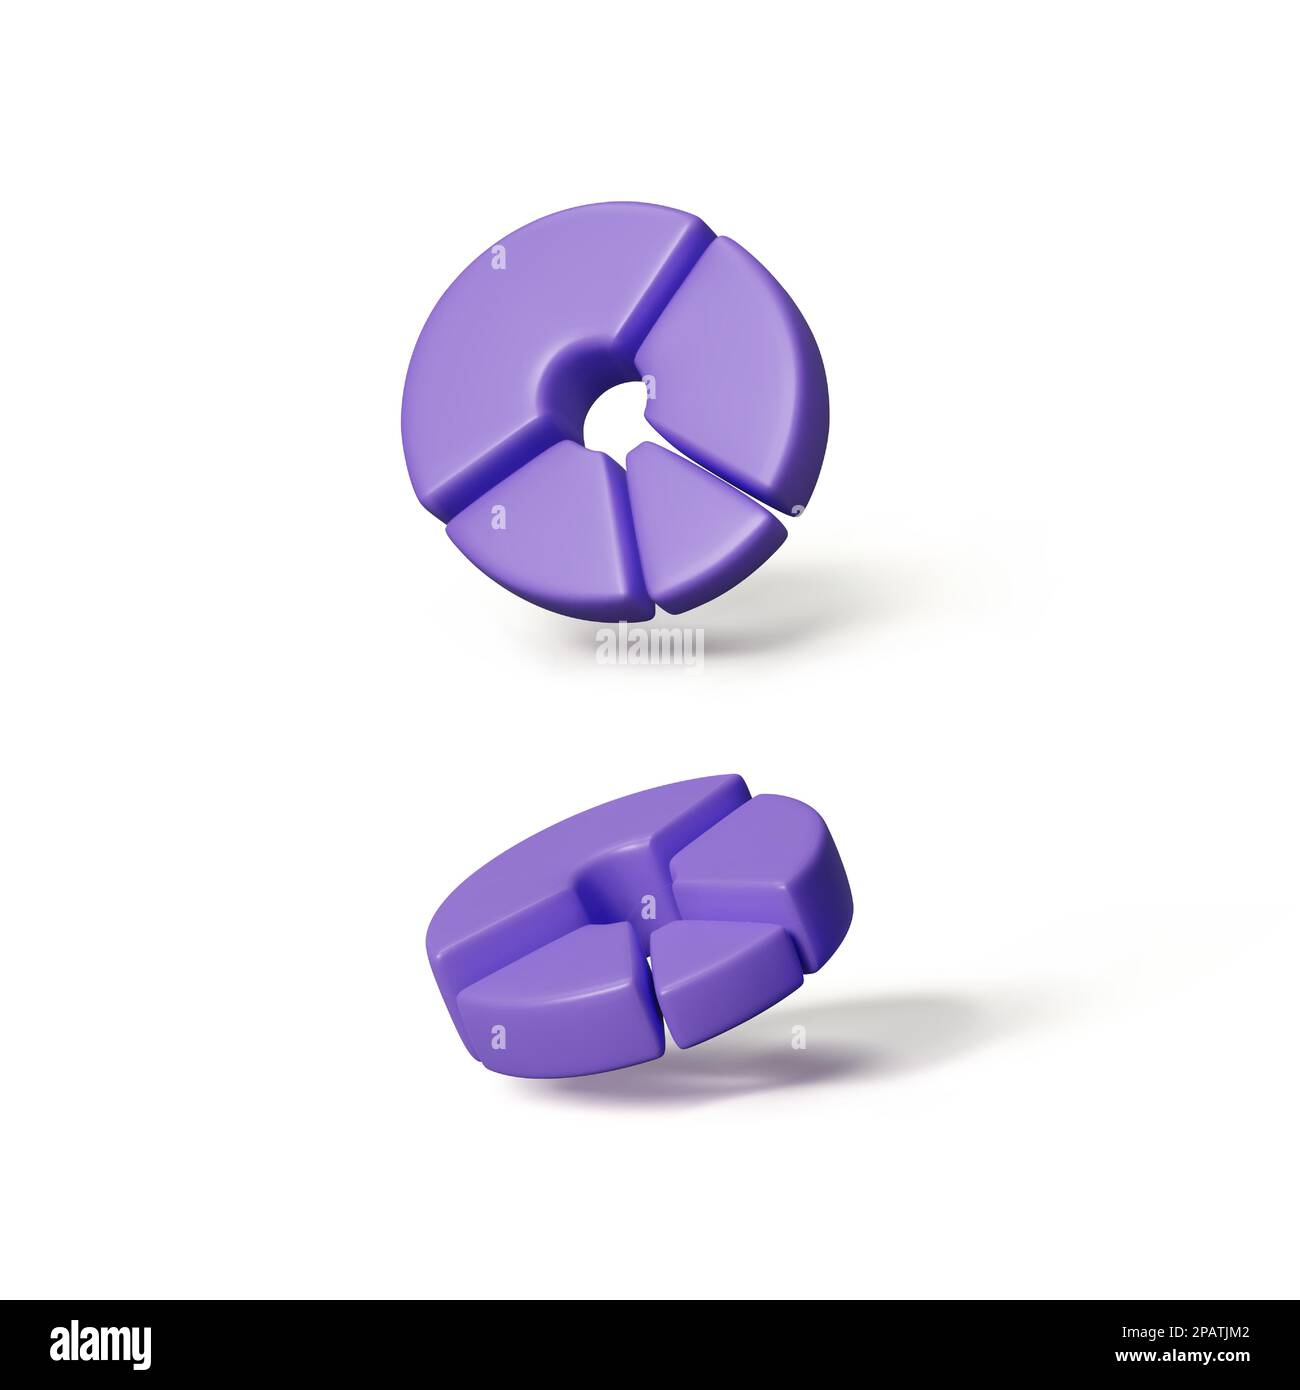 Donat chart in 3D realistic style. Circular diagram for infographic visualization. Pie chart in purple color. Vector Stock Vectorhttps://www.alamy.com/image-license-details/?v=1https://www.alamy.com/donat-chart-in-3d-realistic-style-circular-diagram-for-infographic-visualization-pie-chart-in-purple-color-vector-image540209490.html
RF2PATJM2–Donat chart in 3D realistic style. Circular diagram for infographic visualization. Pie chart in purple color. Vector
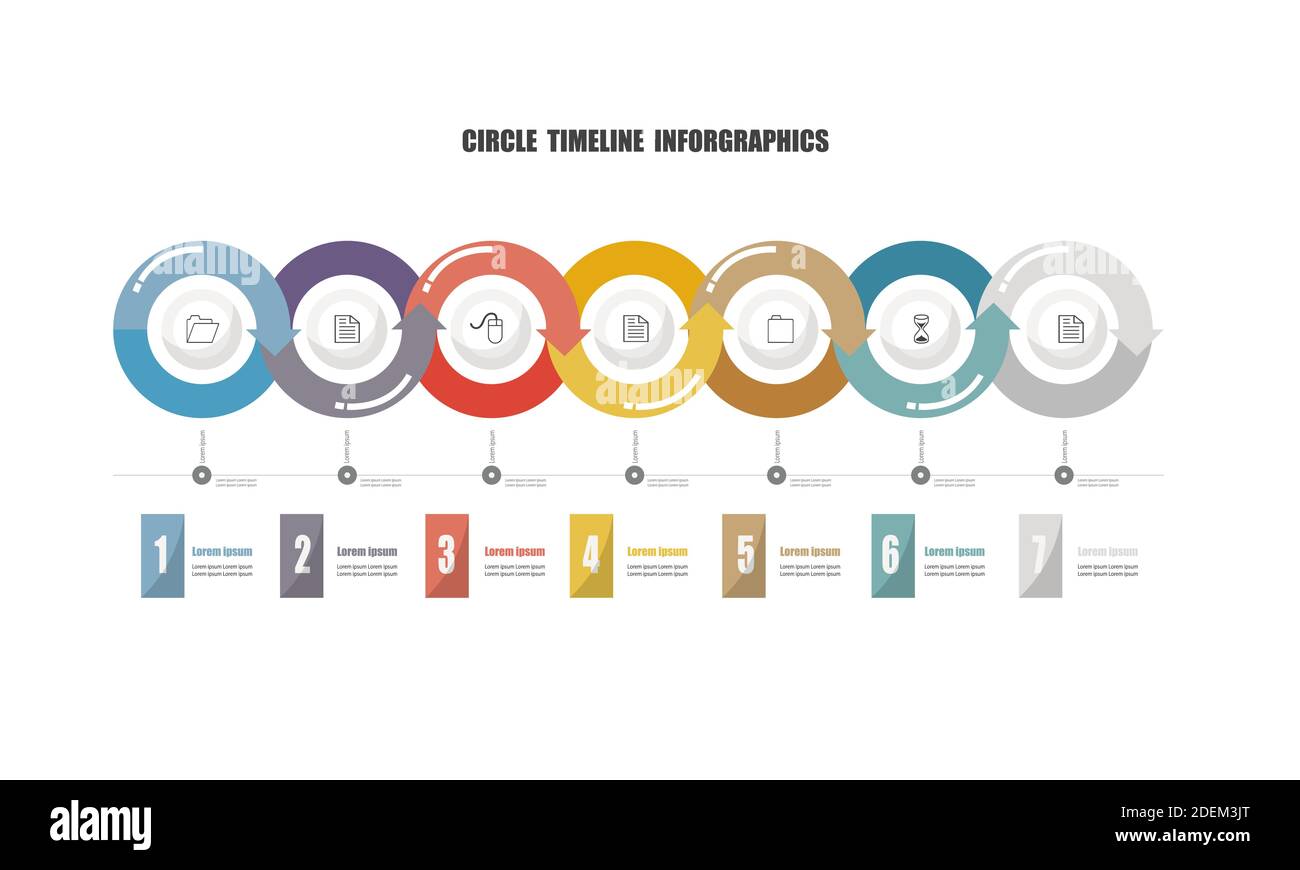 Circle timeline infographic vector illustration Stock Vectorhttps://www.alamy.com/image-license-details/?v=1https://www.alamy.com/circle-timeline-infographic-vector-illustration-image387675200.html
RF2DEM3JT–Circle timeline infographic vector illustration
RF2RNF0NW–Pie chart icon. Data statistics. Color infographic symbol
 strategy, chart, model, design, project, concept, plan, draft, graphic, stock Stock Photohttps://www.alamy.com/image-license-details/?v=1https://www.alamy.com/stock-photo-strategy-chart-model-design-project-concept-plan-draft-graphic-stock-143321695.html
RFJ94T7Y–strategy, chart, model, design, project, concept, plan, draft, graphic, stock
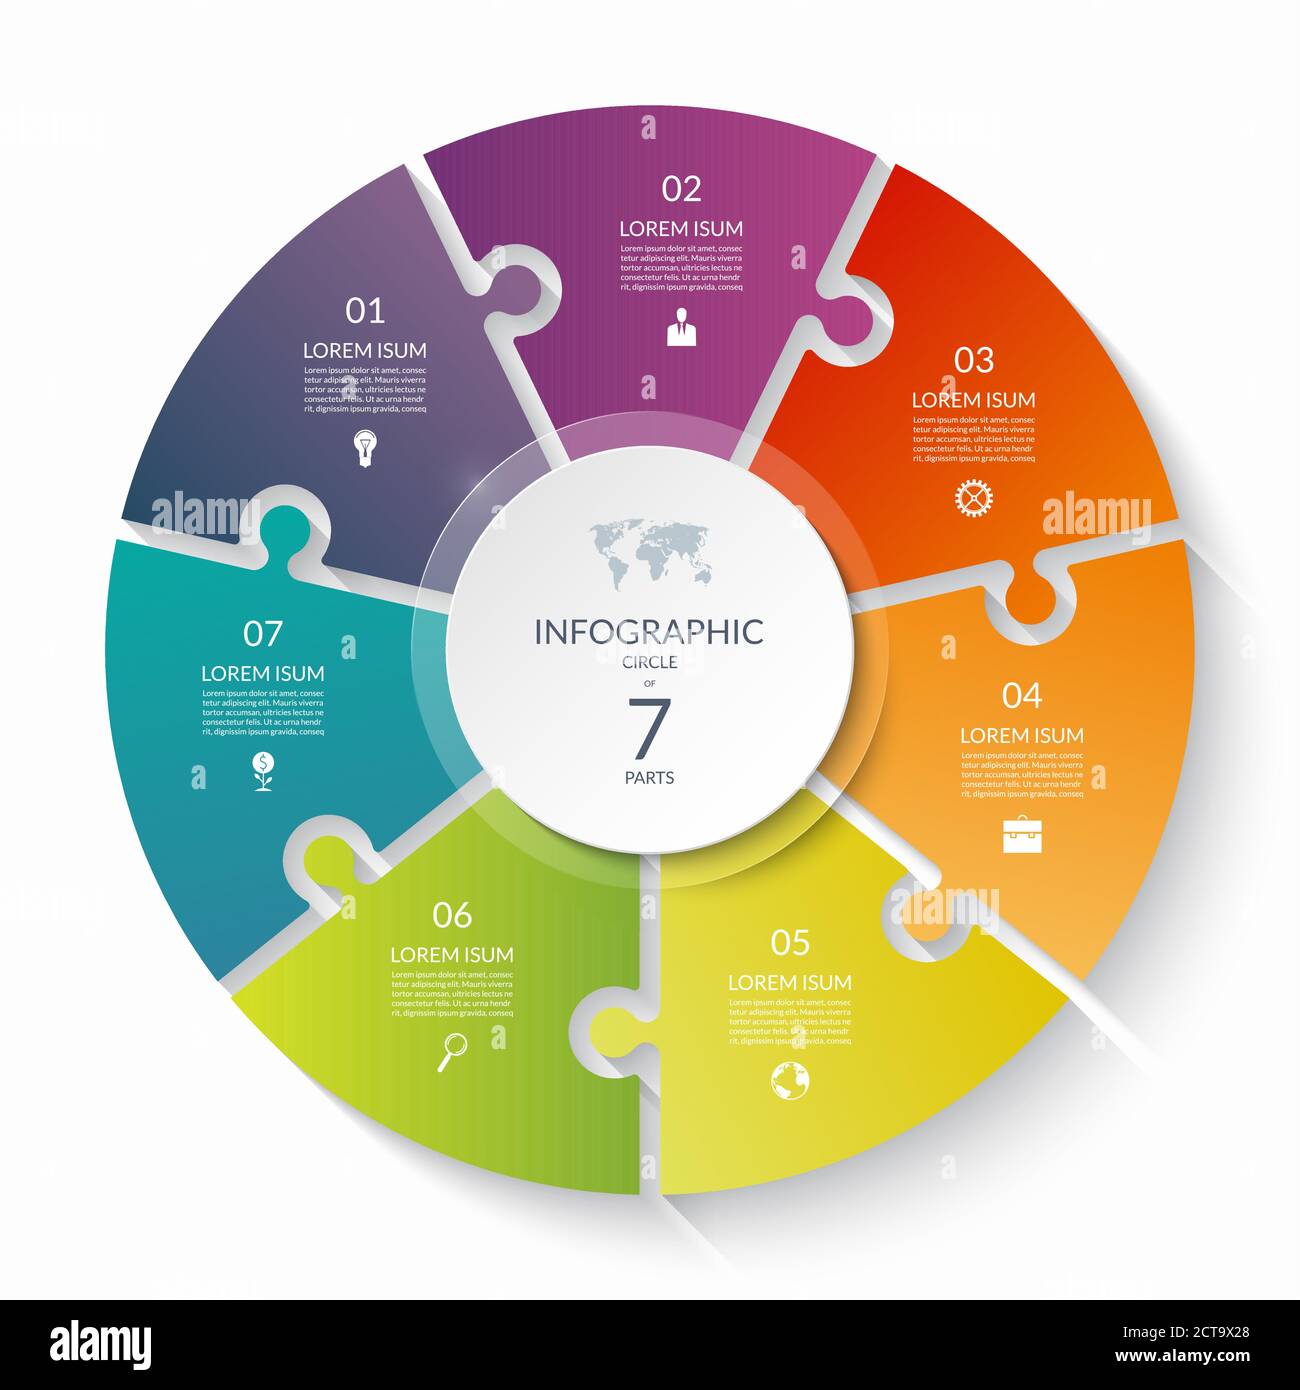 Puzzle infographic circle with 7 steps, options, pieces. Seven-part cycle chart. Can be used for diagram, graph, report, presentation, web design. Stock Vectorhttps://www.alamy.com/image-license-details/?v=1https://www.alamy.com/puzzle-infographic-circle-with-7-steps-options-pieces-seven-part-cycle-chart-can-be-used-for-diagram-graph-report-presentation-web-design-image376387488.html
RF2CT9X28–Puzzle infographic circle with 7 steps, options, pieces. Seven-part cycle chart. Can be used for diagram, graph, report, presentation, web design.
 Set of color pie charts for 5, 6, 7 steps or sections to illustrate a business plan, infographic, reporting. Simple design, stock vector illustration. Stock Vectorhttps://www.alamy.com/image-license-details/?v=1https://www.alamy.com/set-of-color-pie-charts-for-5-6-7-steps-or-sections-to-illustrate-a-business-plan-infographic-reporting-simple-design-stock-vector-illustration-image350844255.html
RF2BAP9BY–Set of color pie charts for 5, 6, 7 steps or sections to illustrate a business plan, infographic, reporting. Simple design, stock vector illustration.
 Line art black and white detalized pie chart. Vector illustration for report, web site or application Stock Vectorhttps://www.alamy.com/image-license-details/?v=1https://www.alamy.com/line-art-black-and-white-detalized-pie-chart-vector-illustration-for-report-web-site-or-application-image450772555.html
RF2H5ACYR–Line art black and white detalized pie chart. Vector illustration for report, web site or application
 Infographic pie chart. Cycle presentation diagram 4 section. Vector isolated on white background . Stock Vectorhttps://www.alamy.com/image-license-details/?v=1https://www.alamy.com/infographic-pie-chart-cycle-presentation-diagram-4-section-vector-isolated-on-white-background-image446020913.html
RF2GWJ069–Infographic pie chart. Cycle presentation diagram 4 section. Vector isolated on white background .
 Cycle diagram. 3 step circle infographic elements, round business progress logo, colorful emblem and presentation graphic. Vector set Stock Vectorhttps://www.alamy.com/image-license-details/?v=1https://www.alamy.com/cycle-diagram-3-step-circle-infographic-elements-round-business-progress-logo-colorful-emblem-and-presentation-graphic-vector-set-image469636861.html
RF2J81PH1–Cycle diagram. 3 step circle infographic elements, round business progress logo, colorful emblem and presentation graphic. Vector set
 Donut infographic chart design template with sections Stock Vectorhttps://www.alamy.com/image-license-details/?v=1https://www.alamy.com/donut-infographic-chart-design-template-with-sections-image555951704.html
RF2R8DP20–Donut infographic chart design template with sections
 3d pie chart graph is divided into parts. Realistic geometric infographic of 3 parts share for business presentation, design data finance, report. Bus Stock Vectorhttps://www.alamy.com/image-license-details/?v=1https://www.alamy.com/3d-pie-chart-graph-is-divided-into-parts-realistic-geometric-infographic-of-3-parts-share-for-business-presentation-design-data-finance-report-bus-image475268110.html
RF2JH6992–3d pie chart graph is divided into parts. Realistic geometric infographic of 3 parts share for business presentation, design data finance, report. Bus
RF2WNP50C–Set of colorful round graphic pie charts icons. Segment of circle infographic collection
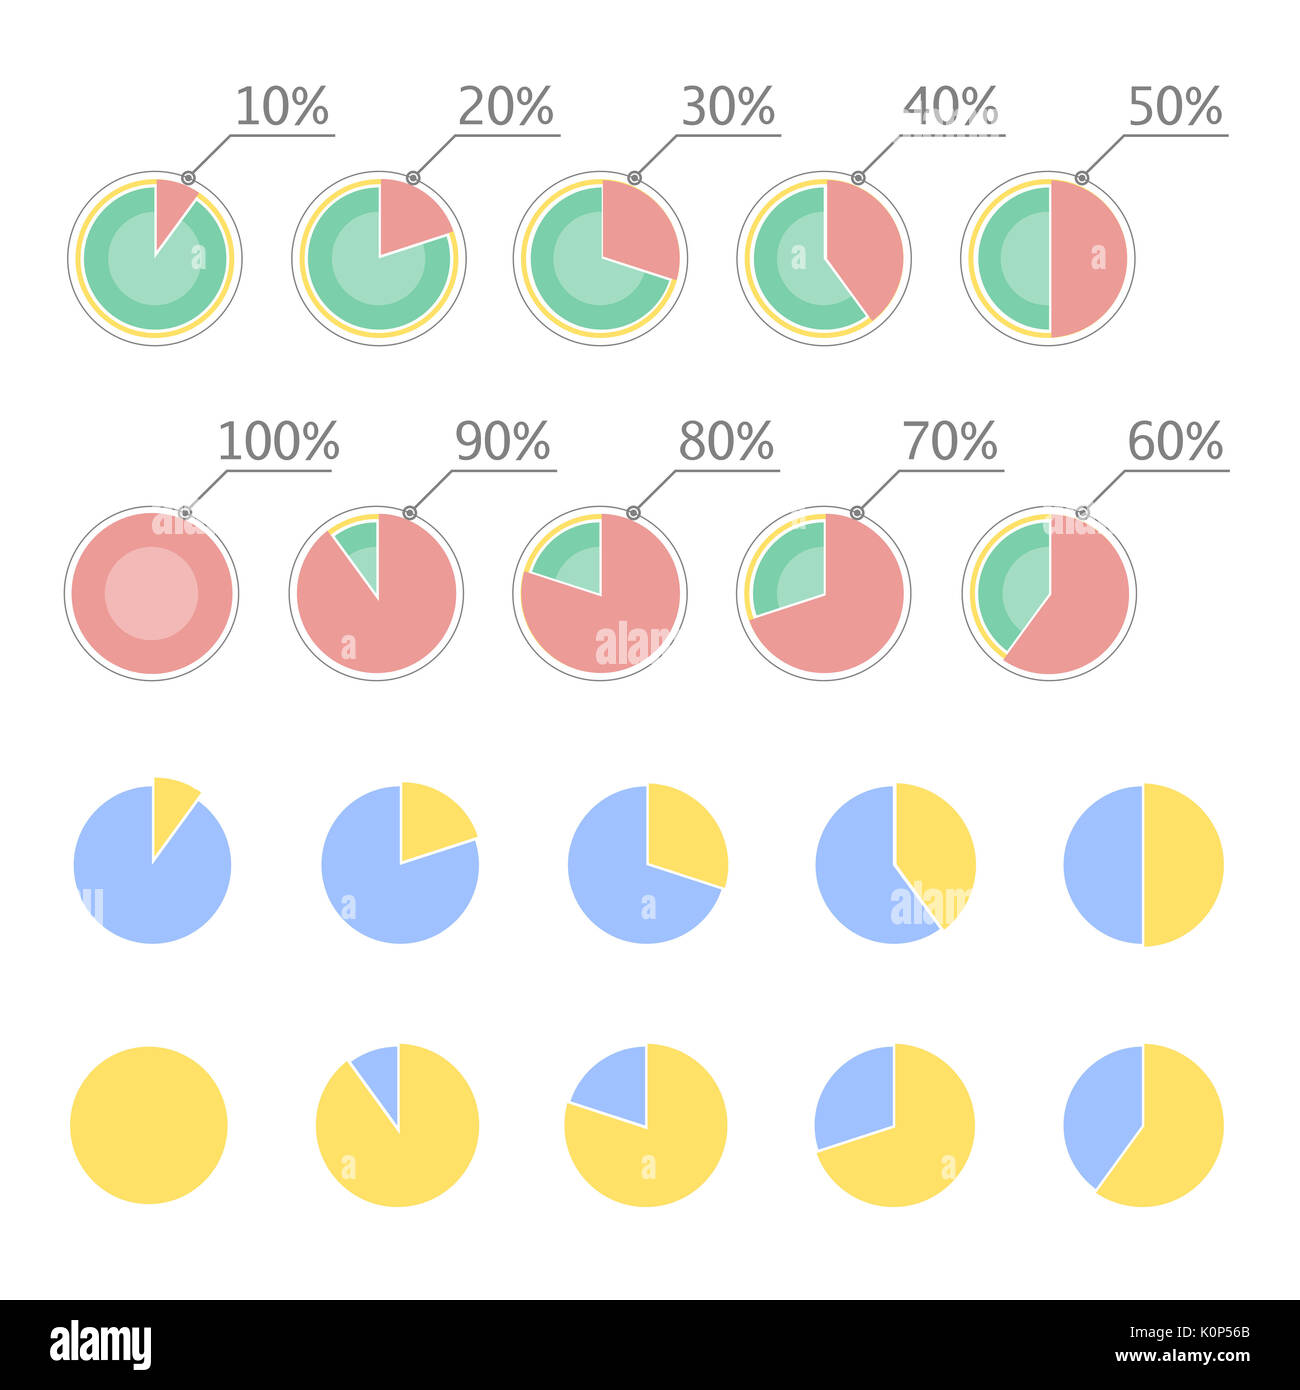 Pie chart statistic concept. Business flow process diagram. Infographic elements for presentation. Percentage infographics. Stock Photohttps://www.alamy.com/image-license-details/?v=1https://www.alamy.com/pie-chart-statistic-concept-business-flow-process-diagram-infographic-image155380355.html
RFK0P56B–Pie chart statistic concept. Business flow process diagram. Infographic elements for presentation. Percentage infographics.
 isolated brown stone pyramid on white Stock Photohttps://www.alamy.com/image-license-details/?v=1https://www.alamy.com/isolated-brown-stone-pyramid-on-white-image361160553.html
RM2BYG7Y5–isolated brown stone pyramid on white
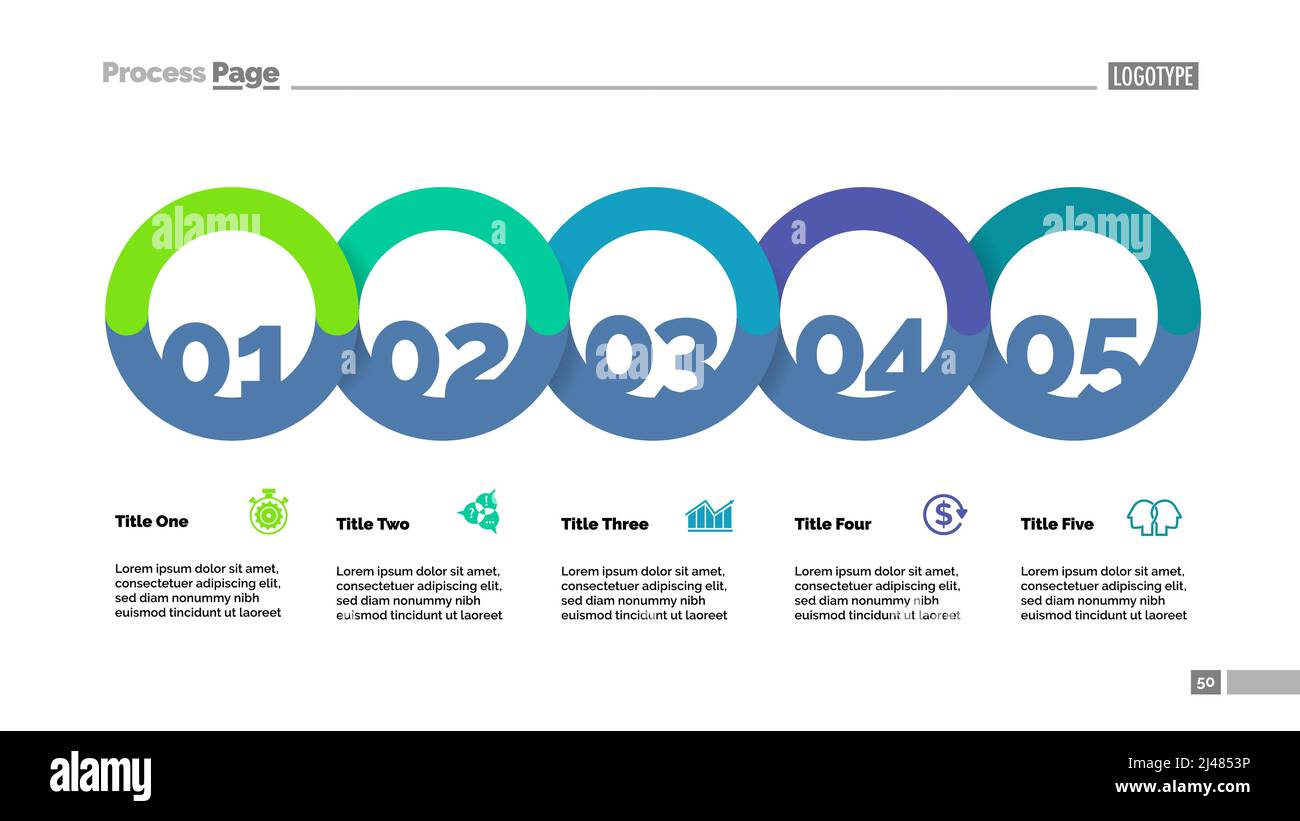 Five circle flowchart with description slide template. Business data. Graph, diagram, design. Creative concept for infographic, report. Can be used fo Stock Vectorhttps://www.alamy.com/image-license-details/?v=1https://www.alamy.com/five-circle-flowchart-with-description-slide-template-business-data-graph-diagram-design-creative-concept-for-infographic-report-can-be-used-fo-image467318202.html
RF2J4853P–Five circle flowchart with description slide template. Business data. Graph, diagram, design. Creative concept for infographic, report. Can be used fo
 Layout workflow. Outline colorful menu for app interface. Number options. Web design of buttons elements. Infographics 1. 2. 3. vector template. Text illustration. Stock Vectorhttps://www.alamy.com/image-license-details/?v=1https://www.alamy.com/stock-photo-layout-workflow-outline-colorful-menu-for-app-interface-number-options-135385070.html
RFHT7912–Layout workflow. Outline colorful menu for app interface. Number options. Web design of buttons elements. Infographics 1. 2. 3. vector template. Text illustration.
RF2X9NEPN–Diagram pie circle chart piece section 3d realistic blue purple and green icons. Graph business analyzing report digital assembling network interface
 Health education and the nutrition class, a report of the Bureau of educational experiments; descriptive and educational sections . 13-20% underweight (Section3). These sections contain 8, 20, and 9 cases respect-ively, the first and third each comprising approxi-mately 25% of the entire group. Only those childrenare included for whom we had weighings in October,February, and June. In Chart 5, we have plotted the averages for thesesections; it is evident that there is a close corre-spondence between Section 2 and Section 3 both intheir initial measurements and in gains in weightduring the time Stock Photohttps://www.alamy.com/image-license-details/?v=1https://www.alamy.com/health-education-and-the-nutrition-class-a-report-of-the-bureau-of-educational-experiments-descriptive-and-educational-sections-13-20-underweight-section3-these-sections-contain-8-20-and-9-cases-respect-ively-the-first-and-third-each-comprising-approxi-mately-25-of-the-entire-group-only-those-childrenare-included-for-whom-we-had-weighings-in-octoberfebruary-and-june-in-chart-5-we-have-plotted-the-averages-for-thesesections-it-is-evident-that-there-is-a-close-corre-spondence-between-section-2-and-section-3-both-intheir-initial-measurements-and-in-gains-in-weightduring-the-time-image342756543.html
RM2AWHWD3–Health education and the nutrition class, a report of the Bureau of educational experiments; descriptive and educational sections . 13-20% underweight (Section3). These sections contain 8, 20, and 9 cases respect-ively, the first and third each comprising approxi-mately 25% of the entire group. Only those childrenare included for whom we had weighings in October,February, and June. In Chart 5, we have plotted the averages for thesesections; it is evident that there is a close corre-spondence between Section 2 and Section 3 both intheir initial measurements and in gains in weightduring the time
 Set of semicircle percentage diagrams from 0 to 100 ready-to-use for web design, user interface (UI) or infographic - indicator with green Stock Vectorhttps://www.alamy.com/image-license-details/?v=1https://www.alamy.com/set-of-semicircle-percentage-diagrams-from-0-to-100-ready-to-use-for-web-design-user-interface-ui-or-infographic-indicator-with-green-image215839843.html
RFPF49WR–Set of semicircle percentage diagrams from 0 to 100 ready-to-use for web design, user interface (UI) or infographic - indicator with green
 Pie chart divided into sections. 3D render of circular diagram with reflection and shadow isolated on white background. Infographics data template. Ve Stock Vectorhttps://www.alamy.com/image-license-details/?v=1https://www.alamy.com/pie-chart-divided-into-sections-3d-render-of-circular-diagram-with-reflection-and-shadow-isolated-on-white-background-infographics-data-template-ve-image526941116.html
RF2NH86NG–Pie chart divided into sections. 3D render of circular diagram with reflection and shadow isolated on white background. Infographics data template. Ve
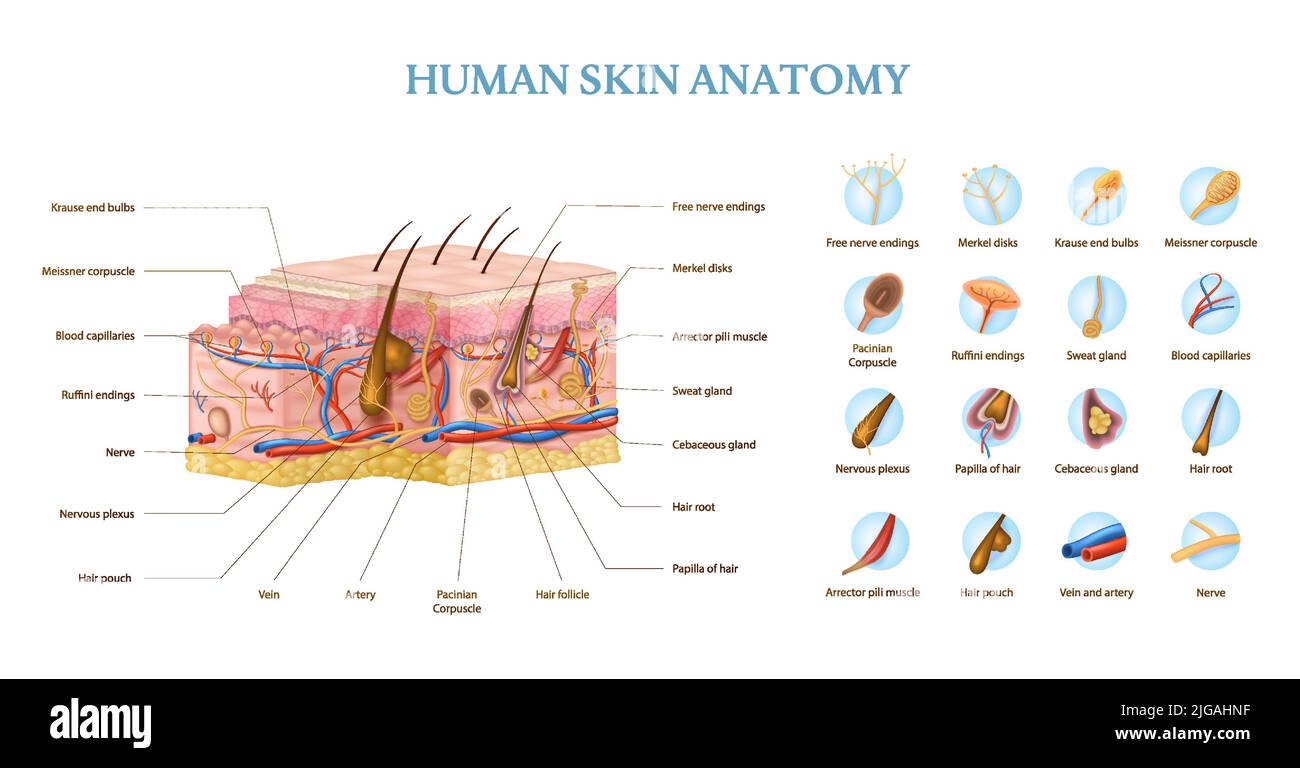 Human skin anatomy infographics with cross section of layers and text captions realistic vector illustration Stock Vectorhttps://www.alamy.com/image-license-details/?v=1https://www.alamy.com/human-skin-anatomy-infographics-with-cross-section-of-layers-and-text-captions-realistic-vector-illustration-image474747883.html
RF2JGAHNF–Human skin anatomy infographics with cross section of layers and text captions realistic vector illustration
 Pie chart color line template. Infographic shape Stock Vectorhttps://www.alamy.com/image-license-details/?v=1https://www.alamy.com/pie-chart-color-line-template-infographic-shape-image563979351.html
RF2RNFDBK–Pie chart color line template. Infographic shape
 Set of pie chart diagrams. Circles cut on 4, 6, 8, 10 and 14 slices with empty middle. Shades of green and blue gradient on white background, simple f Stock Vectorhttps://www.alamy.com/image-license-details/?v=1https://www.alamy.com/set-of-pie-chart-diagrams-circles-cut-on-4-6-8-10-and-14-slices-with-empty-middle-shades-of-green-and-blue-gradient-on-white-background-simple-f-image472102630.html
RF2JC23M6–Set of pie chart diagrams. Circles cut on 4, 6, 8, 10 and 14 slices with empty middle. Shades of green and blue gradient on white background, simple f
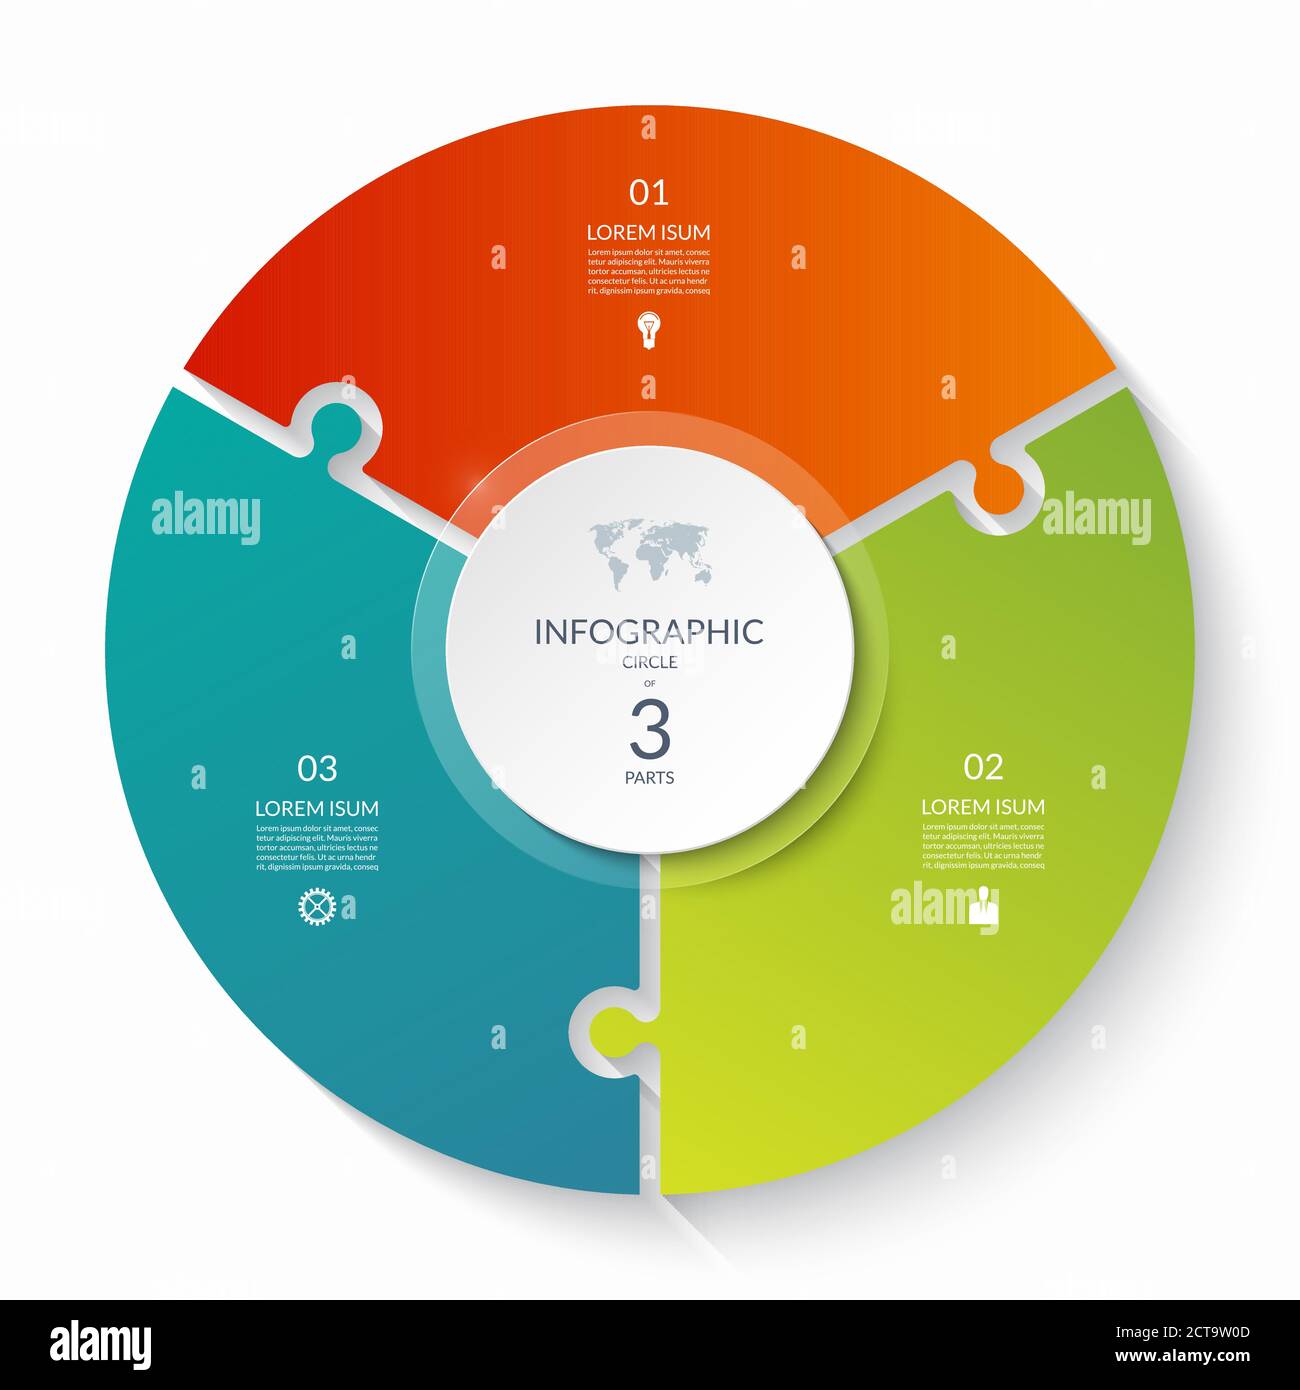 Puzzle infographic circle with 3 steps, options, pieces. Three-part cycle chart. Can be used for diagram, graph, report, presentation, web design. Stock Vectorhttps://www.alamy.com/image-license-details/?v=1https://www.alamy.com/puzzle-infographic-circle-with-3-steps-options-pieces-three-part-cycle-chart-can-be-used-for-diagram-graph-report-presentation-web-design-image376386653.html
RF2CT9W0D–Puzzle infographic circle with 3 steps, options, pieces. Three-part cycle chart. Can be used for diagram, graph, report, presentation, web design.
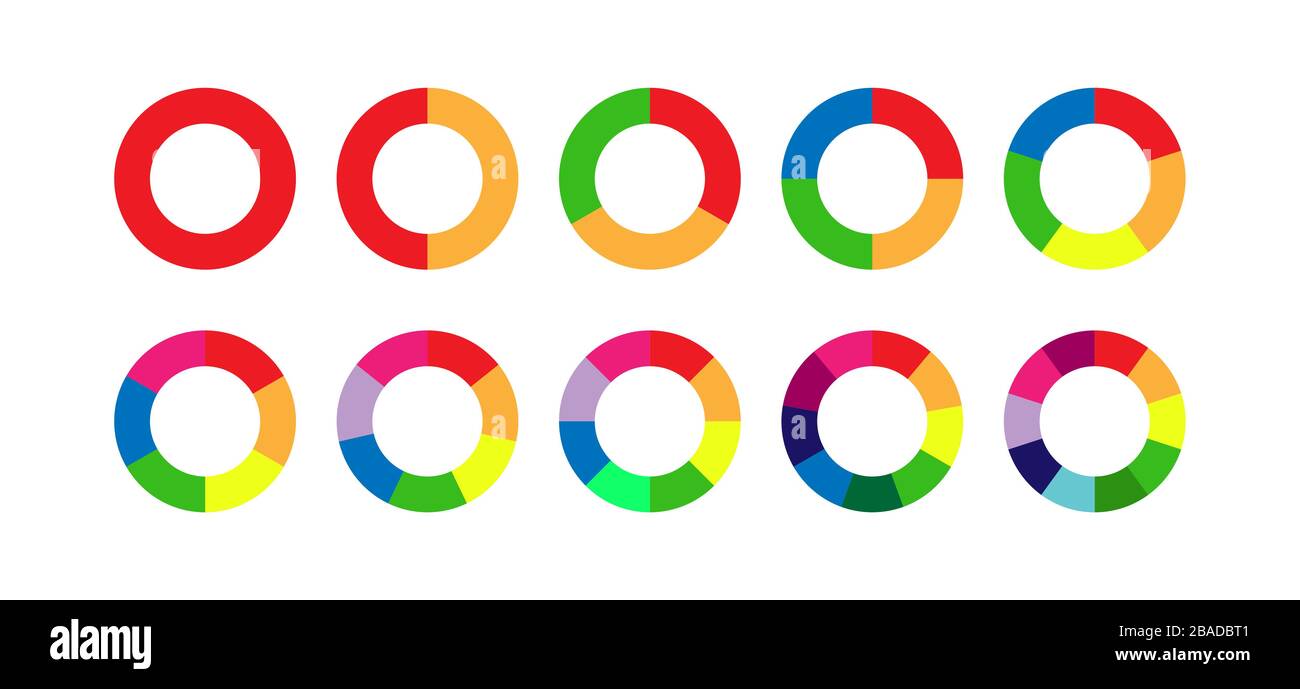 set of colored pie charts for 1,2,3,4,5,6,7,8,9,10 steps or sections to illustrate a business plan, infographic, reporting. Simple design, stock vecto Stock Vectorhttps://www.alamy.com/image-license-details/?v=1https://www.alamy.com/set-of-colored-pie-charts-for-12345678910-steps-or-sections-to-illustrate-a-business-plan-infographic-reporting-simple-design-stock-vecto-image350648593.html
RF2BADBT1–set of colored pie charts for 1,2,3,4,5,6,7,8,9,10 steps or sections to illustrate a business plan, infographic, reporting. Simple design, stock vecto
 Flat yellow 4 part detalized pie chart poster. Vector illustration for report, web site or application Stock Vectorhttps://www.alamy.com/image-license-details/?v=1https://www.alamy.com/flat-yellow-4-part-detalized-pie-chart-poster-vector-illustration-for-report-web-site-or-application-image466466557.html
RF2J2WARW–Flat yellow 4 part detalized pie chart poster. Vector illustration for report, web site or application
 Infographic pie chart. Cycle presentation diagram 5 section. Vector isolated on white background . Stock Vectorhttps://www.alamy.com/image-license-details/?v=1https://www.alamy.com/infographic-pie-chart-cycle-presentation-diagram-5-section-vector-isolated-on-white-background-image450698011.html
RF2H571WF–Infographic pie chart. Cycle presentation diagram 5 section. Vector isolated on white background .
 Heptagon 7 radar template spider mesh chart, diagram spider 7S blank hepta radar chart template Stock Vectorhttps://www.alamy.com/image-license-details/?v=1https://www.alamy.com/heptagon-7-radar-template-spider-mesh-chart-diagram-spider-7s-blank-hepta-radar-chart-template-image468309284.html
RF2J5W97G–Heptagon 7 radar template spider mesh chart, diagram spider 7S blank hepta radar chart template